
CPM Calculator
Calculate cost per thousand impressions for your ad campaigns.
CPM = (Cost ÷ Impressions) × 1,000
You've calculated your CPM a hundred times this month. Maybe more. You know the number cold: $8.47, or $12.23, or whatever yours is. And you think knowing that number means something. It doesn't, not the way you're using it. I've spent seven years watching smart marketers optimize their CPM down to nothing while their revenue does the same thing. The calculator works fine. Your interpretation of what it's telling you? That's the problem.
TL;DR
Look, most people obsess over lowering their CPM. That's backwards. A $22 CPM that converts beats a $6 CPM that doesn't, every single time. Standard calculators measure cost efficiency but ignore outcome quality, leading you to optimize for cheap impressions rather than valuable ones. Your CPM reflects competition intensity and audience scarcity, not just your campaign performance. Lower CPMs frequently mean you're reaching low-intent audiences or buying remnant inventory that won't convert. Platform-specific structures require different strategic approaches since Instagram, YouTube, and LinkedIn operate on fundamentally different pricing models. Viewability rates vary dramatically by placement. Attribution windows change how you should value CPMs across awareness versus conversion campaigns. Premium placements with high CPMs often deliver better returns because they reach decision-makers during high-attention moments.
The Hidden Flaw in How We Use CPM Calculators
CPM calculators tell you what you paid per thousand impressions. They don't tell you whether those impressions mattered.
I've watched countless marketing teams celebrate CPM reductions while their conversion rates collapsed, because they optimized for the wrong success signal. The fundamental issue sits in how we frame the calculation itself. You input your total spend and impression count, get a number back, and immediately start asking how to make that number smaller. This reflex treats all impressions as equally valuable. They absolutely aren't.
Think about what happens when you check your CPM after a campaign. You see a number. Maybe it's $8.50. Maybe it's $22. Your brain immediately categorizes this as "good" or "bad" based on some benchmark you've internalized. But that number carries zero information about whether anyone paid attention, whether your audience had purchase intent, or whether those impressions occurred in contexts that could possibly drive business outcomes.

The calculator executes its math perfectly. You spent X dollars, received Y impressions, and the CPM formula delivers a precise cost per thousand. The precision creates an illusion of meaningfulness. We treat calculated numbers as objective truth, forgetting that the inputs themselves might be measuring the wrong things.
Here's what your calculator actually shows you versus what it hides:
|
What CPM Calculators Show You |
What They Don't Show You |
|---|---|
|
Cost per 1,000 impressions |
Whether anyone noticed those impressions |
|
Total spend efficiency |
Audience quality and purchase intent |
|
Impression volume delivered |
Frequency distribution and overexposure |
|
Platform-reported metrics |
Viewability rates and actual exposure |
|
Aggregate campaign costs |
Hidden fees, verification, and overhead |
|
Cross-platform cost comparison |
Incompatible measurement standards |
|
Static snapshot numbers |
Creative fatigue and performance decay |
|
Impression delivery |
Attribution paths and conversion influence |
Every row in that table represents a decision-making blind spot. You're steering your campaigns based on half the picture, wondering why your "optimized" spend isn't translating to better results.
What Your CPM Calculator Reveals About Ad Auction Dynamics (That You're Ignoring)
That $15 CPM? It's not really about your campaign. It's about how many other advertisers are fighting you for the same audience right now. Supply and demand, basic economics, except nobody thinks about it that way.
High CPMs mean you're in a bidding war. Five other brands want this same audience. That's actually good news. It means you're targeting someone valuable. Everyone else figured that out too.
Conversely, rock-bottom CPMs often mean you've found inventory nobody else wants. The auction cleared at a low price because demand was weak. Maybe the audience doesn't convert. Maybe the placement performs poorly. Maybe other advertisers tested this inventory and abandoned it. Your calculator shows you won a cheap auction without explaining that you might have won a worthless prize.

Platform algorithms also manipulate your CPM based on predicted engagement rates. Facebook and Google reduce your costs when they expect your ad will generate interactions, because engagement keeps users on-platform longer. Your CPM calculator shows the result of this prediction, not just market rates. When your CPM suddenly drops, it might mean the algorithm detected something in your creative that historically drives engagement. When it spikes, the algorithm might be signaling that your ad will underperform.
These auction dynamics operate invisibly behind your calculator results. You see the final clearing price. You don't see the competitive landscape, the algorithmic adjustments, or the supply scarcity that produced that price.
A SaaS company targeting CFOs of mid-market companies saw their CPM jump from $22 to $38 during budget planning season (September through November). They initially panicked and considered pausing campaigns. After analyzing conversion data, they discovered their cost per qualified lead actually dropped 15% during this period because they were reaching decision-makers at exactly the moment they were evaluating software purchases for the next fiscal year. The high CPM reflected appropriate market pricing for access to in-market buyers, not campaign inefficiency. The CFO kept asking why we were "wasting money" during Q4. I sent him the pipeline report. He stopped asking.
The CPM formula itself is simple: (Total Spend ÷ Total Impressions) × 1,000. But that simplicity obscures the complex market forces that determined both your spend and your impression delivery. You're not just calculating a cost. You're receiving a market signal that requires interpretation.
Why Lower CPMs Often Signal Campaign Failure
So you dropped your CPM from $18 to $7. Hell yeah, right? You expanded targeting, loosened some parameters, and boom, cheaper impressions. Except your conversion rate just died. This happens constantly, and people still celebrate the CPM drop.
This pattern repeats because cheaper impressions usually come from less qualified audiences. You can always reduce your CPM by targeting broader, less competitive audience segments. The calculator will show improvement. Your revenue won't.
Most of those cheap impressions? Remnant inventory. The ad slots nobody else wanted. Publishers couldn't sell them at real prices, so they're dumping them cheap just to fill the space. You're buying the leftovers.
Geographic arbitrage creates another low-CPM trap. You can tank your average CPM by adding countries with lower advertising costs. Your calculator shows success while you're burning budget on audiences that can't purchase your product or don't match your customer profile. I've seen campaigns where adding tier-three markets cut CPM by 60% while generating zero qualified leads.
Bot traffic and invalid impressions also suppress CPMs. Fraudulent inventory sells cheap because it's worthless. Some platforms and exchanges have better fraud detection than others, meaning your low CPM might partially reflect fake traffic that your calculator treats as legitimate impressions. You're calculating how efficiently you bought bot views.

Programmatic exchanges often deliver lower CPMs than direct buys because you're accessing inventory that couldn't be sold at higher rates. The math works beautifully in your calculator. The performance usually doesn't work at all in your conversion tracking.
Before you celebrate that CPM drop, check for these warning signs (and be honest with yourself):
-
Did your conversion rate tank by 15% or more compared to the previous period?
-
Did you expand to countries where nobody can actually buy from you?
-
Did your audience size suddenly triple? (This is never good)
-
Are you buying programmatic now instead of direct? (Cheaper for a reason)
-
Did you turn off your exclusion lists to save money? (False economy)
-
Did your click-through rate fall while CPM improved?
-
Are you now targeting third-party audiences instead of first-party?
-
Did your platform quality score or relevance ratings decline?
You get the idea. If you checked more than two of these, your "win" is actually a loss. Each checkbox represents a quality degradation that produces lower CPMs. Your calculator captures the cost benefit. It completely misses the value destruction.
The Frequency Problem That CPM Calculations Mask
$10 CPM. Looks fine. But here's what that number hides: you just showed the same ad to the same 100 people six times. In one week. They're not interested. They weren't interested the first time, and they're definitely not interested now.
Your aggregate CPM looks great because you're averaging everything together. Meanwhile, you're hammering 10% of your audience into submission while barely reaching the other 90%. The math works out. The strategy doesn't.
Frequency caps theoretically solve this, but implementation varies wildly across platforms. Your calculator incorporates all delivered impressions regardless of whether they occurred within reasonable frequency limits. You're paying for impression seven, eight, and nine at the same CPM as impression one, even though response rates collapse after the third exposure.
Response rates don't just decline with frequency. They collapse. I've tracked campaigns where the first impression generates a 2.8% engagement rate, the second impression drops to 1.9%, and by the fifth impression you're looking at 0.4%. But when you calculate CPM, you're averaging across all these impressions as if they delivered equal value.
Cross-platform frequency creates another blind spot. Someone might see your ad three times on Facebook, twice on Instagram, and once on Audience Network, all within 24 hours. Each platform reports impressions separately. Your CPM calculator processes these as distinct impressions, missing the overexposure pattern that's wasting your spend.
Here's roughly what happens to your effective costs as frequency builds (based on campaigns I've run, your numbers will vary):
|
Frequency Level |
Typical Response Rate |
Effective CPM Impact |
Strategic Action |
|---|---|---|---|
|
1-2 impressions |
Baseline (100%) |
Standard CPM |
Maximize reach in this range |
|
3-4 impressions |
60-80% of baseline |
25-40% higher effective CPM |
Acceptable for consideration phase |
|
5-7 impressions |
30-50% of baseline |
100-150% higher effective CPM |
Cap frequency or refresh creative |
|
8+ impressions |
10-20% of baseline |
400-500% higher effective CPM |
Immediate action required |
That table reveals the hidden economics. Your calculator might show a steady $12 CPM throughout your campaign. Your actual cost per valuable impression might be climbing from $12 to $60 as frequency accumulates. The math is correct. The insight is absent.
Side note: I once saw a campaign run the same creative for 11 months. Eleven months. The CPM had tripled, CTR was 0.2%, and they couldn't figure out why it "stopped working." It didn't stop working. It died of old age.
Platform-Specific CPM Variations That Change Your Strategy
YouTube and Facebook both show $12 CPM in your dashboard. Cool, they're the same, right? Wrong. YouTube charges for actual video views, someone watching for 30 seconds. Facebook charges when your ad enters the viewport for half a second. These aren't even remotely comparable.
YouTube charges for video views (after 30 seconds or completion), not just impressions. The CPM reflects engagement thresholds built into the format. Facebook charges for impressions the moment an ad enters the viewport, regardless of viewing duration. These aren't comparable metrics even when your calculator returns similar numbers.
LinkedIn costs 3-5x more than Facebook. Before you freak out about that, remember what you're buying: people at work, in a professional mindset, who actually have budgets. Facebook is people scrolling at 11pm in their pajamas. Context matters.
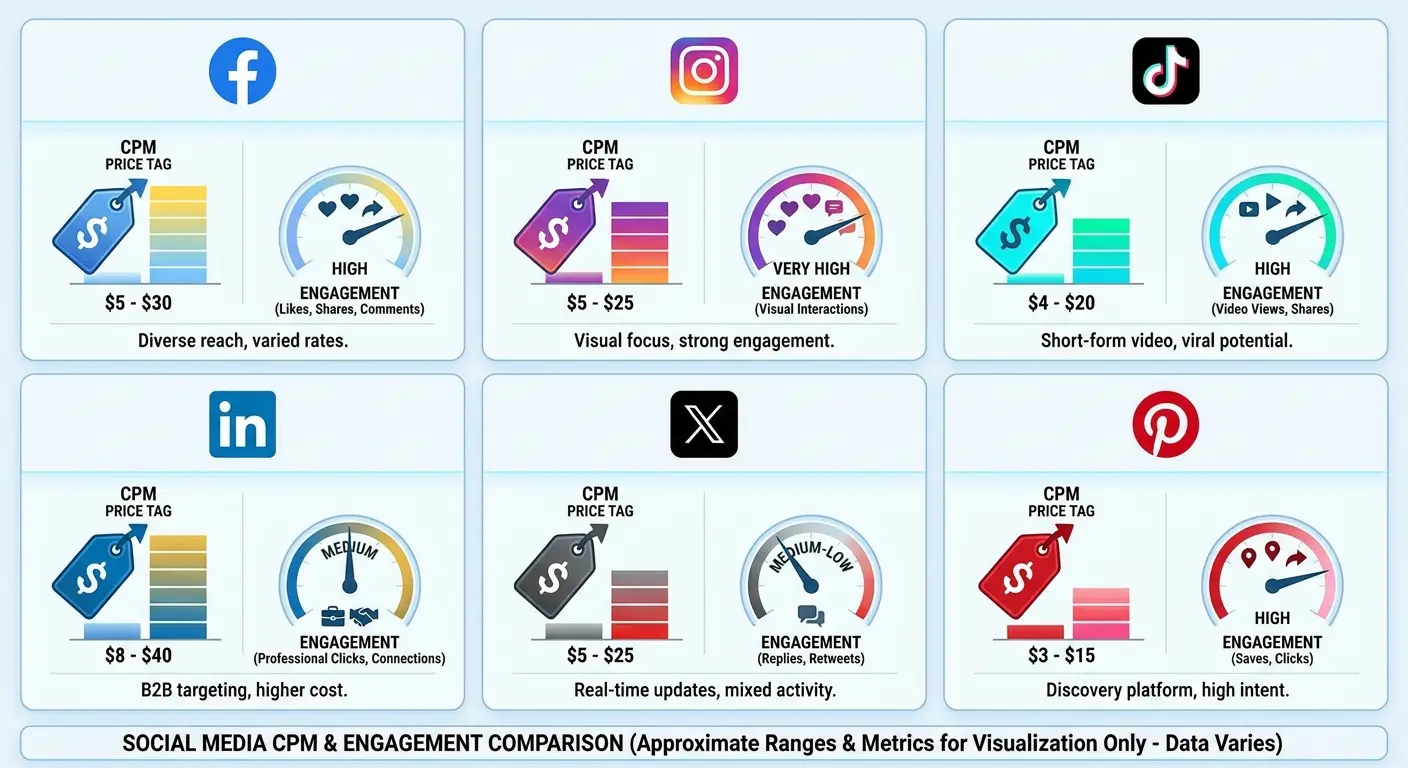
Display network CPMs vary based on site quality, ad position, and format. A $3 CPM on a programmatic exchange might buy you a 300x250 pixel box at the bottom of a content farm. An $8 CPM on a premium publisher might buy you a high-visibility placement on a trusted site. Your calculator treats both as equivalent impressions.
TikTok's CPM structure rewards native-feeling content that users don't immediately recognize as ads. The platform algorithmically reduces CPMs for creative that generates organic-style engagement. Your calculator shows the result without revealing that creative quality directly influences your costs on this platform more than others. You can't optimize TikTok CPMs through targeting alone. Creative execution determines your costs.
Twitter (X) charges based on engagement objectives, not just impressions. When you calculate CPM on Twitter campaigns, you're measuring a different transaction than impression-based platforms. The denominator in your calculation includes impressions, but the pricing model optimizes for interactions.
I worked with an enterprise software company last year (cybersecurity, mid-market focus). We ran the same targeting on LinkedIn and Facebook. LinkedIn: 50,000 impressions, $42 CPM. Facebook: 500,000 impressions, $8 CPM. The Facebook numbers looked incredible. Then we tracked conversions. LinkedIn generated 23 qualified demos from decision-makers with budget authority. Facebook generated 187 form fills, but only 4 came from relevant job titles and companies. The LinkedIn CPM was 5x higher but delivered qualified pipeline at one-third the cost per opportunity.
Platform-specific mechanics mean you need separate benchmarks and evaluation frameworks for each channel. Your CPM calculator can process the numbers. You need to supply the context about what those numbers actually represent on each platform.
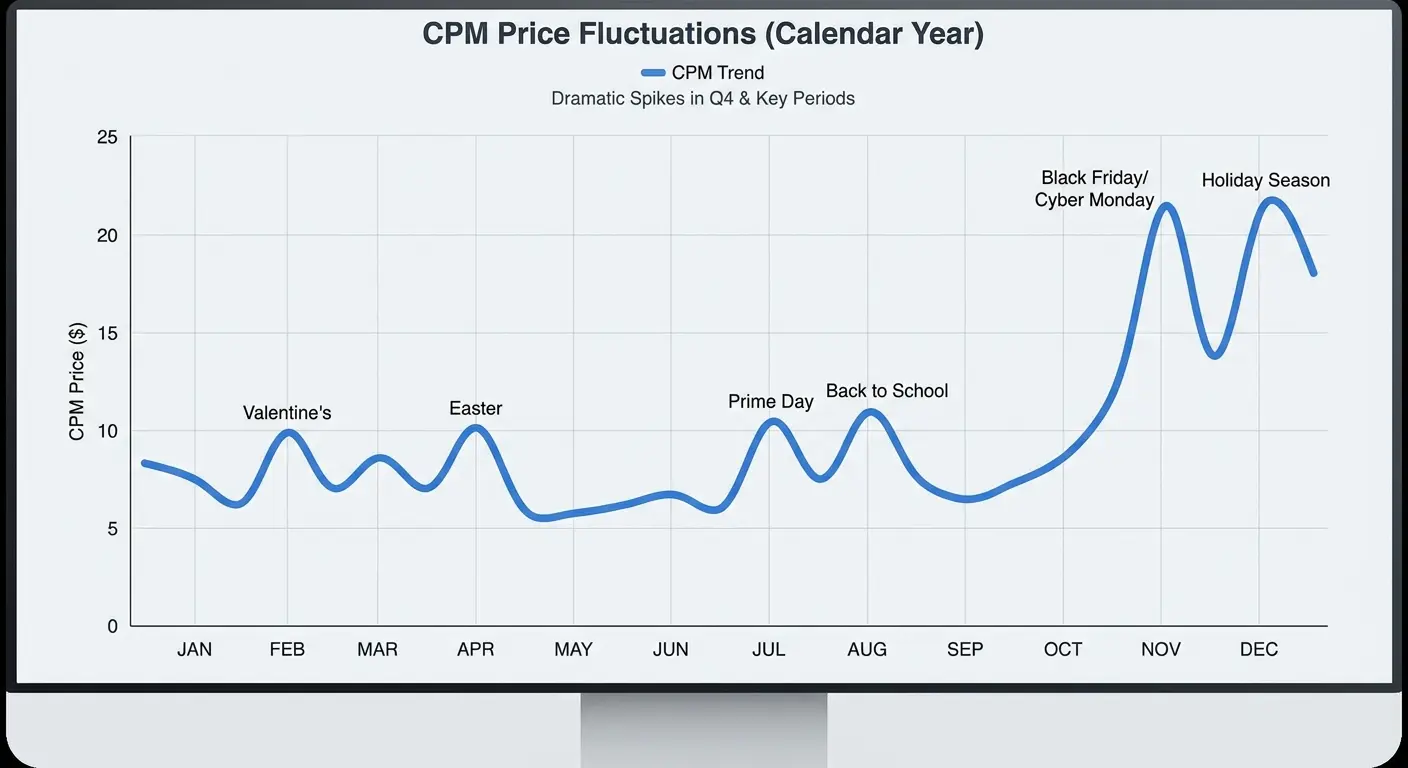
Seasonal CPM Fluctuations and Budget Allocation Timing
November CPM: $22. February CPM: $8. Same audience, same targeting. You're freaking out, thinking something broke. Nothing broke. This is Q4. Every retail brand on earth is flooding the auction with holiday budget. It's supposed to be expensive right now.
Q4 is a bloodbath. Retail brands dump their entire year's budget into October through December. Supply stays the same, demand triples, prices explode. Basic economics, but it catches people off guard every single year. I've tracked CPM swings of 200-400% between low and high seasons in competitive verticals. Back-to-school periods, tax season, and industry-specific events create smaller but still significant fluctuations. Your year-over-year CPM comparisons mean nothing without accounting for these seasonal patterns.
Budget pacing also influences your effective CPM. Campaigns set to spend evenly throughout the month might pay higher average CPMs than campaigns that concentrate spend during lower-competition windows. Your calculator shows the outcome but doesn't reveal that timing strategy directly impacted your costs. I've seen campaigns cut their average CPM by 18% simply by front-loading spend to the first week of the month before competition intensifies.
Day-of-week and hour-of-day patterns create micro-fluctuations. Weekend CPMs often run lower in B2B verticals and higher in entertainment categories. Your calculator aggregates these variations into a single number, hiding optimization opportunities in temporal targeting. If you're calculating monthly CPM averages, you're smoothing over patterns that could inform smarter scheduling.
The way you calculate CPM across time periods matters. Monthly averages hide weekly volatility. Weekly averages hide daily spikes. Campaign-level calculations obscure the timing patterns that drive cost variations.
Understanding how CPM is calculated across different timeframes helps you identify whether cost increases reflect your campaign performance or external market conditions. When your calculator shows rising costs, you need to know whether you should adjust your strategy or just wait out a seasonal spike.
The Viewability Factor Missing From Standard CPM Calculations
Your calculator counts every impression the platform says they delivered. Nobody's checking if humans actually saw them. And trust me, a lot of those impressions loaded below the fold while someone was scrolling past at lightspeed.
Impression loads at the bottom of the page. User never scrolls down. You paid for it anyway. It counts in your CPM calculation. This happens thousands of times per campaign.
Calculating effective CPM requires dividing your spend by viewable impressions, not just delivered impressions. A $5 CPM with 50% viewability actually costs $10 per thousand viewed impressions. An $8 CPM with 90% viewability costs $8.89 per thousand viewed impressions. The second option performs better despite the higher nominal CPM.
Video viewability introduces additional complexity. Platforms define "viewable" differently. Facebook counts a video view at 3 seconds. YouTube uses 30 seconds or completion. Your calculator aggregates these impressions without distinguishing between a 3-second exposure and a 30-second view. When you calculate impressions across video platforms, you're combining incompatible measurement standards.
Mobile app placements show higher viewability than mobile web because of format differences and user behavior patterns. Your calculator might show similar CPMs across both, missing that app impressions deliver more actual exposures per dollar spent.
Okay, here's the math you should actually be doing (grab a calculator):
What you really paid per viewed impression:
Take your platform CPM: $_______
Find your viewability rate: _______%
Divide the CPM by viewability rate
Multiply by 100
Example from a campaign I ran:
- Platform said: $6 CPM
- Viewability was: 55%
- Real cost: $10.91 per thousand people who actually saw it
Yeah. That's a different story. That adjustment changes everything. Two campaigns with identical reported CPMs might have 50% different costs when you account for viewability. Your calculator doesn't make this adjustment automatically. You need to build it into your analysis framework.
Brand Safety Costs That Inflate Your Real CPM
Your dashboard says $6 CPM. Cool. Except you're running IAS verification, brand safety filters, and exclusion lists. Those add 20% to your real costs. So you're actually paying $7.20, but nobody puts that in the calculator.
IAS, DoubleVerify, all those verification services? They cost 10-15% of your media spend. You need them (unless you want your ad showing up on conspiracy theory blogs), but they're invisible in your CPM calculations.
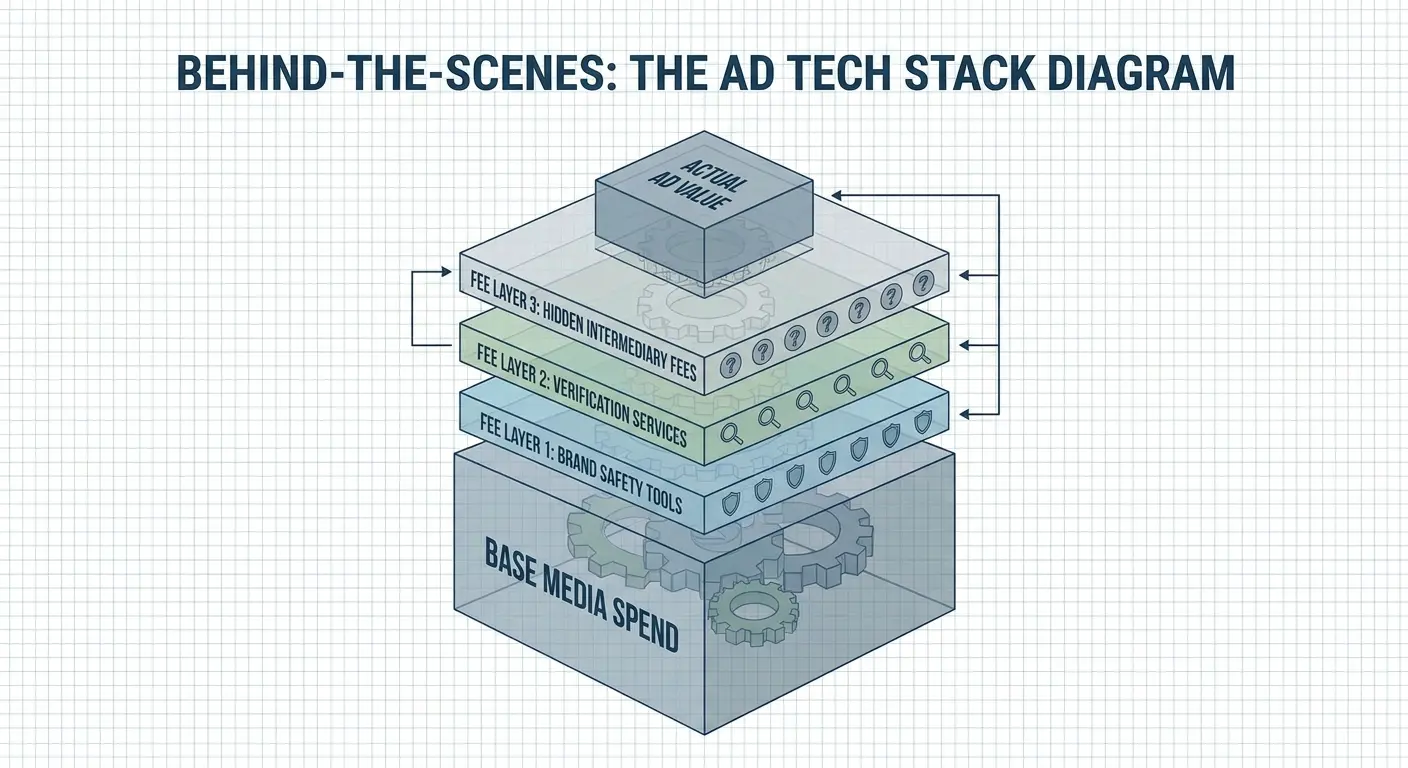
Contextual targeting tools that ensure your ads avoid controversial content add another layer of cost. These services filter inventory before bidding, which can increase your average CPM by reducing available supply. Your calculator sees the higher clearing price but doesn't attribute it to safety filtering.
Exclusion lists for apps, sites, and content categories shrink your available inventory. Reduced supply means higher competition for remaining placements, driving up your CPMs. You're paying a premium for brand safety through auction mechanics, not just service fees. I've measured CPM increases of 25-35% when implementing comprehensive exclusion lists compared to running wide open.
Post-bid filtering catches problematic placements after the fact, but you've already paid for those impressions. Your calculator includes them in total spend and impression counts. You didn't get value from them, but they still inflate your reported CPM. A cost per thousand calculator that only looks at platform spend misses the impressions you paid for but blocked from delivery.
Agency fees and trading desk charges add another 10-20% to your effective CPM. Your calculator processes the media cost. The fully-loaded cost per impression includes all these layers of overhead that enable your campaigns to run safely and effectively.
How Audience Quality Distorts CPM Comparisons
Campaign A: $4 CPM, broad targeting, anyone who likes "business."
Campaign B: $16 CPM, in-market shoppers actively searching for your product category.
Your boss sees the $4 CPM and thinks you're brilliant. Then Campaign B converts at 10x the rate and suddenly that $16 CPM is the bargain.
Audience quality determines whether an impression has any chance of generating business value. Your CPM calculator doesn't measure quality. It counts impressions regardless of whether they reached someone with purchase intent, budget authority, or relevant needs.
Lookalike audiences decay in quality as you expand from 1% to 5% to 10% similarity. Your CPM drops as you move down the quality ladder because you're competing less intensely for each impression. The calculator shows cost improvement while your campaign effectiveness deteriorates. The CPM formula processes cheaper impressions without questioning why they're cheaper.
First-party data targeting generates higher CPMs than third-party data segments because you're reaching known customers or qualified leads. Your calculator might flag this as inefficient spending when it's actually your highest-value inventory.

Retargeting CPMs often run higher than prospecting CPMs because you're bidding against competitors who also identified these users as valuable. Your calculator shows the premium but doesn't reveal that you're paying more to reach people who've already expressed interest in your category. These higher-CPM impressions frequently convert at 5-10x the rate of cold prospecting impressions.
Intent signals change impression value completely. Someone who searched for "enterprise CRM software" in the past week represents far more value than someone who generally fits your demographic profile. The high-intent impression might cost 3x more. It might convert at 15x the rate. Your calculator only sees the cost multiple, not the value multiple.
I've seen campaigns where doubling the CPM tripled the conversion rate, cutting the cost per acquisition in half. The calculator showed higher impression costs. The business outcome improved dramatically. This pattern repeats whenever you're trading impression volume for impression quality.
CPM Calculator Inputs That Demand Skepticism
You're taking Facebook's impression numbers and plugging them straight into your calculator like they're gospel truth. They're not. Facebook is measuring their own performance and reporting it to you. See the conflict of interest?
Impression counting methodologies vary across platforms, and none of them are fully transparent. Facebook counts an impression when an ad is rendered, even if it's on-screen for a fraction of a second. Google Display Network has different standards. Your CPM calculator aggregates these incompatible metrics into a single figure.
Bots. Everywhere. Depending on who you ask, 10-30% of programmatic impressions are fake. Some platforms are better at catching them than others. Your calculator counts them all as real impressions anyway.
Accidental impressions count the same as intentional views. Someone scrolling past your ad in 0.3 seconds generates an impression. Someone stopping to read it generates the same impression. Your CPM calculator treats both identically. When you calculate CPM, you're averaging across engaged views and accidental exposures without distinction.
Platform self-reporting creates inherent conflicts of interest. Facebook, Google, and other platforms measure their own performance and report the numbers you use in your calculations. Third-party audits consistently find discrepancies, but most marketers still use platform data without verification.
Impression duplication across devices and browsers also skews your numbers. The same person might generate separate impressions on mobile, desktop, and tablet. Your calculator counts three impressions to one person, inflating your denominator and making your CPM look better than the per-person cost actually is.
Cross-device tracking failures mean you're often reaching the same people repeatedly across devices while your calculator treats each exposure as reaching someone new. Your reach is lower than your impression count suggests. Your effective CPM per unique person is higher than your calculator reports.
The Attribution Window Blind Spot in CPM Analysis
Your CPM calculator treats every impression the same. Awareness impression? Conversion impression? Doesn't matter, both cost $12. Except one drives a sale this week and one drives a sale in three months. Kind of a big difference.
Top-of-funnel impressions might not generate clicks or conversions within standard attribution windows, but they create awareness that influences later decisions. You're paying the same CPM for these impressions as for bottom-funnel ads, but measuring them with completely different success criteria. How do you calculate CPM value when the outcome won't materialize for weeks or months?
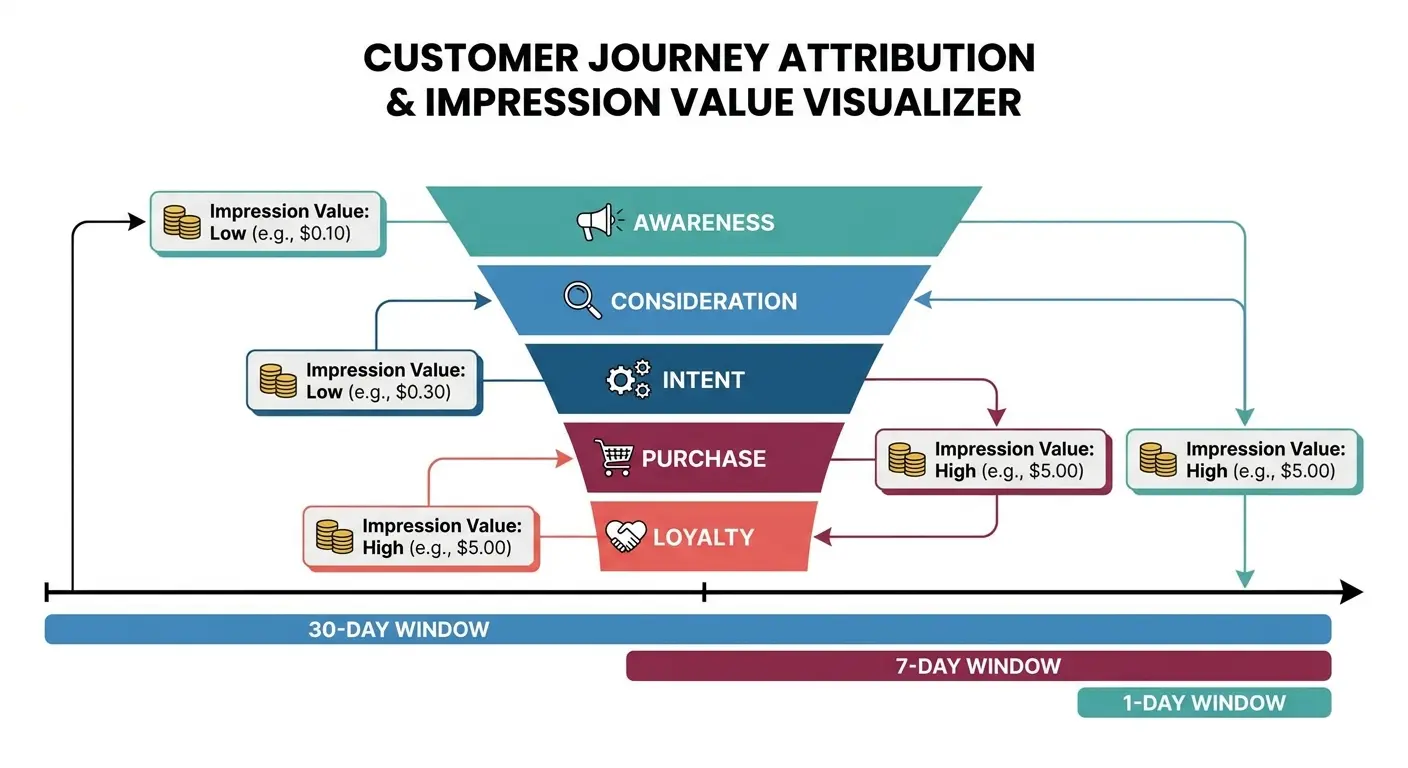
Seven-day click attribution windows make awareness campaign CPMs look terrible. You paid $12 per thousand impressions, and only 0.1% converted within a week. The math suggests you overpaid. You actually planted seeds that will mature over months, but your calculator and attribution setup can't capture that value.
View-through attribution partially addresses this gap, but implementation is inconsistent. Some platforms offer 1-day view-through windows, others offer 28 days. Your CPM calculator doesn't adjust for these differences when comparing campaign efficiency across platforms. You might be comparing a 1-day attribution CPM against a 28-day attribution CPM without realizing the metrics aren't equivalent.
Cross-device attribution failures also distort CPM analysis. Someone sees your ad on mobile, researches on tablet, and purchases on desktop. Most attribution systems miss this path. Your mobile campaign shows a high CPM with low conversions. Your desktop campaign shows lower CPM with higher conversions. You conclude mobile is inefficient and shift budget, killing the awareness driver that was actually feeding your desktop conversions.
Real example: B2B agency, client selling $50K/year contracts (marketing automation platform). They ran two campaigns:
Campaign A: LinkedIn video, $38 CPM, brand awareness, no conversion tracking (because the client was skeptical of "soft metrics")
Campaign B: Google Search, $22 CPM, lead forms, everything tracked
Three months in, Search looked like the obvious winner. Lower CPM, direct conversions, clean attribution. The client almost killed the LinkedIn campaign. I convinced them to do customer interviews first, ask people how they found us. 68% said they first saw the brand on LinkedIn, then searched for it weeks later. The "expensive" awareness campaign was feeding the "cheap" conversion campaign. The CPM comparison was meaningless.
The CPM price you pay for an impression needs to be evaluated against the attribution window you're using to measure that impression's impact. Your calculator doesn't make this connection. You need to build it into your analysis framework manually.
Creative Fatigue Economics Through a CPM Lens
Week 1: $8 CPM, 2.1% CTR. Looking good.
Week 3: $11 CPM, 0.9% CTR. What happened?
Your creative died. People are sick of seeing the same ad. The platform sees engagement dropping and charges you more because low engagement signals bad user experience. Your calculator shows rising costs. The real problem is you've been running the same creative for three weeks.
Platforms charge you more when your ads underperform because low engagement signals poor user experience. Your CPM rises as your creative wears out, even if competitive dynamics and audience targeting remain constant. The calculator captures the symptom without diagnosing the cause. Understanding cost per thousand requires understanding how creative performance influences auction outcomes over time.
Frequency and creative fatigue interact in ways that compound your CPM increases. Users who've seen your ad five times are less likely to engage than first-time viewers. Platforms detect this declining engagement and raise your costs. You're paying a fatigue penalty that accumulates over campaign duration.
Creative refresh cycles directly impact your average CPM over time. Campaigns that rotate new creative every 2-3 weeks maintain lower CPMs than campaigns running the same assets for months. Your calculator shows the aggregate difference but doesn't reveal that creative management strategy is a cost control mechanism.
The economics of creative production versus media efficiency create a tension that CPM calculators don't capture. Spending $5,000 on new creative every month might seem expensive until you realize it's keeping your CPMs 30% lower and your conversion rates 40% higher than running stale ads. Your calculator shows you the media cost per impression. It doesn't show you the creative investment that's keeping that cost low.
I've tracked campaigns where CPMs climbed 40-60% over eight weeks as creative fatigued, then dropped back to baseline within 48 hours of launching fresh assets. The audience didn't change. The targeting didn't change. The creative lifecycle drove the entire cost curve.
When High CPMs Actually Indicate Smart Spending
$45 CPM to reach CFOs and VPs in your target industry. Your calculator is screaming that this is expensive. Your sales team just closed three deals worth $180K total from those impressions. Was $45 CPM expensive? No, it was the cheapest money you spent all quarter.
Homepage takeovers cost a fortune. First-position video ads cost a fortune. Exclusive sponsorships cost a fortune. They also work better than everything else because people actually notice them. Sometimes expensive is expensive for a reason.
Decision-maker targeting naturally produces high CPMs because you're competing for scarce inventory. Only a small percentage of any platform's users hold VP-level or higher positions. When you target them specifically, you're bidding against every other B2B brand that identified the same valuable audience. High CPMs reflect appropriate market pricing for rare, valuable impressions.
High-intent moments also drive CPM premiums. Someone actively searching for your product category represents far more value than someone passively scrolling social media. Search CPMs run higher than display CPMs because you're paying for demonstrated intent, not just demographic fit. The calculation shows higher costs. The conversion data shows higher value.
Brand building campaigns targeting broad audiences often show lower CPMs than conversion campaigns targeting narrow, high-intent segments. Your calculator might suggest the brand campaign is more efficient. Your revenue data will tell a different story because conversion-focused impressions generate immediate returns despite higher costs.
Premium publisher direct buys frequently deliver 2-3x higher CPMs than programmatic exchanges. Your calculator shows the cost premium. What it doesn't show is that premium publisher audiences convert at 4-5x higher rates because they're engaged readers in trusted environments rather than distracted browsers on low-quality sites.
Hot take: If your CPM is below $5 on any platform, you're probably buying trash inventory. I don't care what your dashboard says. Premium inventory doesn't sell for $5 CPM. Ever.
Building a CPM Framework That Connects to Revenue
Your calculator gives you cost per thousand impressions. What you actually need is cost per thousand impressions that matter. That requires doing more work than plugging numbers into a calculator.
Stop calculating one CPM for everything. Break it down:
- First-party audiences (your customers): $____
- High-intent segments (in-market): $____
- Lookalikes: $____
- Broad targeting (Hail Mary): $____
Now you can actually see what you're paying for quality vs. garbage.
Layer in viewability adjustments to every CPM calculation. Divide your spend by viewable impressions, not just delivered impressions. This immediately reveals which placements and formats deliver real exposure versus technical delivery that nobody sees.
Track CPM trends over time within individual campaigns to catch creative fatigue before it destroys your efficiency. When you see CPMs rising 20-30% while engagement rates fall, you know you need creative refresh regardless of what your aggregate campaign CPM looks like.

Connect your CPM data to downstream conversion metrics by calculating cost per acquisition alongside cost per impression. A $15 CPM that generates a $40 CPA outperforms a $6 CPM that generates a $90 CPA. Your calculator should facilitate this comparison, not just report impression costs in isolation.
Build platform-specific CPM benchmarks rather than cross-platform comparisons. Track your LinkedIn CPMs against your historical LinkedIn performance, not against your Facebook costs. You're looking for trends and anomalies within consistent measurement frameworks, not comparing apples to oranges.
Account for all the hidden costs that inflate your effective CPM: verification services, brand safety tools, creative production, agency fees, and attribution technology. Your true cost per impression includes this overhead, not just the media spend that platforms report.
Create scenario models that show how CPM changes impact your bottom line. If reducing your CPM by 30% decreases your conversion rate by 50%, the math clearly shows you should pay the higher CPM. Your calculator should enable this analysis, not just report costs.
Most importantly, stop treating CPM as a success metric. It's a cost input that needs to be evaluated against value outputs. Your framework should position CPM as one variable in a larger equation that connects impression delivery to revenue generation.
Now, I mostly work with B2B SaaS and professional services. If you're in D2C e-commerce or local services, some of this might work differently. The principles hold, but the numbers will vary.
I work with brands who've optimized their CPM into the ground while their revenue went nowhere. If that's you, we should talk. I build attribution models that actually connect your media spend to revenue, not just impressions to clicks. We specialize in performance analysis that reveals which impressions actually matter, not just which ones cost less.
Final Thoughts
Look, CPM calculators work fine. The problem is you're treating the output like it means something on its own. It doesn't.
Every CPM you calculate is hiding a dozen variables: auction dynamics, audience quality, creative fatigue, viewability rates, frequency distribution, platform-specific mechanics. You're looking at one number and making decisions like it's the whole story.
The best marketers I know? They barely look at CPM. They look at cost per customer. Revenue per impression. Contribution margin by channel. CPM is just one input in a much bigger equation.
So use your calculator. Run your numbers. But stop optimizing for lower CPMs and start optimizing for better outcomes. That $22 CPM that drives revenue beats the $6 CPM that drives nothing. Every single time.
And if you're stuck trying to connect your impression costs to actual business results, that's what I do. Email me.