Your dashboard’s probably open right now. Seventeen tabs of metrics, all color-coded, all updating in real-time. Click-through rates, CAC, conversion funnels, engagement percentages. You’re tracking everything.
And you’re still getting blindsided by market shifts.
I’ve watched this happen to three clients in the past year. Companies with more data than they know what to do with, still missing the signals that actually mattered. The problem? They assume the most important signals are the ones they can quantify. That assumption is costing real opportunities.
The market’s speaking in languages you haven’t built measurement systems for yet. While you obsess over what’s trackable, you’re missing the subtle shifts in consumer psychology, the quiet erosion of brand trust, and the emerging patterns that don’t fit neatly into existing categories. We need more data, honestly. But we also need to expand what counts as valid intelligence in the first place.
TL;DR
-
Most market analysis focuses exclusively on quantifiable metrics while ignoring qualitative signals that predict major shifts
-
Consumer behavior is fragmented across platforms and contexts that traditional analytics tools weren’t designed to capture
-
The gap between stated preferences (survey data) and actual behavior (observational data) is widening, creating false confidence in flawed insights
-
Timing market moves requires recognizing patterns in unstructured data sources, not just analyzing historical performance metrics
-
Businesses need hybrid intelligence systems that combine quantitative rigor with qualitative interpretation
-
The most valuable market insights often emerge from sources we don’t think to monitor

Your Metrics Are Lying to You
Measurement Capability ≠ Market Reality
Businesses now have access to more data than ever before. We can track user behavior across touchpoints, measure engagement down to the second, and generate reports that would have seemed impossibly sophisticated a decade ago.
Yet market surprises still happen constantly.
How does a company with terabytes of customer data miss a competitive threat? How do brands with advanced analytics teams completely misjudge market receptivity to a new product? The paradox exists because we’ve built entire market analysis infrastructures around what’s technically measurable rather than what’s strategically meaningful.
The digital analytics revolution gave us the ability to track certain behaviors with unprecedented precision. Page views, click rates, time on site, conversion paths. These metrics were revolutionary when they first became available. For the first time, we could see exactly how people interacted with our digital properties.
The problem? The ease of tracking these metrics led organizations to prioritize them in decision-making processes, not because they were the most important signals but because they were the most accessible ones.
This measurement bias creates a self-reinforcing cycle. Teams optimize for metrics that are easy to move rather than outcomes that matter for market position. An analyst can show a 15% improvement in time-on-site, which looks great in a quarterly review. But did that extra time translate into deeper understanding, stronger preference, or higher likelihood to purchase? We don’t know, because those outcomes are harder to measure.
Organizational structures amplify this problem. Analysts get rewarded for showing improvement in tracked metrics. They get penalized for raising concerns about unmeasured factors that might indicate trouble ahead. Nobody gets promoted for saying “our engagement numbers look good, but I’m noticing worrying patterns in how people talk about us in communities we don’t monitor.” That observation sounds squishy compared to a dashboard showing green arrows.
This challenge becomes even more apparent when examining advanced analytics for strategic growth, where the gap between data volume and actionable insight widens.
The metrics themselves aren’t useless. The dangerous assumption is that what we can measure represents the full picture of market reality. Companies convince themselves they have comprehensive market intelligence when they’ve gotten really good at analyzing a narrow slice of consumer behavior. They’ve optimized their ability to see what their tools can show them while remaining consistently blind to everything else.
The better your analytics infrastructure gets, the more confident you become in your market understanding.
Which is exactly the problem.
You’re making decisions based on increasingly precise measurements of an increasingly incomplete picture. This is a solvable problem rather than an inevitable limitation. But solving it requires acknowledging that comprehensive market analysis demands expanding beyond what’s easily quantifiable.
|
What We Measure |
What We Actually Need to Know |
Why the Gap Matters |
|---|---|---|
|
Click-through rates |
Why people clicked or didn’t click |
Understanding motivation drives better creative and positioning |
|
Time on page |
Whether they found what they needed |
Engagement without outcome is meaningless activity |
|
Conversion rate |
What almost made them convert |
Near-misses reveal fixable friction points |
|
Customer acquisition cost |
Lifetime relationship quality |
Cheap customers who churn fast destroy value |
|
Market share percentage |
Direction and velocity of change |
Static snapshots miss momentum shifts |
|
Survey satisfaction scores |
Actual likelihood to repurchase |
Stated satisfaction doesn’t predict behavior |
Your Best Metrics Are Showing You Yesterday
Quarterly revenue growth. Year-over-year market share changes. Customer satisfaction scores. Net Promoter Score.
These metrics feel authoritative. Scientific. They’re what goes in board presentations, justify budget allocations, and determine whether strategies continue or get killed.
They’re also showing you the past.
Revenue growth this quarter? That’s from products launched last year, campaigns from six months ago, sales conversations that happened under market conditions that don’t exist anymore. Market share changes? That’s thousands of purchase decisions made by customers who were responding to your positioning from three months back. Customer satisfaction scores? They’re measuring how people felt about experiences they had weeks ago.
You’re steering based on where you’ve been, not where you’re going.
Yet we use these metrics to make forward-looking strategic choices. The dangerous comfort zone these metrics create is hard to overstate. Concrete numbers can be presented confidently. They provide clear benchmarks for performance evaluation. They create the appearance of scientific rigor in strategic planning. But that appearance of rigor masks a basic problem: you’re looking in the rearview mirror.
Organizations continue relying on lagging indicators despite their limitations because of psychological and political factors. Showing positive movement in established metrics is safer for individual careers than arguing for investment based on emerging signals that can’t yet be quantified. If you recommend doubling down on the current strategy and the lagging indicators support that choice, you’re covered. If you recommend pivoting based on weak signals you’re noticing in unstructured data and you’re wrong, you look foolish.

Lagging indicators can lead companies to double down on strategies that are already failing because the metrics haven’t caught up to market reality yet. The time lag between market shifts and metric changes creates a window where companies operate on false confidence, making decisions based on data that reflects a market that no longer exists.
Last year, a client came to us confused. Their NPS held steady at 42 for three quarters straight. Leadership interpreted this as stable customer satisfaction. They continued investing heavily in the same product features and marketing approach.
Six months later, renewal rates dropped 23%.
What happened? The NPS surveys captured how customers felt about past experiences, but missed the emerging frustration with a competitor’s new feature set that was gradually making the incumbent solution feel outdated. By the time the satisfaction scores dropped, dozens of customers had already made mental decisions to switch. They just hadn’t reached their renewal dates yet.
The company spent six months optimizing for a market position that had already eroded, all because their most trusted metric was showing them a rearview mirror.
Lagging indicators have value for understanding what happened. They become dangerous when treated as predictive tools for what will happen next. The market analysis challenge we face now is building systems that capture leading indicators, even when those indicators are harder to quantify and present.
Platform Fragmentation Has Shattered the Unified Customer View
The early digital era promised a unified view of customer behavior. Everything would happen in trackable environments with consistent measurement standards. We’d finally understand the complete customer journey from awareness to purchase to advocacy.
That promise has completely fallen apart.
Consumer behavior has splintered across dozens of platforms, each with its own tracking limitations, privacy policies, and measurement standards. People move fluidly between TikTok, Reddit, Discord servers, private Slack communities, group chats, niche forums, and offline conversations in ways that leave massive gaps in any single company’s ability to track their journey.
This fragmentation isn’t a technical challenge that better integration could solve. It represents a major shift in how markets form opinions and make decisions. The death of third-party cookies, increasing privacy regulations, and consumer adoption of tracking blockers are accelerating this fragmentation rather than slowing it.
So you see someone convert on your website after clicking a Facebook ad. Great. Attribution model says Facebook works.
What you don’t see: the Reddit thread where they asked for recommendations. The Discord server where your product got compared to competitors. The group chat where their friend vouched for you. The YouTube review they watched at 11pm before finally clicking your ad.
Your data says Facebook ads work. Reality? Facebook ads work when they’re the last touch in an invisible ecosystem you’re not measuring.
Platform fragmentation means that two companies analyzing the same market segment might see completely different pictures depending on which platforms they can access and measure. One company monitors Instagram and sees strong brand sentiment. Another monitors Reddit and sees growing skepticism. Both are seeing real signals, but neither has a complete view.
This fragmentation hits hardest when understanding younger consumers who move most fluidly across platforms and have the least loyalty to any single digital environment. If your market analysis infrastructure was built around Facebook and Google analytics, you’re systematically underweighting the preferences and behaviors of the demographics that will drive future market growth.
Platform Intelligence Audit Checklist
Made this for clients because I kept explaining the same gaps. Yours will look different, but here’s the basic idea:
-
Identify the top 5 platforms where your target audience spends time daily
-
Map which platforms you currently track versus which you ignore
-
List 3-5 niche communities or forums specific to your industry (this one’s critical)
-
Identify private communication channels (Discord servers, Slack groups, subreddits) relevant to your market
-
Document which customer journey stages happen on platforms you can’t measure
-
Note where competitive comparisons and recommendations happen outside your visibility
-
Identify which demographics in your audience are most platform-fragmented
-
List the tracking limitations on each platform you do monitor
-
Assess how much of the customer decision journey happens in spaces you can’t access
The Unmeasured Signals Your Competitors Miss Too
Micro-Communities, Macro Impact
There’s a Discord server with 200 people that’s basically predicting trends in your market six months before they hit.
You’ll never find it in your research. Too small. Not statistically significant. Your market research firm needs 1,000+ respondents to feel confident in findings, so these micro-communities don’t even register.
Meanwhile, those 200 people are developing the language, aesthetics, and preferences that’ll influence millions once it hits TikTok.
Small, highly engaged communities numbering in hundreds rather than thousands develop shared language, values, aesthetic preferences, and consumption patterns that later influence much larger market segments. Traditional market research focuses on statistical significance and sample sizes that automatically exclude these communities from analysis.
These micro-communities wield disproportionate influence through specific mechanisms. Community members become informal evangelists, carrying preferences and perspectives into their broader networks. Community-developed language enters broader discourse, shaping how people think and talk about entire categories. Early adoption by these groups signals broader market receptivity in ways that focus groups can’t replicate.
Why are these communities influential now? Platform algorithms and social dynamics amplify voices from passionate niche groups in ways that weren’t possible in previous media environments. A micro-community’s collective enthusiasm can generate enough content volume and engagement to trigger algorithmic distribution to much larger audiences. What starts as an inside joke or aesthetic preference in a small group can reach millions within weeks.
The challenge of identifying which micro-communities will influence broader markets versus which will remain permanently niche is real. Most micro-communities won’t drive macro trends. But the ones that do provide invaluable early signals that traditional market analysis misses entirely.

Companies struggle to monitor these communities for understandable reasons. Resource constraints make it impossible to track every niche group. The specialized knowledge required to understand different community contexts is hard to develop internally. Scaling this kind of monitoring without losing the nuance that makes it valuable is genuinely difficult.
Think about micro-community monitoring as part of a broader intelligence system rather than trying to track every possible niche group. You’re looking for patterns across multiple small communities rather than comprehensive coverage of all of them. When you start noticing similar language, values, or preferences emerging in separate micro-communities that don’t directly interact, that’s a signal worth investigating.
Silence and Absence Are Data Points We Ignore
What stops happening contains as much market intelligence as what starts happening.
Our analysis systems are poorly designed to capture absence and decline. Traditional analytics dashboards highlight growth, spikes, and increases while treating decline as less urgent or interesting. Red numbers get attention when they cross certain thresholds, but the slow erosion that happens before the threshold rarely triggers investigation.
The quiet exit of customers, the gradual decline in organic brand mentions, the slow erosion of category interest, and the absence of expected behaviors often predict major market shifts more accurately than dramatic changes. Companies typically notice absence only after it reaches crisis levels, when the cumulative effect finally impacts revenue or other primary metrics.
Psychological factors make us discount negative signals. Optimism bias leads us to explain away early decline as temporary fluctuation. The sunk cost fallacy makes us reluctant to acknowledge that strategies we’ve invested in might be failing. Organizations tend to shoot the messenger, so people who raise concerns about subtle negative signals often face more scrutiny than people who report positive metrics.
What does absence look like in market analysis? Customers who stop engaging before they churn. Product categories that lose cultural relevance before losing sales. Brand mentions that decline in quality and enthusiasm before declining in volume. The shift from active advocacy to passive acceptance. The gradual disappearance of organic conversation about your brand or category.
Building systems to flag these negative signals requires different thinking than building systems to highlight
Building systems to flag these negative signals requires different thinking than building systems to highlight positive signals. You need to establish baseline expectations for what should be happening, then monitor for when those expected behaviors fail to materialize. That’s harder than tracking what is happening.
A consumer electronics brand we worked with had strong social media engagement metrics. Consistent likes, shares, and comments on product announcements. What they didn’t notice was the shifting tone in those comments.
Six months earlier, customers posted unsolicited photos of products in use, tagged their friends, wrote paragraphs about why they loved it. Now? “Looks cool.” “Nice design.” Generic stuff.
Their sentiment analysis tool still scored these as positive. Nobody noticed the enthusiasm had died.
Eight months later, when a competitor launched, that same audience went absolutely nuts for them. The absence of genuine advocacy was the signal. But because the volume stayed stable, nobody was watching for what went silent.
The challenge of distinguishing meaningful absence from normal variation requires both systematic tracking and human interpretation. Not every decline signals a problem. Markets naturally fluctuate. But when multiple absence signals cluster together, when the pattern persists across different measurement periods, when the absence appears across different customer segments simultaneously, that’s when you need to investigate.
Context Collapse Makes Survey Data Nearly Worthless
Traditional survey methodology assumes people have stable, accessible opinions that they’ll honestly report when asked.
That assumption has become increasingly invalid.
People provide performative answers, socially desirable responses, or aspirational statements that bear little relationship to their actual behavior. Context collapse describes the phenomenon where people aren’t sure which version of themselves they should present when answering questions. Am I responding as the person I am, the person I want to be, or the person I think the researcher wants to hear from? The result is responses that reflect who people think they should be rather than who they are.
This problem has worsened as consumers have become more sophisticated about data collection, more aware of corporate research, and more conscious of how their responses might be used. People know their answers might influence product development, marketing messages, or pricing strategies. That knowledge shapes how they respond.
Specific biases contaminate survey data in systematic ways. Social desirability bias leads people to report behaviors and opinions that make them look good. Virtue signaling produces responses that reflect values people want to project rather than actual priorities. Hypothetical bias causes people to dramatically overestimate their likelihood of taking certain actions, especially actions that require effort, cost money, or involve changing established habits.
Traditional statistical methods can’t correct for these issues because the contamination isn’t random error but systematic distortion. When everyone overstates their commitment to sustainability, your sample size doesn’t help you understand actual sustainability-driven purchase behavior.
The gap between stated intentions and actual behavior has widened especially around socially charged topics. People dramatically overstate how much they care about sustainability, privacy, and ethical consumption when asked directly. Their actual purchase behavior reveals different priorities. Companies conducting thorough market research case studies increasingly prioritize behavioral data over stated preferences.
What does this mean for companies that have built significant research infrastructure around survey methodology? The evolution requires moving toward methods that get closer to actual behavior and genuine sentiment. Observational research, behavioral tracking, analysis of revealed preferences through actual choices, and monitoring of unprompted conversation all provide signals less contaminated by self-presentation concerns.
Maybe I’m being too harsh on surveys. They’re not completely worthless. But they need to be triangulated with what people actually do, not just what they say they’ll do. When survey responses align with observed behavior, you can have more confidence. When they diverge, trust the behavior.
Consumer Sentiment Lives Outside Your Analytics Platform
The Emotional Undertow That Moves Markets
Collective emotional states shape buying behavior and market receptivity in ways that don’t show up in standard sentiment analysis tools. Anxiety, optimism, exhaustion, excitement. These emotional undercurrents build slowly through cultural moments, economic uncertainty, and social shifts, creating market conditions that your historical data can’t predict.
Keyword-based sentiment tracking misses the nuanced emotional context that drives decision-making. A sentiment analysis tool might classify a comment as “positive” because it contains words like “excited” or “great,” while completely missing the sarcasm, exhaustion, or conditional nature of that positivity. The same words carry different emotional weight depending on context, tone, and what’s left unsaid.
Understanding these emotional patterns requires interpretation and synthesis rather than just better algorithms. You need people who can read the room, who notice when collective mood is shifting, who recognize when surface-level positivity masks underlying anxiety.
|
Emotional Undercurrent |
Market Manifestation |
What Standard Analytics Miss |
|---|---|---|
|
Collective anxiety |
Increased demand for control, transparency, and guarantees |
Tools flag “concern” keywords but miss the broader shift toward risk-averse behavior |
|
Cultural exhaustion |
Preference for simplicity, reduced engagement with complex offerings |
Declining engagement gets attributed to creative fatigue rather than emotional capacity |
|
Cautious optimism |
Willingness to try new things within safe boundaries |
Sentiment scores show “positive” without capturing the conditional nature of receptivity |
|
Economic uncertainty |
Simultaneous splurging and extreme frugality in different categories |
Purchase behavior appears contradictory when it’s actually emotionally consistent |
|
Information overload |
Increased reliance on trusted sources, reduced exploration |
Attribution models miss the consolidation of influence into fewer voices |
These emotional shifts? They don’t announce themselves.
They accumulate. Slowly. Then suddenly everyone’s buying behavior looks different and you’re scrambling to figure out what changed.
If you’re only watching the numbers, you miss the buildup. You see the shift after it’s already happened, when it’s too late to position yourself ahead of it.
Private Conversations Are Where Real Opinions Form
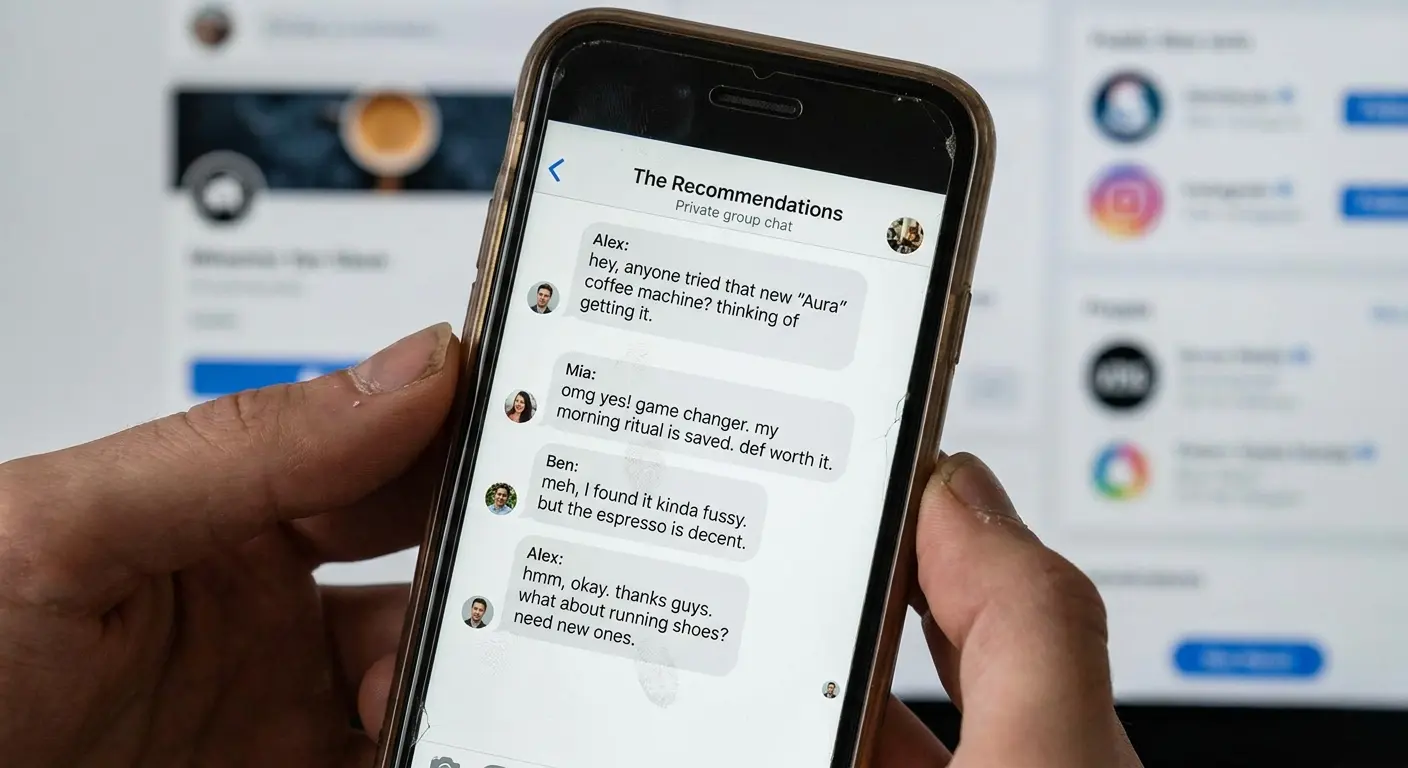
The most honest and influential market opinions are shared in group chats, private messages, and offline conversations that leave no trace in your monitoring tools. Public social media has become performative while private channels have become where people share what they think and feel.
This shift toward private communication makes traditional social listening less valuable. You can monitor every public mention of your brand and still miss the conversations that matter most. When someone asks their group chat “anyone tried [your product]?” and three friends respond with lukewarm reviews, that carries more weight than a hundred positive public testimonials.
You’ll never see that conversation.
The ethical boundaries of trying to access these private conversations are clear. You shouldn’t. But you can recognize that your visible market intelligence represents only a fraction of the actual conversation happening about your brand, category, and competitors. That recognition should make you appropriately humble about how much you know.
What can companies do instead? Focus on creating conditions where people want to share their private opinions with you directly. Build relationships with customers that make them willing to give you honest feedback. Create research methodologies that feel more like conversation than interrogation. Recognize that the most valuable market intelligence often comes from qualitative conversations with small numbers of people rather than large-scale surveys.
Cultural Velocity Changes Faster Than Your Research Cycle
The speed at which cultural moments emerge, peak, and fade has accelerated beyond the pace of traditional market research timelines. By the time you’ve designed a study, collected responses, analyzed data, and presented findings, the cultural context has already shifted.
This velocity mismatch leaves companies constantly operating on outdated cultural intelligence, making decisions based on conditions that no longer exist. A brand might spend three months researching consumer attitudes toward a cultural trend, only to launch a campaign based on those findings into a market that’s already moved on.
Real-time cultural monitoring requires different skills and systems than traditional research departments typically possess. You need people who are deeply embedded in the cultural spaces where your audience lives, who can recognize when a shift is happening rather than waiting for data to confirm it.
This doesn’t mean abandoning research rigor. It means building hybrid approaches that combine systematic monitoring with rapid interpretation. You’re looking for the ability to notice, assess, and act on cultural signals within weeks rather than months.
Market Timing: Pattern Recognition Over Prediction
Weak Signals Compound Into Market Shifts
Major market changes rarely announce themselves with clear signals. They emerge from the accumulation of small, easily dismissed indicators.
Pattern recognition across disparate data sources matters more than deep analysis of any single metric.
Training your attention to notice when weak signals start clustering, reinforcing each other, and building momentum requires both systematic monitoring and human judgment. You can’t automate your way to this kind of insight because the patterns aren’t predefined. You’re looking for signals you didn’t know to look for.
This approach parallels effective market sizing for business opportunities, where multiple signal types inform strategic positioning.
Weak Signal Monitoring Template
I use something like this with clients. Yours will look different, but here’s the basic idea:
Signal Category: [e.g., Language shift, Behavioral change, Value evolution]
Initial Observation:
-
What did you notice?
-
Where did you notice it?
-
Date first observed:
Reinforcing Signals:
-
Signal #1: [Description, source, date]
-
Signal #2: [Description, source, date]
-
Signal #3: [Description, source, date] (Skip this if you’re B2B and the pattern is obvious after two)
Pattern Assessment:
-
Are signals appearing across different sources/contexts?
-
Is frequency increasing?
-
Are adjacent markets showing similar patterns?
Potential Implications:
-
If this pattern continues, what changes?
-
What would early positioning look like?
-
What’s the cost of being wrong vs. being late?
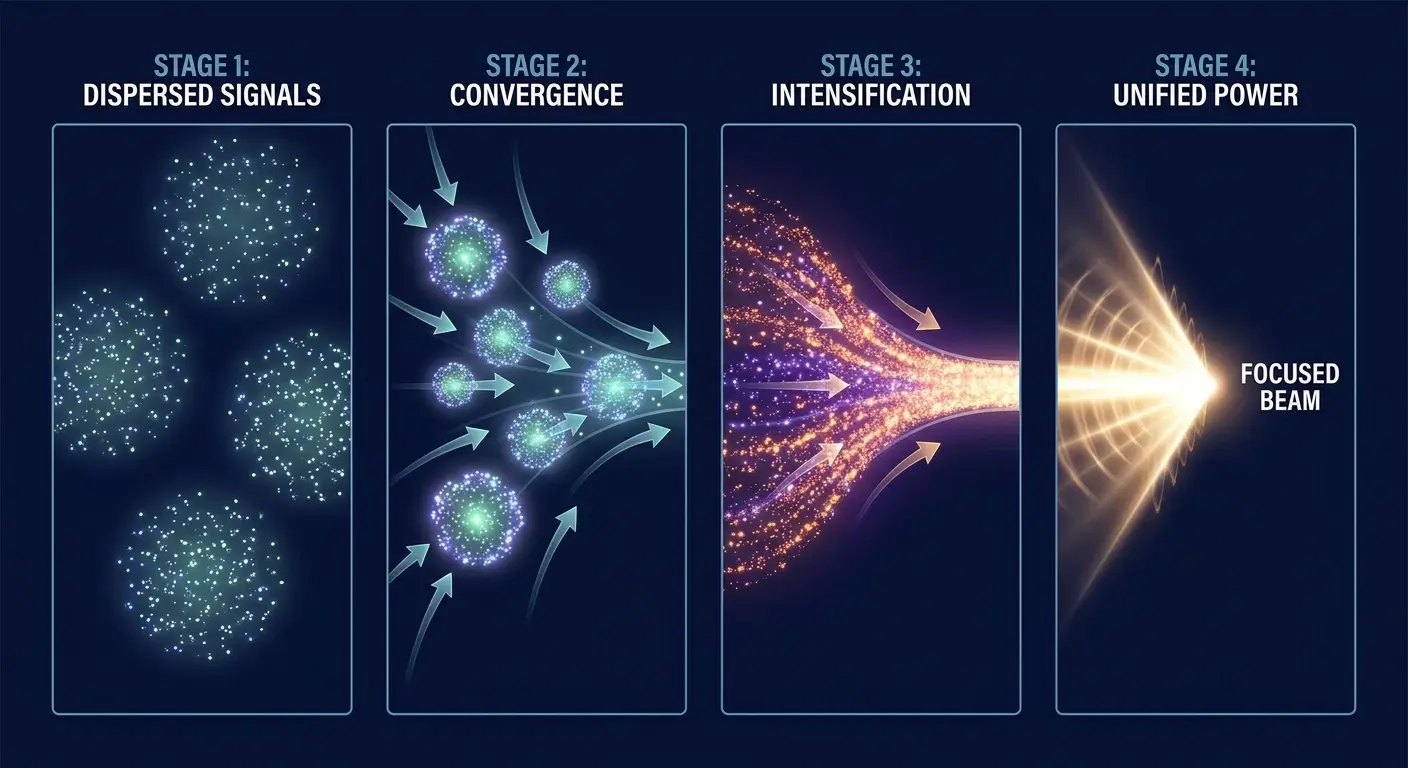
Weak signals become meaningful when they reinforce each other. A single data point is interesting. Three data points from different sources pointing in the same direction is a pattern worth investigating. Five data points from unrelated contexts suggesting the same shift is something you need to act on.
Historical Patterns Are Useful Until They’re Not
Businesses use past patterns as templates for future strategy, even when underlying market conditions have shifted completely.
Historical data provides comfort and justification for decisions. “This strategy worked before, so we’ll do it again” feels safer than “the market has changed, so we need to try something new.”
The dangerous reliance on historical patterns intensifies during periods of structural change. When the conditions that created past patterns no longer exist, historical analysis leads companies astray. But recognizing when you’re in a period of structural change is difficult because it requires acknowledging that your accumulated experience might not apply anymore.
Specific scenarios where historical analysis misleads: when consumer behavior shifts due to generational change, when technology enables new solutions that make old trade-offs irrelevant, when economic conditions create different priorities, when cultural values evolve beyond what past research captured, when competitive dynamics change the game entirely.
How do you recognize when old patterns no longer apply? Watch for situations where historical data keeps predicting outcomes that don’t materialize. Pay attention when your market analysis suggests one thing but market response suggests another. Notice when explanations for market behavior require increasingly convoluted reasoning to reconcile with historical patterns.
The organizational challenge of convincing stakeholders to act on emerging patterns that contradict historical precedent is real. People with long tenure in an industry have seen many “this time is different” predictions fail. Healthy skepticism toward claims of change is warranted.
But that skepticism can become paralysis when the change is real.
Market Windows Open and Close on Their Own Timeline
Market opportunities have their own rhythm and lifespan, independent of your product development cycle or strategic planning calendar. Companies miss opportunities not because they didn’t see them but because they couldn’t move fast enough or weren’t positioned to act when the window opened.
Building organizational capacity to respond to market timing rather than trying to force market timing to match your internal processes requires changes in how companies operate. You need decision-making structures that can move quickly, development processes that can deliver iteratively, and leadership willing to act on incomplete information.
The tension between thorough analysis and speed of execution is healthy rather than something to eliminate. Thorough analysis reduces risk but increases time to market. Speed of execution captures opportunities but increases risk of mistakes. The right balance depends on the specific opportunity and your competitive position.
A financial services company we worked with spent 18 months developing a budgeting app feature based on extensive market research showing consumer demand for better money management tools. By the time they launched, three nimble competitors had already captured the early adopters with simpler versions of the same concept.
The market window for “first mover advantage” had closed.
The company’s research was solid, their execution was competent, but their internal timeline didn’t match the market’s rhythm. They ended up launching into a crowded space where they needed to compete on differentiation rather than novelty. The opportunity didn’t disappear, but it changed character completely while they were building.
Their analysis told them what to build but couldn’t account for how quickly the competitive situation would shift during their development cycle.

Market windows don’t wait for you to be ready. They open based on confluence of factors: technology maturation, cultural readiness, competitive dynamics, economic conditions. Your job is to recognize when a window is opening and position yourself to move through it, even if that means acting before you feel completely prepared.
The Gap Between What People Say and What Data Shows
Behavioral Data Tells You What, Not Why
Digital analytics excels at showing you what people do but provides almost no insight into their motivations, context, or decision-making process.
You can see that someone abandoned their cart, but you don’t know if it was because of price, shipping costs, second thoughts about need, distraction, comparison shopping, or a dozen other reasons.
This limitation matters more than most companies acknowledge, especially when trying to predict how behavior will change under different conditions. If you don’t understand why people behave the way they do, you can’t reliably predict how they’ll respond to changes in your offering, pricing, positioning, or market conditions.
Businesses make strategic errors by inferring causation from behavioral patterns without understanding the underlying drivers. You see that a specific feature correlates with higher retention, so you invest heavily in promoting that feature. But correlation isn’t causation. Maybe people who stay longer use that feature more because they’re already committed, not the other way around. Understanding the difference requires going beyond what the data shows to why the pattern exists.
You need qualitative intelligence to interpret quantitative data, not just more data points. Interviews, observations, and conversations that explore motivation and context make your behavioral data meaningful. Without that qualitative layer, you’re pattern-matching without understanding.
People Are Terrible at Predicting Their Own Behavior
The well-documented gap between what people say they’ll do and what they do when faced with
The well-documented gap between what people say they’ll do and what they do when faced with real decisions exists because of cognitive biases, social pressure, and changed circumstances.
This gap is getting worse as people become more aware of being studied.
Why does this gap exist? People genuinely believe they’ll behave in ways they don’t when the moment arrives. Future selves feel different from current selves, making it easy to commit to behaviors that require effort or sacrifice. Social pressure makes people claim they’ll prioritize values that take a backseat when money or convenience is involved. Changed circumstances between when someone states an intention and when they face the actual decision alter priorities in unpredictable ways.
Companies continue to base strategy on stated intentions despite overwhelming evidence of their unreliability because stated intentions are easier to collect at scale than behavioral data. You can survey thousands of people about what they’ll do. Observing what thousands of people do when faced with real choices is harder and more expensive.

Research methods that get closer to actual behavior include observational studies where you watch what people do rather than asking what they’ll do, revealed preference analysis where you infer priorities from actual choices, behavioral experiments where you test responses to real scenarios rather than hypothetical ones, and longitudinal tracking where you follow the same people over time to see if stated intentions materialize into action.
These methods are harder and more expensive to execute, which explains why companies still rely heavily on surveys. But the cost of making strategic decisions based on unreliable data often exceeds the cost of better research methods.
The Interpretation Layer Is Where Value Gets Created or Destroyed
The same data set can lead to completely different strategic conclusions depending on who’s interpreting it and what framework they’re using.
Two analysts looking at identical market analysis data might reach opposite conclusions about whether to expand into a new segment, depending on what they consider important and what they discount.
Interpretation skill matters more than data volume. You can have terabytes of data and still make terrible decisions if your interpretation is flawed. You can have limited data and make excellent decisions if your interpretation is insightful.
Why do interpretations vary so dramatically? Cognitive biases shape what we notice and how we weight different signals. Confirmation bias leads us to emphasize data that supports our existing beliefs while discounting contradictory information. Organizational politics influence which interpretations are safe to present and which are career-limiting. Incentive structures reward interpretations that justify preferred strategies rather than interpretations that challenge them.
Building interpretation processes that challenge assumptions rather than confirm them is uncomfortable but necessary. That means creating environments where people can present interpretations that contradict leadership preferences without career risk. It means actively seeking alternative explanations for the patterns you see in data. It means stress-testing your interpretations by asking what evidence would make you change your mind.
The discomfort is the point. If your interpretation process feels comfortable and validating, you’re probably just confirming what you already believed.
Building Intelligence Systems That Capture Nuance
Hybrid Models That Combine Rigor and Intuition
Market analysis systems designed to capture both quantitative and qualitative signals require structural thinking about how different types of intelligence interact and inform each other.
You’re building a system where analytics, observation, conversation, and cultural monitoring feed into a coherent picture rather than existing as separate silos.
Structuring intelligence gathering that respects the value of data while acknowledging its limitations means creating processes where quantitative findings prompt qualitative investigation and qualitative insights drive quantitative validation. The two approaches inform each other rather than competing.
Organizations implementing continuously learning systems with AI can better integrate quantitative rigor with qualitative interpretation.
Specific practices for integration: regular synthesis sessions where people from different disciplines (analytics, research, customer-facing roles, cultural monitoring) share what they’re seeing and look for patterns across their domains. Documentation systems that capture both hard data and contextual observations in ways that make them equally accessible. Decision-making frameworks that require both quantitative evidence and qualitative assessment before major strategic moves.

Building these systems without creating information overload or analysis paralysis requires curation as much as collection. You’re not trying to capture everything. You’re trying to capture the right things and connect them meaningfully. That requires editorial judgment about what matters and what’s just noise.
Training Your Team to See What Isn’t Obvious
The human capability required to do market analysis that goes beyond dashboard monitoring involves skills and mindsets that enable people to recognize patterns, connect disparate signals, and generate insight from ambiguous information.
These capabilities are different from traditional analytical skills.
Traditional analytical skills focus on working with structured data, applying statistical methods, and generating reports that summarize findings. The skills needed for nuanced market analysis involve comfort with ambiguity, ability to synthesize across different types of information, pattern recognition that operates on incomplete data, and willingness to form hypotheses before you have definitive proof.
Why are these capabilities harder to hire for or develop? They’re less teachable through standard training programs. They develop through experience, exposure to diverse information sources, and cultivation of curiosity. People with these skills often don’t have traditional analytical backgrounds, making them harder to identify through conventional hiring processes.
Creating organizational conditions where this kind of thinking is valued and rewarded rather than dismissed as subjective or unscientific requires leadership that models comfort with uncertainty. When executives demand certainty before acting, teams learn to present only findings they can prove definitively. When leadership acts on well-reasoned interpretations of ambiguous signals, teams learn that thoughtful analysis of incomplete information is valuable.
Competitive analysis and market analysis both benefit from teams trained to notice what standard tools miss and interpret signals that don’t fit existing frameworks.
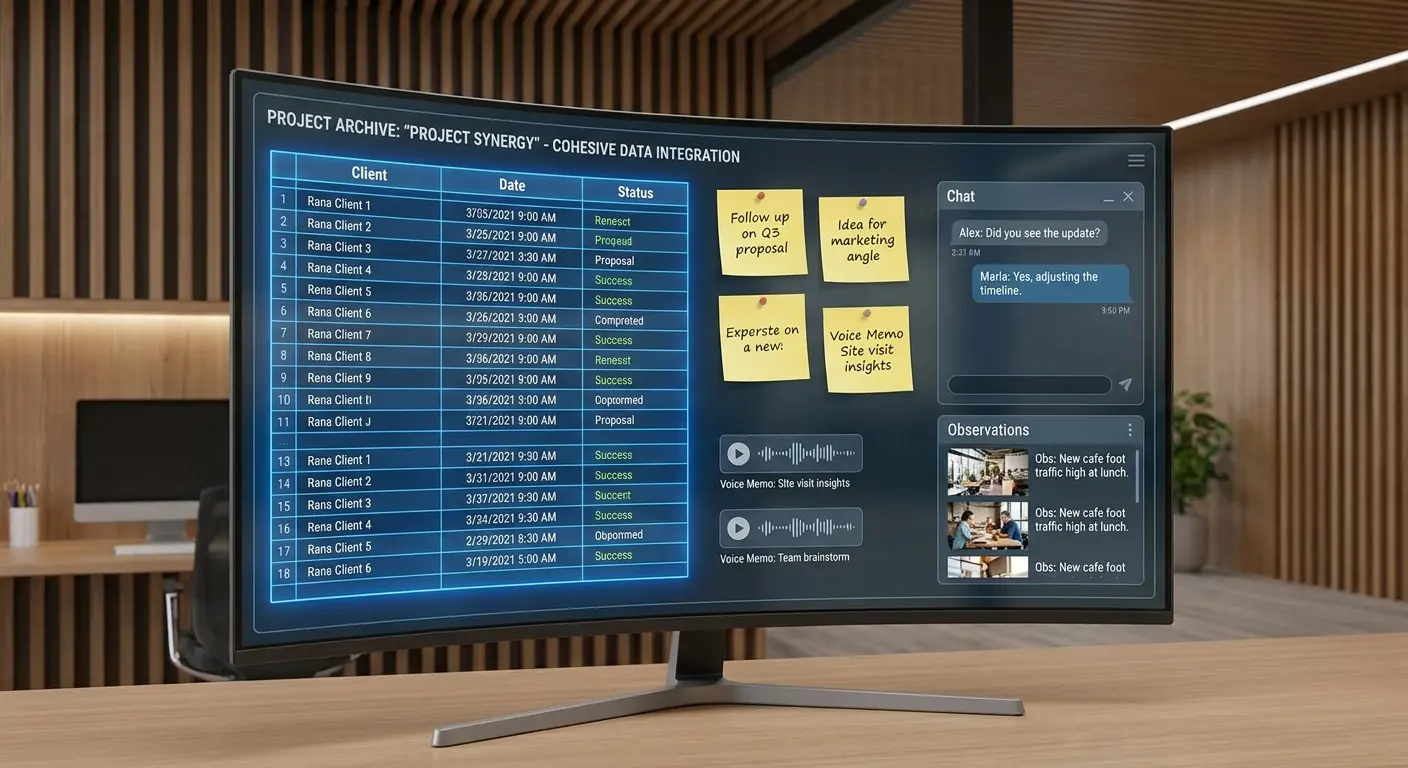
Documentation Systems for Unstructured Intelligence
Capturing and organizing market intelligence that doesn’t fit into traditional data structures requires different approaches than what most companies use for quantitative data.
Companies are good at storing numbers in databases. They’re terrible at preserving qualitative insights, observations, and contextual understanding in ways that remain accessible over time.
Why does this matter? When someone leaves your organization, their accumulated market understanding leaves with them. When teams change, the context behind past decisions gets lost. When new people join, they can access historical data but not the qualitative intelligence that made that data meaningful.
Practical approaches for documenting unstructured intelligence include creating searchable repositories where observations, conversation summaries, and pattern notes get tagged and organized by theme rather than just date. Building narrative summaries that capture not just what was decided but why, including the signals and interpretations that informed decisions. Maintaining ongoing logs where team members document interesting patterns, anomalies, or observations that don’t yet constitute actionable insights but might become important later.
The challenge is making this documentation valuable without making it burdensome. If the process requires extensive time and formal write-ups, people won’t do it consistently. The system needs to be lightweight enough that capturing observations feels worthwhile rather than like extra work.
Building institutional memory around market understanding that survives personnel changes and organizational restructuring means treating qualitative intelligence as a strategic asset worth preserving. That requires investment in systems, processes, and culture that value documentation even when the immediate payoff isn’t obvious.
Market analysis reports that integrate both quantitative findings and qualitative context provide more strategic value than reports that present data without interpretation or narrative.
Where The Marketing Agency Fits Into This Shift
This is where I’m supposed to tell you we can help.
And we can. But let’s be honest about what this actually takes.
Building this kind of market intelligence internally? You need different skills than your current analytics team has. You need new systems. You need to convince stakeholders that qualitative signals matter as much as quantitative metrics. You need someone senior enough to have credibility but junior enough to still be monitoring Discord servers.
Most companies don’t have the bandwidth to build this while running their actual business.
We’ve spent three years building the infrastructure for exactly this problem. We combine traditional analytics with cultural monitoring, qualitative research, and pattern recognition across the unstructured data sources your dashboards ignore.
We work with companies who know their current approach has blind spots but aren’t sure how to fix them without starting from scratch.
Our approach draws on proven methodologies from market sizing case studies to deliver actionable strategic intelligence.
If that’s you, schedule a consultation to explore what hybrid market intelligence could look like for your business.
No pitch deck. Just a conversation about what signals you’re not seeing and whether we’re the right fit to help you see them.
Final Thoughts
Look, I get it. What I’m describing sounds like a lot of work.
You’ve already got dashboards. You’ve already got analytics teams. You’ve already got research processes. And I’m saying you need to add qualitative monitoring, cultural intelligence, micro-community tracking, and pattern recognition across unstructured data?
Yeah. That’s what I’m saying.
Because your competitors are missing the same signals you are. Right now. Today. And that window where everyone’s equally blind doesn’t stay open forever.
The companies that figure out how to see beyond their metrics won’t just have better market analysis. They’ll see opportunities six months before anyone else. They’ll spot threats while there’s still time to pivot. They’ll stop getting blindsided by market shifts that were obvious to everyone except the people watching dashboards.
Consumer behavior has fragmented beyond what our tracking systems can capture. The gap between what people say and what they do continues to widen. Cultural velocity has accelerated past our research cycles. The signals that matter most often can’t be quantified.
This doesn’t mean abandoning data. You still need data. Obviously. But you also need to capture the stuff that doesn’t fit in spreadsheets.
We’re still early in this transition. Most of your competitors are still optimizing the same metrics, trusting the same dashboards, and missing the same signals you are.
You can wait until the market forces you to evolve your approach. Most companies will.
Or you can start now while there’s still an advantage to being early.