Last quarter, your team ran 47 surveys. The dashboard shows 23,000 responses. Your analytics platform tracked 4.2 million clicks. And you still can’t figure out why the Q3 campaign tanked.
Here’s what keeps happening: brands collect mountains of data while completely missing the human context that makes any of it meaningful. Three companies I worked with last year spent $2M combined on research tools. All three still missed their product launches. The problem wasn’t the volume of data or the sophistication of their tools. It’s that most market research methods treat people like data points instead of the messy, contradictory, emotionally driven beings they actually are.
This guide explores the methods that account for what numbers alone can’t tell you.
Why Research Methods Keep Missing the Emotional Layer
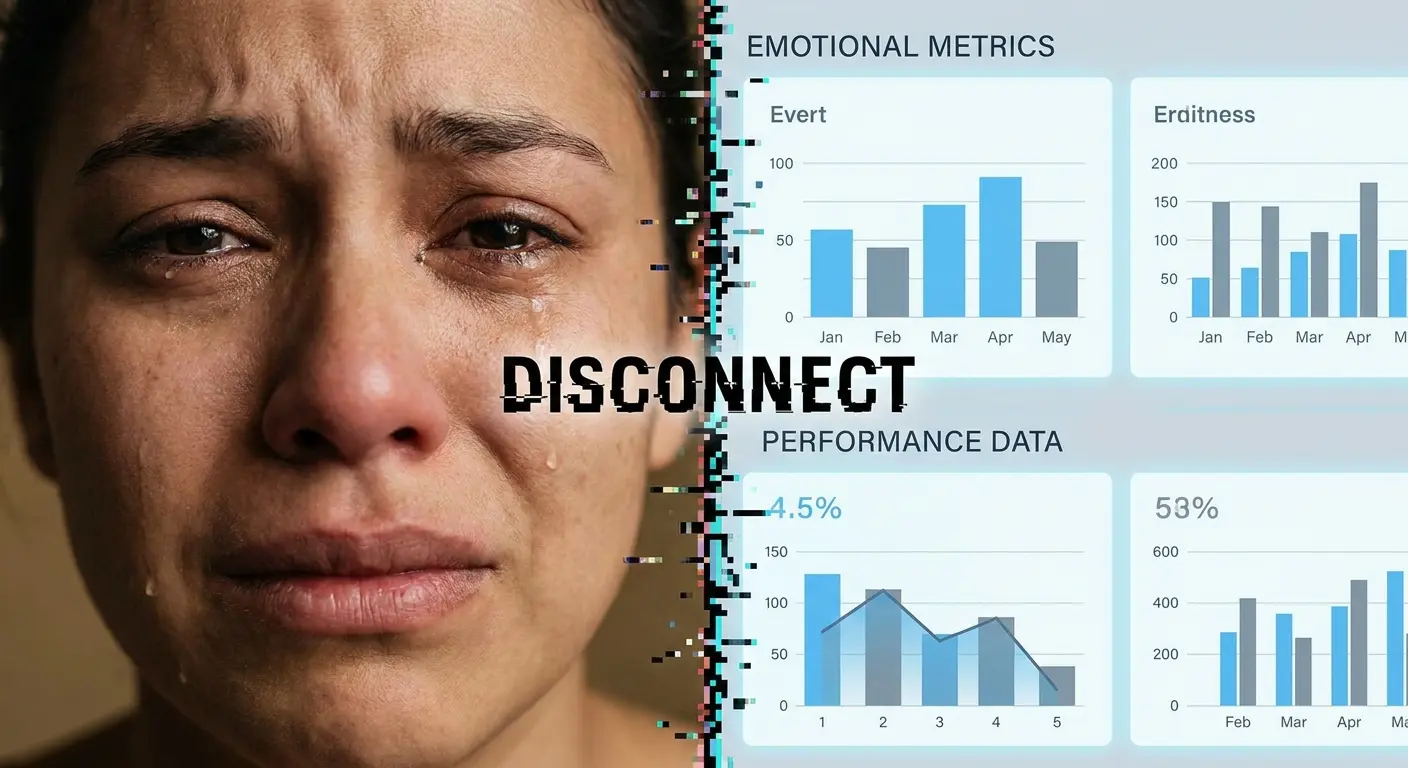
Conventional research approaches fail to capture the emotional and psychological factors that drive consumer decisions. I keep seeing this disconnect play out between what people report in surveys versus their real-world behavior. Most market research methods are optimized for quantifiable data while systematically excluding the harder-to-measure human elements that determine whether someone buys, engages, or advocates.
The Rationalization Problem in Self-Reported Data
People lie. Not on purpose, they genuinely believe what they’re telling you. But they’re wrong.
Ask someone why they chose one brand over another, and they’ll construct this perfectly logical explanation. “The sustainability practices.” “The price point.” “The features.” Meanwhile, the real reason was that the packaging felt expensive when they picked it up, or their friend mentioned it last week, or they were in a good mood that day.
They’re not lying to you. They’re lying to themselves. And you’re building your entire strategy on that lie.
Self-reported data captures the story people tell themselves, not the truth of what happened. Your surveys and interviews are documenting post-hoc rationalization, which means you’re building strategies on a foundation of well-intentioned fiction. The gap between reported and actual behavior isn’t noise in your data. It’s a completely different dataset that most market research methods aren’t designed to capture.
One of those Peloton-style fitness apps (but for runners) couldn’t figure out why people kept canceling. So they did what everyone does, sent exit surveys asking users why they canceled their subscriptions. The answers were clean: “too expensive,” “didn’t have time,” “achieved my fitness goals.” Makes sense, right?
Except when they pulled the actual usage data from the two weeks before cancellation, it told a completely different story. Most users had stopped logging workouts three weeks before canceling, hadn’t opened the app in the final week, and showed declining engagement for over a month. The slow fade of someone who lost motivation but didn’t want to admit it.
The real pattern pointed to gradual disengagement and loss of motivation, not the rational cost-benefit analysis users reported. When the company shifted from asking why people left to observing the behavioral signals that preceded departure, they redesigned their retention strategy around re-engagement triggers rather than pricing adjustments. (Which, by the way, they’d been about to implement based on the survey data.)
Emotional Triggers That Quantitative Methods Miss
Standard quantitative research excels at measuring frequency, preference rankings, and demographic patterns. What it can’t measure is the flash of anxiety someone feels when considering a purchase, or the subtle disappointment that makes them abandon a cart, or the unexpected delight that turns them into an evangelist. These emotional micro-experiences determine outcomes, but they don’t fit neatly into survey responses or clickstream data.
You can track that someone spent three minutes on a product page before leaving. Congratulations. You still can’t see that they were wrestling with whether buying this item meant admitting something about themselves they weren’t ready to acknowledge. That internal conflict won’t show up in your heatmaps or session recordings, but it’s the actual reason they didn’t convert.
This is where competitive analysis falls short too. You can map out what competitors are doing, track their pricing and positioning, but you miss the emotional resonance they’ve created with their audience. The numbers tell you they’re winning market share. They don’t tell you it’s because their messaging taps into an aspiration your research never uncovered.

Building Emotional Context Into Research Design
Capturing emotional layers requires methods that observe behavior in context rather than extracting people from their environment to study them. Diary studies where participants record their thoughts and feelings in the moment. Observational research that notes facial expressions, body language, and environmental factors during decision-making. Follow-up interviews that probe not just what someone did but how they felt throughout the process.
I’m not suggesting you abandon quantitative methods or structured research. You need parallel research streams that specifically target the emotional and psychological dimensions. Your quantitative data tells you what’s happening (the what). Your emotional research tells you why it matters to the human experiencing it (the why that actually drives decisions). Both are required for complete insight.
Traditional surveys tell you what people say they prefer and how satisfied they claim to be. Great. What they don’t tell you is why someone abandoned their cart at 2am, or what emotional trigger made them finally click buy after three weeks of browsing, or why they’re quietly looking at competitors even though they rated you 9/10 on satisfaction.
Focus groups show you how people talk about your product when they know they’re being watched. Which is not at all how they talk about it at home. A/B testing shows you which button color gets more clicks. It doesn’t show you that people clicked because they were confused and trying to find the exit.
Passive analytics capture what people do, where they go, how long they stay. They miss why people made those choices, the emotional context, the offline influences that shaped the decision before they ever landed on your site.
Ethnographic research gives you environmental context, authentic behavior, emotional nuance. But it doesn’t scale well, can’t give you statistical significance, and struggles with generalizability beyond the specific segments you study.
Emotional Layer Research Design Checklist:
-
Identify the decision points where emotional factors most likely override rational evaluation
-
Select observation methods that capture behavior in natural environments rather than lab settings
-
Build in immediate-capture mechanisms (diary studies, in-moment surveys) to document feelings before rationalization occurs
-
Include follow-up depth interviews that probe emotional responses, not just reported reasons
-
Create coding systems that categorize emotional states and triggers, not just behavioral outcomes
-
Train researchers to recognize and document non-verbal cues (facial expressions, body language, hesitation patterns)
-
Design consent processes that allow observation without creating performance anxiety
-
Establish analysis protocols that treat emotional data as primary insight, not supplementary color commentary
The Longitudinal Observation Gap Nobody’s Filling
People change their minds. Constantly.
The person who told you in January that convenience was everything? By June, they care about quality. By October, they’re price-sensitive because their hours got cut. You surveyed them once, built a strategy around those answers, and now you’re confused why nothing’s working.
Your research treated their preferences like they were permanent. They weren’t.
Why Single-Point Research Creates Misleading Certainty
You survey customers in January and build a strategy around those findings. By June, the preferences you documented have shifted, but you’re still executing against outdated insights. Someone’s priorities during a pandemic look nothing like their priorities during economic expansion, yet most research acts as if context doesn’t reshape preferences.
The false precision of point-in-time data is dangerous because it feels authoritative. You have numbers, statistical significance, clear findings. What you don’t have is any indication of whether those findings will still be relevant when your campaign launches three months from now. The confidence interval in your research accounts for sampling error but not for the fact that people fundamentally change their minds. (Which they do. All the time.)
Tracking Preference Evolution Across Contexts
Longitudinal research methods follow the same individuals across time, documenting how their behaviors and preferences shift as their circumstances change. You’re not asking different people the same question at different times. You’re watching how specific people evolve, which reveals patterns that cross-sectional research can’t see.
Someone who rates convenience as their top priority might shift to prioritizing quality after a negative experience (we’ve all been there with a meal delivery service), then shift again to prioritizing price during a personal financial crunch.
These shifts aren’t random noise. Well, some are, but most aren’t. They’re predictable responses to life changes, market conditions, and accumulated experiences with your category. Longitudinal methods let you map these transitions and understand the triggers that move people from one state to another. That knowledge transforms how you time campaigns, sequence messaging, and allocate resources across different customer segments.
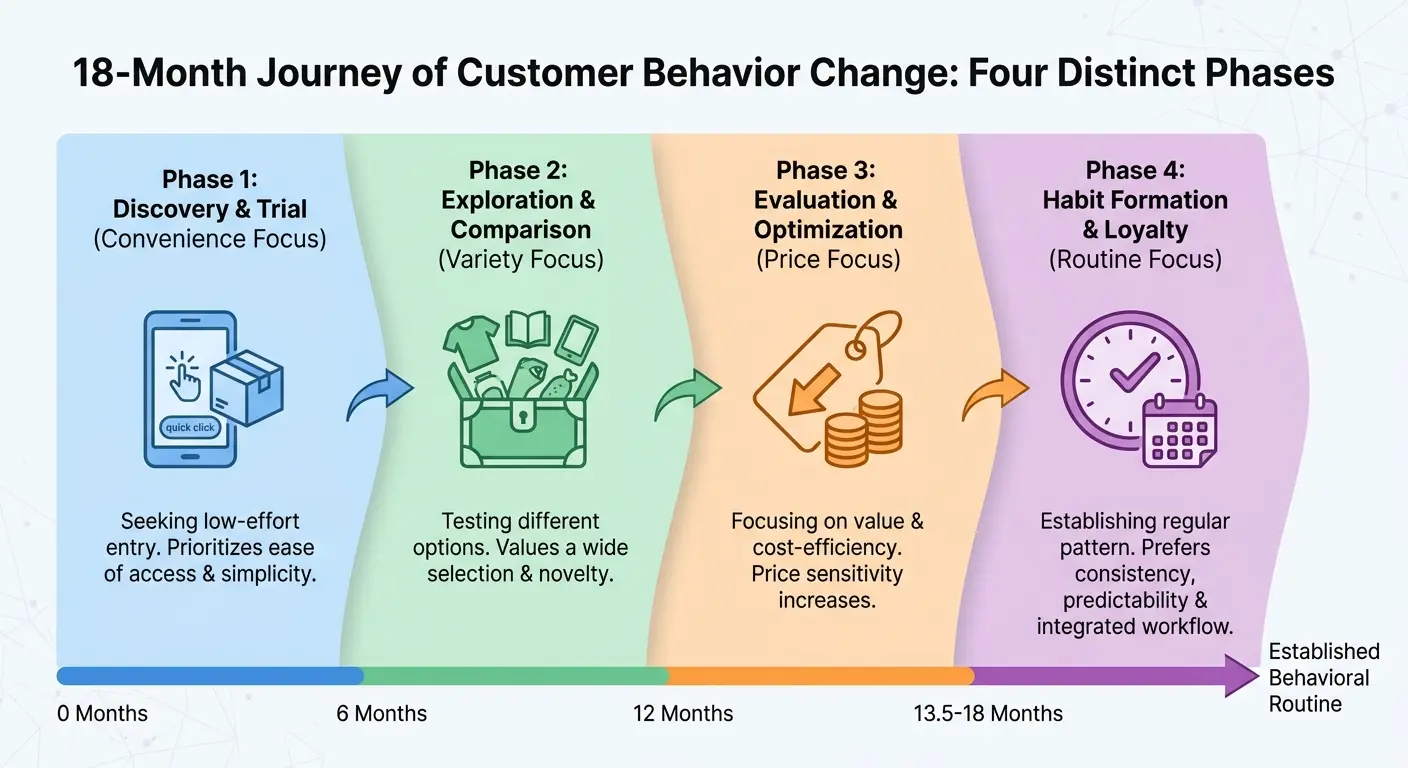
A subscription meal kit service (one of those that sends you pre-portioned ingredients in an ice pack-lined box that barely fits in your fridge) tracked the same 200 customers over 18 months, conducting brief check-ins every six weeks. They discovered that customer priorities followed a predictable cycle that had nothing to do with the product itself.
New subscribers started with convenience as their primary value driver. After 8-12 weeks, variety became the dominant concern. Around month six, price sensitivity spiked as the novelty wore off and customers started comparing costs to grocery shopping. By month nine, those who remained had shifted to valuing the routine and decision-elimination the service provided.
The company had been treating all customers the same, but the longitudinal data revealed they needed four different retention strategies timed to these predictable transitions. Customers who received variety-focused messaging at week 10 and price-justification content at month six showed 34% higher retention than the control group receiving generic communications.
Practical Models for Long-Term Observation
The barrier to longitudinal research isn’t methodology but commitment. It requires maintaining relationships with research participants over extended periods, which means higher costs and more complex logistics. Panel studies where you recruit participants who agree to regular check-ins over six months or a year. Cohort tracking where you follow groups who share a defining characteristic (first-time buyers in Q1, for instance) and document their journey.
Digital tools have made longitudinal research more feasible. Apps that prompt periodic surveys, online communities where members share ongoing experiences, passive tracking (with consent) that monitors behavior without requiring active participation. You’re designing systems that respect participants’ time while capturing enough data points to identify meaningful patterns rather than random fluctuations.
When you’re conducting competitive analysis, longitudinal data becomes even more valuable. You can see how competitor moves influence customer behavior over time, not just capture a snapshot of market share. You understand whether a competitor’s pricing change caused permanent migration or temporary experimentation that customers reversed.
Passive Data Collection That Respects Context
Want to know what people actually do? Stop asking them.
The second you put someone in a focus group or send them a survey, they start performing. They give you the answers they think they should give, or the answers that make them look good, or the answers they genuinely believe are true but aren’t.
Watch what they do when they think nobody’s looking. That’s your real data.
The Observer Effect in Traditional Research
The moment you ask someone to participate in research, you change their behavior. They become more thoughtful, more deliberate, more conscious of being watched. Focus group participants perform for each other. Survey respondents try to give “good” answers. Even A/B tests can trigger reactance when people sense they’re being experimented on.
The observer effect isn’t a minor methodological concern. It fundamentally alters the behavior you’re trying to understand.
Passive research methods minimize this distortion by collecting data about behavior that would happen anyway. You’re not inserting yourself into someone’s experience and asking them to narrate it. You’re watching what they do when they think no one’s paying attention, which is when behavior is most authentic. The challenge is doing this ethically and in ways that capture meaningful context rather than just raw behavioral data.

Environmental and Situational Data Layers
Behavior doesn’t happen in a vacuum. Someone makes different decisions when they’re rushed versus relaxed, when they’re alone versus with family, when they’re in a good mood versus stressed. Passive research methods that ignore these contextual factors are just collecting decontextualized actions. You need to capture the environmental and situational variables that shape behavior in the moment.
Location data (with explicit consent) that shows whether someone is shopping from home or in-store. Time stamps that reveal whether decisions happen during lunch breaks or late at night. Device data that indicates whether they’re on a phone while commuting or on a laptop at a desk. Weather data, local events, economic indicators. All of these contextual layers help explain why the same person makes different choices at different times.
Time of day reveals decision-making patterns, urgency levels, available attention. You can collect this through automated timestamps on transactions and interactions. Low privacy risk, generally non-identifying.
Location type shows environmental influence, social context, accessibility constraints. GPS data (with consent) or IP geolocation work here. High privacy risk, requires explicit opt-in.
Device type indicates engagement depth, multitasking likelihood, screen constraints. User agent strings and device IDs capture this. Medium risk, can be pseudonymized.
Weather conditions influence mood, activity limitations, seasonal patterns. Third-party weather APIs matched to location provide this data. Low risk, aggregated.
Social context (alone versus group decisions, peer influence, performance behavior) comes from self-reporting or inferred device sharing patterns. Medium risk, requires transparency.
Recent life events drive priority shifts, financial changes, emotional states. Voluntary participant reporting or public records (births, moves) reveal these. High risk, requires careful consent.
This is where market research technique evolution matters most. The tools we have now allow for contextual capture that was impossible a decade ago. But having the capability doesn’t mean we should collect everything we can access.
Ethical Frameworks for Observation-Based Research
Passive data collection walks a thin line between insight and invasion. The technical capability to track behavior doesn’t create the ethical right to do so. You need explicit consent, transparent communication about what you’re collecting and why, and genuine value exchange where participants benefit from their participation.
Opt-in models where people choose to share data because they get something meaningful in return, not because you buried permission in page 47 of your terms of service.
I’ve seen too many brands treat passive data collection as permission to hoover up everything they can access. That approach destroys trust and ultimately undermines the quality of your research. People change their behavior when they feel surveilled, which means your “authentic” behavioral data becomes just as distorted as traditional research methods. Ethical passive research requires restraint and respect for the humans you’re studying.
Micro-Moment Research Beyond Mobile Analytics
Someone sees a post, clicks through, buys. All in 90 seconds. Then you ask them a week later why they bought it, and they give you this whole rational explanation about features and
value.
Bullshit. They bought it because they were bored on the subway and the product image looked cool.
By the time you survey them, they’ve already rewritten the story in their head. You’re not studying the decision anymore. You’re studying the story they tell themselves about the decision.
The Decision Compression Problem
Someone sees a social media post, clicks through, evaluates, and purchases within a two-minute window. Traditional research methods that rely on recall (tell me about your last purchase) or deliberation (consider these options and rank them) can’t capture these compressed decision cycles. By the time you ask someone why they bought something in a micro-moment, they’ve already constructed a rationalization that bears little resemblance to the actual impulse.
Micro-moment research requires capturing data during or immediately after the decision, before memory and rationalization have time to reshape the experience. In-app prompts that trigger right after a purchase. SMS surveys that arrive within minutes of a store visit. Wearable devices that track physiological responses during shopping. Document the decision while the person is still in the mental state that produced it.
This method of market research demands speed and precision. You’re working within a window measured in minutes, not hours or days. Miss that window and you’re back to studying post-hoc rationalization instead of authentic decision-making.
Impulse Versus Intention in Purchase Behavior
Not all micro-moments are created equal. Some represent genuine impulse purchases driven by emotion, opportunity, or sudden need. Others are the final moment of a much longer consideration process that just happens to culminate in a quick transaction. Your research methods need to distinguish between these types because they require completely different strategic responses.
Impulse micro-moments respond to triggers like scarcity, social proof, or emotional resonance. Intention-culmination micro-moments respond to factors like price thresholds, feature comparisons, or risk reduction. If you treat all quick purchases as impulses, you’ll miss the extended consideration journey that preceded them. If you treat all quick purchases as planned, you’ll miss the spontaneous opportunities that drive incremental revenue.
A home goods retailer installed beacon technology in their stores that detected when shoppers lingered in specific departments for more than 90 seconds. Within two minutes of leaving that area, participants (who had opted into the research program) received a one-question mobile survey: “What were you just considering?”
The responses revealed two distinct patterns. In the kitchen section, 73% of lingering moments were impulse reactions to visual displays or sale signage, with purchases happening within five minutes or not at all. In the furniture section, 68% of lingering moments were part of multi-week consideration processes, with customers physically measuring spaces, taking photos, and comparing options across multiple visits.
The retailer had been applying the same conversion tactics across all departments. The micro-moment research led them to redesign kitchen displays for immediate emotional appeal while adding furniture consultation services and follow-up systems for the longer consideration cycle.

Capturing Context Without Disrupting the Moment
The methodological challenge in micro-moment research is getting data without destroying the spontaneity you’re trying to study. Interrupt someone mid-decision with a survey and you’ve just converted an impulse into a deliberate choice. Wait too long and you’ve lost the authentic emotional state. The window for data collection is measured in minutes, not hours or days.
Passive signals provide some answers. Cart abandonment timing, scroll speed, click hesitation patterns. But these behavioral proxies only tell you what happened, not why. Post-moment research needs to be fast, frictionless, and incentivized. A single question delivered via push notification. A five-second video response option. Gamified feedback that takes less effort than ignoring it.
You’re asking for a tiny slice of attention immediately after you’ve (hopefully) delivered value.
Competitive analysis in micro-moments reveals interesting patterns too. You can see which competitor messages trigger immediate action versus extended consideration. You understand which moments belong to impulse and which require nurturing. That intelligence shapes everything from ad placement to checkout flow design.
Ethnographic Approaches That Scale (Without Losing Depth)
Ethnographic research is slow as hell. You spend weeks following people around, watching them use products in their actual lives, building enough trust that they stop performing for you.
Most marketing budgets can’t justify it. So you default to surveys and focus groups that give you answers in two weeks, and you pretend those answers mean something.
They don’t. But they’re fast and cheap, so here we are.
Why Brands Avoid Ethnographic Methods
The result is that brands default to faster, cheaper methods that sacrifice depth for speed. You get surface-level insights that confirm what you already suspected rather than the challenging observations that shift strategy. The business case for ethnography fails not because the insights aren’t valuable but because the traditional model doesn’t fit modern research timelines and budgets.
We need hybrid models that maintain the rich contextual understanding of traditional ethnography while using technology and process design to study larger populations. Market research methods that deliver ethnographic-quality insights without requiring years of immersive fieldwork for every research question.
Digital Ethnography at Scale
Technology enables ethnographic observation across larger populations without requiring physical presence. Online communities where participants share photos, videos, and narratives about their daily lives. Mobile ethnography apps that prompt people to document specific behaviors or experiences in the moment. Social media observation (of public posts) that reveals authentic self-expression and peer interaction.
These digital methods don’t replace in-person ethnography but they extend its reach.
The trade-off is that you lose some of the contextual richness that comes from physical presence. You can’t observe body language through a screen. You can’t notice environmental details that participants don’t think to mention. But you gain the ability to study hundreds or thousands of people simultaneously, to track behavior across time zones and geographies, and to identify patterns that would be invisible in small-scale traditional ethnography.

Hybrid Models That Combine Depth and Breadth
The most effective approach combines intensive ethnographic work with a smaller group and scaled digital observation across a larger population. You do deep immersive research with 20-30 participants to develop hypotheses and understand the full contextual picture. Then you use digital ethnographic methods to test whether those patterns hold across a broader population and to identify variations across different segments.
This hybrid model gives you the confidence that comes from scale without losing the nuance that makes ethnographic research valuable. You’re not trying to make every research project equally deep. You’re strategically applying depth where it generates the most insight and using lighter-touch methods to validate and extend those findings.
The small-scale ethnography informs how you design your scaled research, and the scaled research tells you which ethnographic findings are broadly applicable versus segment-specific.
When I conduct competitive analysis through ethnographic lenses, I see things that market share data never reveals. How people actually talk about brands in their homes. Which products sit on counters versus hidden in cabinets. The micro-frustrations that accumulate into brand switching. These insights don’t show up in surveys because people don’t consciously register them.
Hybrid Ethnographic Research Process:
Phase 1: Deep Immersion (Weeks 1-4)
-
Recruit 20-30 participants representing key segments
-
Conduct in-home observations (2-3 hours per participant)
-
Document environmental context, product interactions, and decision-making processes
-
Capture photographs of relevant spaces, products in use, and contextual factors
-
Conduct depth interviews exploring motivations, frustrations, and unmet needs
-
Identify preliminary patterns and generate hypotheses
Phase 2: Hypothesis Development (Week 5)
-
Analyze immersion findings for recurring themes
-
Map behavioral patterns and emotional triggers
-
Develop specific hypotheses to test at scale
-
Design digital ethnography protocols based on immersion insights
Phase 3: Scaled Digital Observation (Weeks 6-12)
-
Recruit 200-500 participants for digital ethnography platform
-
Deploy mobile app prompts for in-moment documentation
-
Collect photos, videos, and narratives from natural environments
-
Monitor online community discussions and shared experiences
-
Track patterns across broader population
Phase 4: Integration and Validation (Weeks 13-14)
-
Compare immersion findings with scaled observations
-
Identify which patterns hold across populations
-
Document segment-specific variations
-
Synthesize insights that combine depth and breadth
The Unstructured Conversation Problem
Your survey asks about price, quality, and convenience because you decided those were the important factors. So that’s all people can tell you about.
What if the real reason they switched brands was because your packaging reminded them of their ex’s apartment? What if they hate your product but keep buying it because it’s what their mom used? What if the thing that actually matters never made it into your multiple-choice options?
Structured research only lets people tell you things you already thought to ask about. Everything else gets lost.
How Survey Design Predetermines Findings
You offer response options that reflect your hypothesis about how people think. Participants can only tell you things that fit within the system you’ve provided. Unstructured conversations remove those boundaries. You start with an open question and follow wherever the participant leads. They tell you about factors you never thought to ask about. They make connections between ideas that your structured research kept in separate questions.
They contradict themselves in ways that reveal the complexity of their actual decision-making.
This is where genuine discovery happens, but it requires giving up control over the conversation. Most organizations struggle with this because unstructured research feels inefficient. You can’t predict what you’ll learn or how long it will take. You can’t easily compare responses across participants. But those inefficiencies are exactly what allow unexpected insights to surface.
The Analysis Challenge in Qualitative Research
Unstructured data is difficult to analyze because it doesn’t come in neat categories. You can’t just count responses or calculate averages. You need to read transcripts, identify themes, look for patterns across participants, and make interpretive judgments about what matters. This takes time and requires researchers who can think conceptually rather than just process data.
Many organizations lack either the time or the analytical capability to handle truly unstructured research.
The temptation is to impose structure during analysis, forcing messy qualitative data into predetermined categories so you can quantify it. That defeats the entire purpose. You went to the effort of collecting unstructured data specifically to discover things that don’t fit your existing thinking. If you’re just going to categorize everything according to your preconceptions, you should have used a structured survey in the first place.

Practical Approaches for Incorporating Open-Ended Research
You don’t need to make every research project unstructured. You need strategic insertion points where unstructured methods can surface unexpected insights. Exploratory interviews at the beginning of a research program, before you’ve designed your structured instruments. Follow-up conversations with survey participants who gave unusual or contradictory responses. Periodic open-ended research projects that run parallel to your structured tracking studies.
Accept that unstructured research produces different outputs than structured methods. You won’t get clean numbers or statistical significance. You’ll get hypotheses, contextual understanding, and challenges to your assumptions. These insights feed into your structured research design, inform how you interpret quantitative findings, and occasionally blow up strategies that looked solid based on survey data alone.
I use a model where structured and unstructured research inform each other in cycles. Unstructured conversations generate hypotheses. Structured methods test whether those hypotheses hold across larger populations. Anomalies in the structured data trigger new unstructured exploration. Neither method is complete without the other, but they serve fundamentally different purposes in the research system.
Competitive analysis benefits enormously from unstructured research. When you ask people to freely discuss their experiences with your category, they reveal competitor advantages you never knew existed. They mention brands you didn’t think were competitors. They explain switching decisions in ways that reshape your entire understanding of the competitive set.
Research Integration When Silos Are Killing Insights
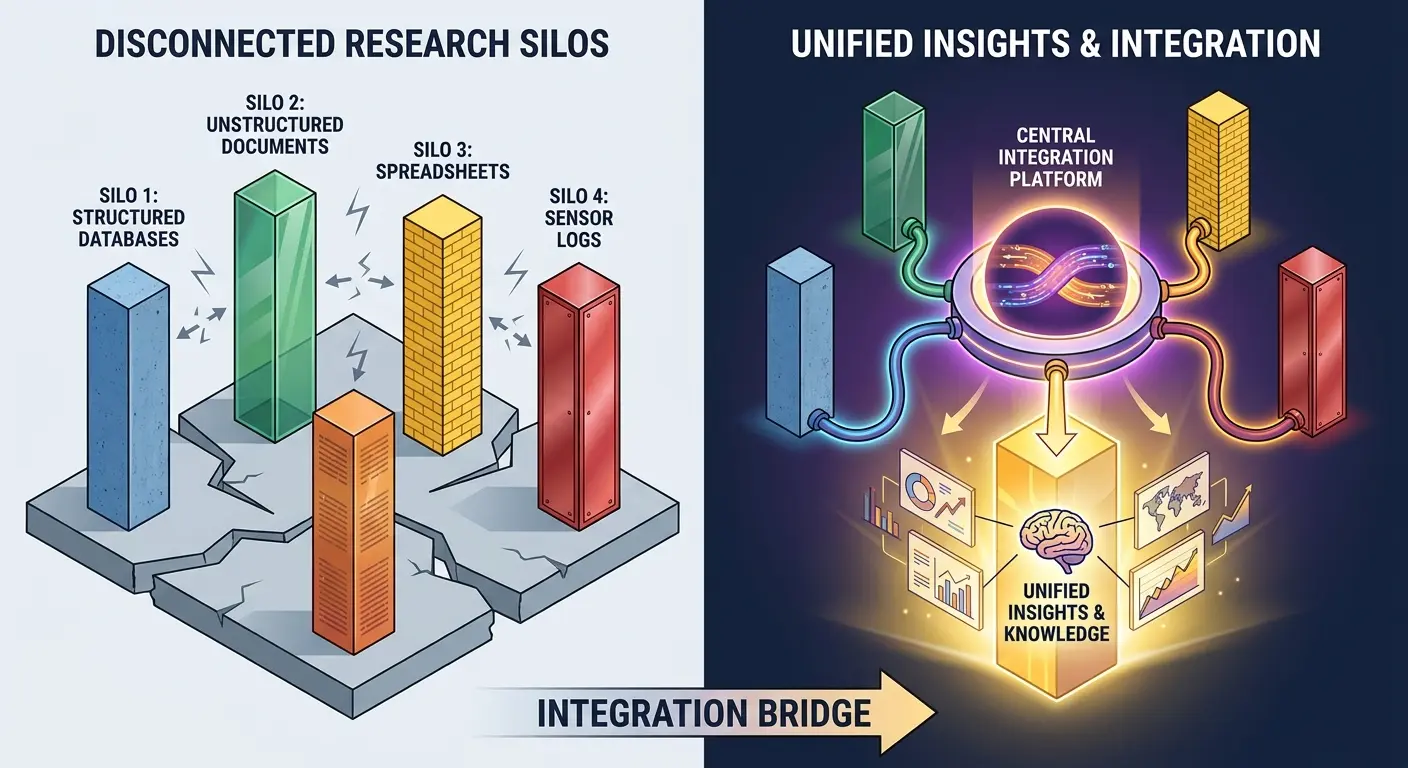
Organizational silos fragment market research into disconnected streams that produce contradictory findings and incomplete pictures. Your customer experience team runs satisfaction surveys. Your product team conducts usability testing. Your brand team tracks awareness and perception. Your competitive intelligence team monitors market movements. Each function generates valuable insights, but they rarely talk to each other.
The Fragmentation Problem in Research Functions
You end up with four different pictures of the same customer, often with contradictory implications for strategy. Someone might score high on satisfaction surveys while showing frustration in usability tests. Your brand tracking might show strong awareness while your competitive research reveals you’re losing market share.
These contradictions aren’t errors in the data. They’re signals that you’re looking at different facets of a complex reality.
But when research functions don’t integrate their findings, you never develop the complete picture that would make sense of the contradictions. Each team optimizes for their own metrics without understanding how their piece fits into the larger puzzle. Marketing celebrates increased awareness while product struggles with retention. Customer service reports high satisfaction while sales watches conversion rates decline.
Cross-Functional Research Frameworks
Integration doesn’t mean consolidating all research under one team (though that can help). It means creating processes that connect insights across functions. Shared research calendars so teams know what others are studying. Regular cross-functional sessions where different research streams present findings together. Integrated reporting that shows how different data sources complement or contradict each other.
Create collision points where insights from different sources interact. Your customer satisfaction data becomes more meaningful when viewed alongside your competitive positioning research. Your usability findings gain context from your brand perception tracking. You start to see patterns that no single research stream could reveal because you’re combining different types of data collected at different scales with different methods.
I’ve watched companies make catastrophic strategic errors because their research functions didn’t talk to each other. Product teams launched features based on usability research while brand teams ran campaigns that positioned the company in completely different directions. Neither team was wrong based on their data. But the integrated picture would have revealed the disconnect before it reached market.
Building Connected Insight Systems
Technology can help integration, but it’s not primarily a technology problem. You need shared databases where research findings are accessible across teams. Tagging systems that let you connect related insights even when they come from different studies. Dashboards that pull together metrics from multiple sources.
But the real barrier is usually cultural and political, not technical.
Research teams protect their turf. They’ve built expertise in specific methods and don’t want to be second-guessed by people using different approaches. They report to different executives with different priorities. Integration requires breaking down these barriers, which means leadership commitment to valuing connected insights over functional autonomy. Someone needs to own the complete picture, not just their piece of it.
Predictive Modeling That Accounts for Irrationality
Traditional predictive models assume people make consistent choices based on stable preferences and logical evaluation of options. These models work great in theory and fail constantly in practice because humans aren’t rational actors. We make different decisions based on how options are framed. We value things differently depending on whether we own them already. We’re loss-averse, present-bi
ased, and heavily influenced by irrelevant contextual factors.
Why Rational Actor Models Keep Failing
Your predictive models built on rational assumptions will systematically mispredict behavior at exactly the moments that matter most. During crises when emotions run high. At decision points where multiple conflicting values come into play. In new situations where people don’t have established preferences. These are precisely the situations where businesses most need accurate predictions, and they’re where rational models break down completely.
Competitive analysis suffers from the same problem. You model competitor moves assuming rational strategic behavior, then they do something that makes no sense from a rational perspective but works brilliantly because it taps into emotional or social dynamics your model didn’t account for.

Incorporating Behavioral Patterns Into Forecasts
Behavioral economics has documented dozens of cognitive biases and irrational patterns that show up consistently in human decision-making. These aren’t random errors. They’re predictable deviations from rational choice that you can model if you accept that irrationality is part of the pattern, not noise to be eliminated.
Loss aversion means people will take bigger risks to avoid losses than to achieve equivalent gains. Anchoring means the first number someone sees disproportionately influences their perception of value.
Building these patterns into predictive models means abandoning the elegance of rational choice theory for the messiness of actual human behavior. Your models become more complex because you’re accounting for context, framing effects, and emotional states. But they become more accurate because they’re predicting what people do rather than what they theoretically should do.
I’ve seen this play out repeatedly in pricing research. Rational models predict price sensitivity based on income and product category. Behavioral models that account for reference points, loss aversion, and mental accounting predict actual purchase behavior far more accurately, even though they’re “messier” and harder to explain to executives who want clean linear relationships.
Dynamic Models That Adapt to Shifting Contexts
People’s preferences aren’t just irrational. They’re unstable. Someone’s willingness to pay changes based on their mood, recent experiences, and current circumstances. Static models that treat preferences as fixed parameters will always lag behind reality. You need dynamic models that update as contexts shift and as you gather new data about how people are behaving right now.
Machine learning approaches can help here because they’re designed to identify patterns in messy data without requiring you to specify the underlying model. You feed in behavioral data along with contextual variables and let the algorithms find the relationships.
The risk is that you lose interpretability. You have a model that predicts behavior but you can’t explain why it works, which makes it harder to develop strategic insights beyond the predictions themselves.
The balance I’ve found most useful is hybrid models that incorporate known behavioral patterns (loss aversion, social proof, scarcity effects) as explicit variables while using machine learning to identify how these patterns interact with context and with each other. You get better predictions than pure rational models, plus you maintain enough interpretability to generate strategic insights.
Final Thoughts
Look, you’re probably not going to do most of this.
You’ll read this, nod along, maybe send it to your research team. Then you’ll keep running the same surveys you’ve always run because they’re fast, cheap, and your VP understands them.
And your research will keep missing the same things it’s always missed. The emotional triggers. The context. The gap between what people say and what they do. You’ll keep building strategies on data that’s technically accurate but fundamentally wrong.
Market research methods have become incredibly sophisticated at measuring the wrong things. We can track millions of data points, achieve statistical significance across massive samples, and generate insights with impressive speed. But we’re still treating people as rational, consistent, and transparent when they’re emotional, contradictory, and often unaware of their own motivations.
The methods that matter most right now are the ones that account for human messiness rather than trying to eliminate it. Research that captures emotional context, not just behavioral data. Longitudinal approaches that track how people change rather than assuming stability. Passive observation that reveals authentic behavior instead of performed responses. Ethnographic depth applied at scale through hybrid models. Unstructured conversations that surface insights your survey design would never capture.
None of this means abandoning quantitative methods or structured research. It means recognizing that different questions require different approaches and that the complete picture only emerges when you integrate multiple research streams. Your customer satisfaction scores mean something different when viewed alongside ethnographic observation of actual product use. Your market share data tells a richer story when combined with unstructured conversations about why people switch brands.
The brands that get this right aren’t the ones with the biggest research budgets or the most advanced analytics platforms. They’re the ones who’ve built research systems that evolve with behavior, integrate insights across functions, and treat human irrationality as signal rather than noise. They’re comfortable with research findings that create more questions than answers because they understand that genuine insight usually complicates rather than simplifies.
Or you could try one thing. Pick one method from this list (doesn’t matter which one) and run it parallel to your next major research project. Not instead of your surveys. Alongside them.
See what you find. See what your surveys missed.
Then decide if you want to keep ignoring the humans behind the data.
Your research methods shape what you can discover. If you’re only asking questions that fit your existing thinking, you’ll only get answers that confirm what you already believe. The market research methods that matter most are the ones that make you uncomfortable, challenge your assumptions, and reveal the gaps between what you think you know and what’s actually happening in the messy reality of human decision-making.