
You’re drowning in data but starving for insight.
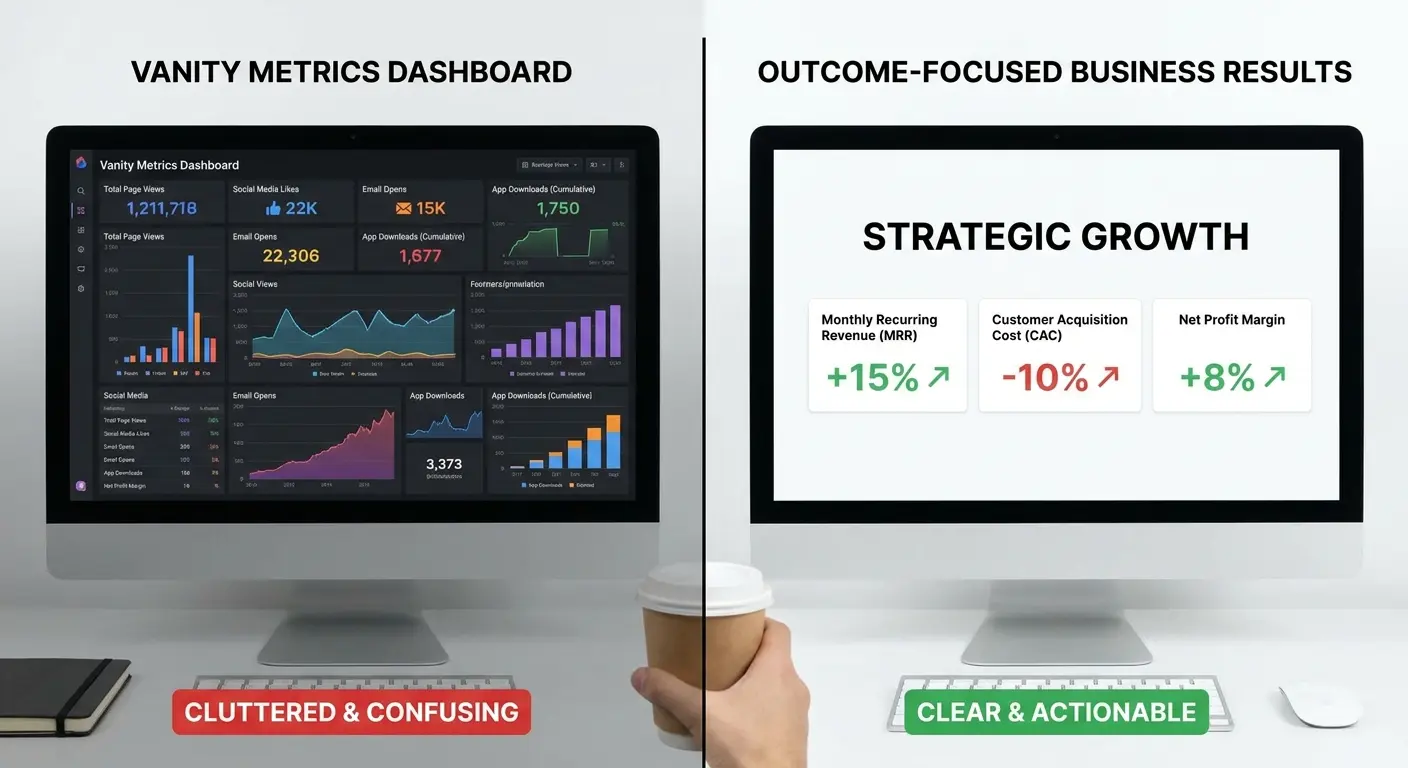
I know because I’ve seen your dashboards. They track everything: clicks, impressions, conversions, engagement rates, time-on-site, bounce rates, scroll depth. Everything. And you still can’t answer the one question that actually matters: what’s working and why?
It’s not your tools. It’s not your team’s analytical chops. The problem is that we’ve all been conditioned (trained, really) to measure activity instead of impact. We track outputs when we should track outcomes. We confuse correlation with causation and call it “data-driven.” Performance analytics has turned into an elaborate reporting exercise, and it’s costing you more than you realize.
TL;DR
Most performance analytics systems measure outputs (clicks, impressions, conversions) instead of outcomes (revenue quality, customer lifetime value, market position). Multi-touch attribution models create false confidence by assigning credit where causation doesn’t exist. Real-time dashboards encourage reactive decision-making and prevent strategic pattern recognition.
Incrementality testing reveals true performance by measuring what would have happened without your marketing intervention. Traditional analytics stacks are built around data collection first, business questions second (the reverse of what drives value). Descriptive analytics tells you what happened; predictive analytics tells you what to do next (most teams are stuck in descriptive mode).
Data abundance without clear outcome definitions creates analysis paralysis and metric manipulation. Outcome-first frameworks start with business impact definitions and work backward to measurement design. Understanding what is performance analytics at its core means recognizing that measurement without strategic purpose is just expensive record-keeping. We need performance analytics systems that inform decisions, not just document activity.
The Outcome Blindness Problem: Why Your Metrics Tell You What Happened But Not What Matters
I’ve audited performance analytics setups for 50+ companies over the past four years. The conversation is always the same: “We have so much data, but we can’t figure out what’s actually driving results.” They show me dashboards with 40+ metrics. They walk me through attribution models that assign fractional credit to 12 different touchpoints. They explain their real-time monitoring systems.
And then I ask: “Which of your marketing channels would you cut if you had to reduce budget by 30%?”
Silence. They don’t know. Because they’re measuring activity, not impact.
We’ve become obsessed with tracking everything we can measure instead of everything that matters. Your dashboard shows a 40% increase in email open rates, but revenue from email is flat. Your paid search CTR improved by 25%, but customer acquisition costs went up.
These aren’t contradictions. They’re symptoms of what I call outcome blindness, where we optimize for metrics that feel productive but don’t connect to actual business results.
But it’s worse than just picking bad metrics. Most analytics platforms are designed to answer “what happened” questions (descriptive analytics) rather than “what should we do” questions (prescriptive analytics). We end up with beautiful visualizations of activity that don’t inform strategy because they weren’t designed to measure outcomes in the first place. Performance analytics should reveal what drives growth, but instead we’re measuring proxies for activity and hoping they correlate with success.
If you want to measure outcomes instead of outputs, you need to completely rethink what “success” means. Outputs are things you do: send emails, run ads, publish content, generate leads.
Outcomes? That’s what actually changes in your business. Revenue grows. You steal market share from competitors. Customers stick around longer. Your brand stops being invisible.
You can hit every output target and still fail at your outcomes. Worse, you can optimize outputs so aggressively that you actively harm outcomes. Hello, lead generation campaigns that destroy sales team efficiency with junk leads.
Here’s why this matters: your analytics infrastructure is built to measure outputs. Outcomes? Barely tracked at all. We track form submissions but not whether those submissions turn into profitable customers. We measure traffic but not whether that traffic represents our ideal customer profile. We count conversions but not whether those conversions stick around or churn in 30 days.
The data exists to measure outcomes, but we’ve structured our performance analytics around what’s easy to instrument rather than what’s strategically valuable.
|
Metric Type |
What It Measures |
Why It Misleads |
What You Should Measure Instead |
|---|---|---|---|
|
Email Open Rate |
Activity/Engagement |
Opens don’t correlate with revenue; can be inflated by image loading, preview panes, Apple’s privacy features, etc. |
Revenue per email send, conversion rate to purchase, customer reactivation rate |
|
Website Traffic |
Volume |
Traffic without context tells you nothing about quality or intent |
Traffic from ICP, engaged session rate, qualified lead gen rate |
|
Form Submissions |
Output |
Volume ≠ quality |
Lead-to-customer conversion, sales-accepted lead rate, CAC by source |
|
Click-Through Rate |
Engagement |
You can game this so easily it’s embarrassing |
Conversion rate, incremental revenue per click, LTV by traffic source |
|
Social Media Followers |
Vanity (don’t @ me) |
Zero correlation to business outcomes. Zero. |
Social-driven revenue, CAC from social, engagement among target accounts (if you can even measure these properly) |
The Revenue Quality Gap
Revenue isn’t created equal, yet most analytics treat every dollar the same. A customer acquired through a brand search who stays for five years contributes vastly different value than someone who clicked a retargeting ad, bought once, and never returned. Your conversion tracking doesn’t distinguish between them. This creates perverse incentives where teams optimize for conversion volume rather than customer value, driving short-term wins that erode long-term profitability.
We need performance analytics that segment performance by cohort quality, not just cohort size. What’s the six-month retention rate of customers from each channel? What’s the average order value progression? How does support cost vary by acquisition source?
These outcome metrics reveal which activities build sustainable growth versus which ones inflate vanity metrics while burning budget.
The Strategy Tax of Misaligned Metrics
When your team optimizes for the wrong metrics, they make rational decisions that harm the business. Your content team produces clickbait because traffic is their KPI, even though bounce rates are 80% and conversion rates are abysmal. Your paid media team chases cheaper clicks in low-intent channels because CPC is their metric, even though those clicks never convert.
Your email team sends more frequently because sends and opens are what get reported, even though unsubscribe rates are climbing and deliverability is degrading.
This isn’t a people problem. It’s a measurement problem. You’ve built an analytics system that rewards activity and punishes strategic thinking. The solution isn’t better training or clearer communication. It’s rebuilding your measurement framework around outcomes that actually matter to business performance.
I worked with a Series B SaaS company (marketing automation space) that measured their content team on monthly page views and organic traffic growth. The content director was proud. They’d hit 300% growth in six months. Trial signups from organic traffic dropped 45%. The content attracted job seekers, students, and researchers, not potential customers.
When they shifted measurement to “organic traffic from target job titles that starts trials,” content strategy pivoted to product-focused content for decision-makers. Traffic dropped by half, but qualified trials from organic increased 200%. Revenue attribution to content marketing tripled within a quarter.
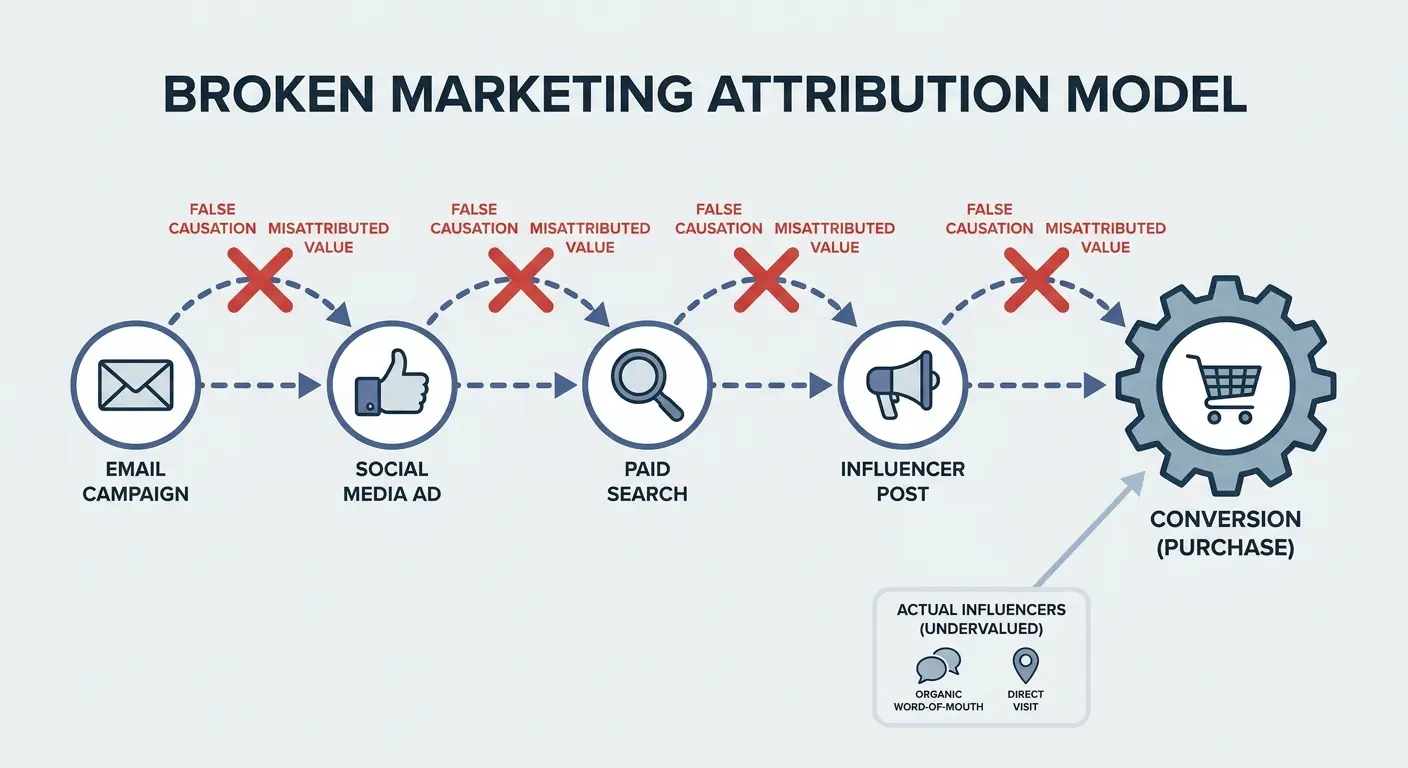
Attribution Is Dead (And We’re Still Pretending It’s Alive)
Multi-touch attribution was supposed to solve the “which channel deserves credit” problem. The logic seemed sound: distribute value across every touchpoint in the customer journey. Give everyone a piece of the pie. Make the data fair.
Except it doesn’t work.
The fundamental flaw is that attribution models assign credit based on correlation (this touchpoint was present in the journey) rather than causation (this touchpoint caused the conversion). Your customer saw a display ad, clicked a paid search ad, visited your site organically, and converted. Did the display ad contribute to that conversion, or was it just noise that happened to occur before a purchase that would have happened anyway? Attribution models can’t tell you, but they’ll confidently assign it 20% of the credit anyway.
Here’s what nobody tells you about multi-touch attribution: it’s not measuring what you think it’s measuring. The bigger issue is that attribution modeling assumes all touchpoints contribute positively and that their contribution is measurable through their presence in conversion paths. Both assumptions are wrong. Some touchpoints have zero incremental impact. Others have negative impact (interrupting high-intent users with irrelevant messaging).
Attribution models treat them all as value-adding because they appeared in the journey, creating false confidence in channel performance and misallocating budget to activities that don’t drive incremental results. Performance analytics built on attribution data is essentially performance theater, creating the appearance of insight without the substance.
We keep using attribution because it feels scientific and because the alternative (admitting we don’t know which specific touchpoint caused which specific conversion) feels uncomfortable. But comfort isn’t the goal. Accuracy is. Attribution modeling gives you precise answers to the wrong question. What you actually need to know isn’t which touchpoint gets credit, but which activities drive incremental outcomes that wouldn’t have happened otherwise.
Why Incrementality Beats Attribution Every Time
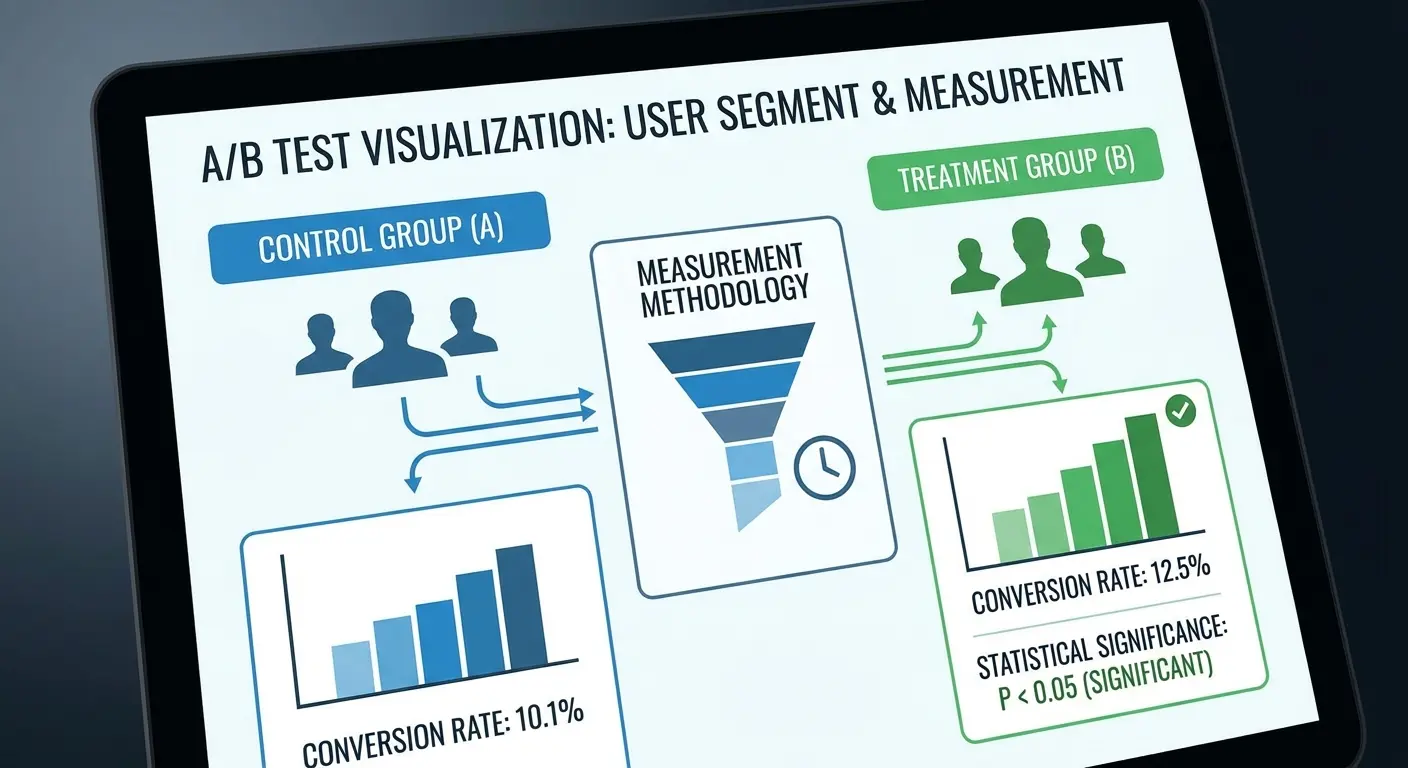
Incrementality testing measures what attribution modeling claims to measure: the actual impact of your marketing activities. Instead of assigning credit based on correlation, incrementality tests compare outcomes between groups exposed to your marketing and control groups that weren’t. The difference is your true incremental impact. If you pause a channel and revenue doesn’t drop, that channel wasn’t driving incremental value regardless of what your attribution model claimed.
Yeah, this is uncomfortable. It’ll expose every gap in how you currently measure things. You need to admit that some of your marketing spend probably isn’t working. But you’re already wasting that budget. You just don’t know it yet because your attribution model is telling you a comforting story about how everything contributes. Incrementality testing reveals the truth, which is that some channels drive massive incremental value, others drive modest value, and some drive no incremental value at all despite appearing in lots of conversion paths. Performance analytics without incrementality testing is guesswork dressed up as science.
A mid-market e-commerce retailer (home goods category) ran display retargeting campaigns that their attribution model credited with $2M in annual revenue using last-click attribution, and $800K using linear multi-touch attribution. They ran a geo-holdout test, turning off display retargeting in randomly selected markets for 60 days while maintaining it in control markets. Revenue in test markets dropped by $50K, not $800K.
Their display retargeting was capturing 94% of its attributed value from customers who would have converted anyway. The true incremental contribution was $50K against $300K in annual spend. They reallocated that budget to prospecting campaigns that showed genuine incrementality, increasing overall revenue by 12% with the same total marketing spend.
The Political Problem With Measurement Truth
Attribution models survive not because they’re accurate but because they’re politically convenient. They give every channel some credit, which keeps every team happy and makes budget allocation discussions feel data-driven. Incrementality testing creates winners and losers, which creates conflict.
Your display advertising might show zero incremental impact. Your brand team’s campaign might be driving 60% of your incremental revenue despite touching fewer conversion paths than performance channels.

These truths are uncomfortable, but optimizing based on false data is more expensive than having difficult conversations. The teams whose channels show low incrementality can redirect their efforts to higher-impact activities. The teams driving real incremental value can get the resources they deserve. You need measurement systems that reveal truth, not systems that maintain organizational peace at the expense of performance.
Side note: The resistance to incrementality testing is almost always political, not technical. Nobody wants to be the channel that shows zero incremental impact. I once had a display advertising manager argue for 45 minutes that we couldn’t run a holdout test because “our customers expect to see our ads.” They didn’t expect that. He expected to keep his budget.
The Hidden Cost of Real-Time Dashboards Nobody Talks About
Real-time dashboards are supposed to enable agile decision-making. They actually encourage reactive behavior that destroys strategic thinking. Every. Single. Time. When you can see performance data updating by the hour, you start making decisions based on hourly fluctuations. Your paid search performance dips at 2pm, so you adjust bids. Your email open rates are lower on Tuesday morning, so you shift send times. Your website traffic drops on Thursday afternoon, so you panic and publish more content.
None of these decisions are strategic. They’re reactions to noise, and they prevent you from seeing the patterns that actually matter.
Real-time data has a dirty secret: most performance metrics are just noise when you look at them hour-by-hour. Conversion rates fluctuate randomly day-to-day even when true performance is stable. Traffic varies by hour based on factors you can’t control. Engagement metrics bounce around based on sample size effects and random variation.
When you react to these fluctuations as if they’re meaningful signals, you’re essentially making decisions based on randomness. You’ll make changes that don’t improve performance (because there was no real problem) or that actively harm performance (because you’re introducing instability into systems that need consistency to work).
Real-time dashboards also create a culture of constant monitoring that distracts from strategic work. Your team spends hours watching metrics update instead of analyzing patterns, testing hypotheses, or developing new strategies. The dashboard becomes a security blanket rather than a decision-making tool.
We check it compulsively not because we need the information but because we’re anxious about performance and checking feels productive. It’s not. Performance analytics should inform strategy, not feed anxiety.
The Statistical Significance Problem
Most real-time metrics don’t have enough data volume to be statistically meaningful at short time intervals. Your conversion rate today is based on maybe 200 visitors and 6 conversions. That’s a 3% conversion rate, but the confidence interval on that estimate is huge. Tomorrow you get 4 conversions from 200 visitors (2% conversion rate), and you think performance dropped.
It didn’t. You’re just seeing normal statistical variation that happens when sample sizes are small.
This creates false pattern recognition where you see trends that don’t exist and make changes that don’t improve performance. You need measurement intervals that match your data volume. For most businesses, that means weekly or monthly performance analysis, not daily or hourly monitoring. The metrics that matter (revenue quality, customer lifetime value, retention rates, incremental impact) require longer time horizons to measure accurately anyway. What is performance analytics if not the discipline of measuring what matters at intervals that produce reliable insights?
|
Time Interval |
Appropriate Metrics |
Why This Interval Works |
What To Avoid |
|---|---|---|---|
|
Real-time (hourly) |
System uptime, payment processing errors, site performance, critical technical failures |
Immediate detection prevents cascading problems; technical issues require instant response |
Performance metrics, conversion rates, traffic patterns (too noisy at this interval) |
|
Daily |
Email deliverability, ad spend pacing, inventory alerts, customer service queue depth |
Operational adjustments that benefit from daily correction without overreacting to noise |
Strategic decisions, channel performance evaluation, budget reallocation |
|
Weekly |
Channel performance trends, campaign effectiveness, content engagement, lead quality metrics |
Sufficient sample size for statistical meaning; patterns emerge without excessive noise |
Long-term strategy shifts, annual planning decisions |
|
Monthly |
Customer acquisition costs, lifetime value trends, retention cohorts, market share movement |
Full conversion cycles captured; seasonal variation smoothed; strategic patterns clear |
Tactical optimizations that require faster feedback loops |
|
Quarterly |
Budget allocation effectiveness, strategic initiative ROI, competitive positioning, brand health |
Accounts for lag between marketing activity and business outcomes; informs strategic planning |
Whatever your CEO is obsessed with this quarter* |
*Operational metrics that need faster response
When Real-Time Actually Matters
Real-time monitoring makes sense for operational metrics where immediate action prevents problems: your website is down, your payment processor is failing, your email sends are bouncing at unusual rates. These are technical issues where real-time detection and response create value. Performance metrics (how well is our marketing working) don’t benefit from real-time monitoring because marketing performance doesn’t change hour-to-hour in meaningful ways, and even if it did, you can’t make strategic adjustments that quickly.
So here’s what you do: separate operational monitoring from performance analytics.
Operational monitoring = real-time, focused on system health. Is the site down? Is the payment processor failing? You need to know immediately.
Performance analytics = periodic, focused on strategic patterns. Is our marketing working? You need time and data to answer that properly.
Your real-time dashboard should be small, focused on technical metrics that require immediate response, and checked only when you need to verify system health.
Your performance analytics dashboard should be reviewed weekly or monthly, focused on outcome metrics that inform strategy, and designed to reveal patterns rather than fluctuations.
Incrementality Testing: The Unsexy Truth About What Actually Drives Growth
Incrementality testing sounds boring compared to sophisticated attribution modeling or AI-powered predictive analytics. It’s also the only method that actually tells you what’s working. The concept is simple: measure what happens when you turn something off or change it, compare that to what would have happened if you hadn’t made the change, and calculate the difference. That difference is your incremental impact. Everything else is correlation, assumption, and wishful thinking.
We avoid incrementality testing because it requires admitting uncertainty and because it’s operationally harder than installing tracking pixels and building dashboards. You need to design holdout groups or test-and-control experiments. You need to wait for statistically significant results instead of getting instant answers. You need to accept that some of your marketing spend will be directed to control groups that don’t see your ads, which feels like waste (even though it’s the only way to measure true impact).
Look, these barriers are real. But they’re not deal-breakers. They’re just skills you need to build.
Here’s what happens when you actually run incrementality tests: you get surprised. A lot. And those surprises are always worth the effort. Channels you thought were driving growth show zero incremental impact when tested properly. Campaigns you assumed were wasteful turn out to drive significant incremental value. Budget allocations that seemed optimal based on attribution data turn out to be dramatically suboptimal when measured incrementally.
You can’t fix what you can’t measure accurately, and you can’t measure marketing impact accurately without incrementality testing. Performance analytics that ignores incrementality is just expensive storytelling.
Designing Tests That Actually Answer Your Questions
Incrementality tests fail when they’re designed poorly. You need sufficient sample size, proper randomization, and clean test design. Your treatment and control groups need to be truly comparable (not just “similar”). Your test duration needs to be long enough to capture your full conversion cycle and account for day-of-week effects. Your measurement needs to focus on outcomes (revenue, profit, retention) not outputs (clicks, impressions, conversions).
The most common mistake is testing at too small a scale or for too short a duration. Your paid search test runs for two weeks with 1,000 visitors in each group, shows a 15% lift, and you declare victory. The result isn’t statistically significant, the test didn’t run long enough to measure repeat purchase behavior, and you’re making budget decisions based on noise. Proper incrementality testing requires patience and discipline, which is why so few companies do it well despite everyone claiming they’re “data-driven.” Performance analytics without rigorous testing is just opinion with numbers attached.
Incrementality Test Design Checklist
Before launching any incrementality test, verify:
-
Clear hypothesis defined: What specific incremental impact are you testing? (e.g., “Display advertising drives 15% incremental revenue beyond what would occur naturally”)
-
Outcome metric selected: Focus on business outcomes (revenue, profit, retention) not outputs (clicks, conversions)
-
Sample size calculated: Ensure sufficient volume to detect meaningful differences with statistical confidence
-
Randomization method confirmed: Treatment and control groups assigned randomly, not based on convenience or existing segments
-
Test duration determined: Long enough to capture full conversion cycle plus day-of-week/seasonality effects (minimum 4 weeks for most businesses)
-
Holdout percentage set: Typically 10-50% depending on risk tolerance and required statistical power
-
Contamination risks assessed: Ensure control group won’t be exposed to treatment through other channels or spillover effects
-
Success criteria established: Define minimum detectable effect and confidence level before running test
-
Stakeholder alignment secured: Confirm decision-makers will act on results regardless of outcome
Building a Testing Roadmap
You can’t test everything simultaneously, so you need a prioritization framework. Start with your largest budget items and your most uncertain assumptions. If you’re spending $500K annually on display advertising and you’ve never tested its incremental impact, that’s your first test. If your attribution model says email drives 30% of revenue but you suspect it’s mostly capturing demand that would have converted anyway, test it.
If you’re investing heavily in content marketing based on correlation between blog traffic and revenue, test whether that traffic is incremental or just capturing existing demand.
Build a testing calendar that spaces experiments appropriately (you can’t run overlapping tests on the same audience without contaminating results). Document your hypotheses before testing so you’re not retrofitting explanations to unexpected results. Commit to acting on test results even when they contradict your assumptions or preferences. The point of incrementality testing isn’t to validate what you already believe. It’s to discover what’s actually true.
A regional financial services company (wealth management focus) spent $1.2M annually on brand search campaigns, justified by attribution data showing brand search drove 40% of conversions. They ran a geo-holdout test, pausing brand search in 30% of markets for 90 days. Conversion volume in holdout markets dropped by only 3%. Most people searching for their brand name clicked the organic result when paid ads weren’t present.
The incremental value of brand search was $36K, not the $480K their attribution model claimed. They reduced brand search spend by 85%, reallocating budget to non-brand campaigns with proven incrementality. Total conversions increased 18% while overall paid search spend decreased 12%.
Why Your Analytics Stack Is Built Backwards
Most companies build their analytics infrastructure by starting with data collection tools and hoping insights emerge. You implement Google Analytics, add a data warehouse, connect a BI tool, build some dashboards, and assume you’ll figure out what questions to answer along the way. This approach guarantees you’ll have lots of data and very few insights because you’ve optimized for data capture rather than decision-making.
The right approach is backwards: start with the business outcomes you’re trying to influence, define the questions that would inform decisions about those outcomes, determine what data you’d need to answer those questions, and then build the collection and analysis infrastructure to provide that data. This outcome-first approach ensures every component of your analytics stack serves a strategic purpose rather than existing because it was easy to implement or because everyone else uses it. Performance analytics should answer business questions, not create busywork for data engineers.
When you build data-first instead of outcome-first, you end up with analytics systems that answer questions nobody asked. Your dashboard shows 47 metrics, but only three of them inform actual decisions. Your data warehouse contains millions of rows of behavioral data that never gets analyzed because it doesn’t connect to business outcomes.
Your team spends 80% of their time on data engineering and 20% on analysis, when it should be the reverse. The solution isn’t better tools. It’s better thinking about what you’re trying to achieve and working backward to the measurement infrastructure required. ServiceNow performance analytics and similar enterprise platforms can be powerful, but only if you’ve defined what you need to measure before you start configuring them.
The Business Question Framework
Before implementing any analytics tool or building any dashboard, write down the specific business questions you need to answer. Not “how is our marketing performing” (too vague). Specific questions: “Which acquisition channels drive customers with LTV above $500?” “What content topics correlate with trial-to-paid conversion?” “How does pricing page engagement predict upgrade behavior?” Each question should connect directly to a decision you need to make.
Once you have your questions, map out the data required to answer each one. This reveals gaps in your current data collection and prevents you from collecting data you don’t need. You might discover you’re tracking 30 different engagement metrics but none of them connect to your business questions, while the customer cohort data you actually need isn’t being captured at all.
This exercise is uncomfortable because it exposes how much of your current analytics infrastructure doesn’t serve strategic purposes. ServiceNow performance analytics implementations often fail because companies configure the platform before defining their business questions, resulting in sophisticated tools that don’t drive decisions. Performance analytics tools are only as valuable as the strategy behind them.
Outcome-First Analytics Design Template
Step 1: Define Business Outcome
-
Primary outcome metric: [e.g., Increase revenue from customers with 12-month retention]
-
Current performance: [baseline number]
-
Target performance: [goal number]
-
Time horizon: [measurement period]
Step 2: Identify Decision Questions
-
What decisions would change if we had better data about this outcome?
-
Question 1: [e.g., Which acquisition channels drive highest 12-month retention?]
-
Question 2: [e.g., What early behaviors predict long-term retention?]
-
Question 3: [e.g., How does pricing tier affect retention by customer segment?]
Step 3: Map Required Data
For each question, list:
-
Data points needed: [specific fields, events, attributes]
-
Current availability: [do we capture this today?]
-
Data source: [where does this data live?]
-
Integration requirements: [what systems need to connect?]
Step 4: Identify Gaps
-
Missing data points: [what we need but don’t capture]
-
Integration gaps: [systems that don’t communicate]
-
Quality issues: [incomplete, inaccurate, or inconsistent data]
Step 5: Build Implementation Plan
-
Priority order: [based on impact and feasibility]
-
Technical requirements: [tracking, integration, infrastructure]
-
Timeline: [realistic implementation schedule]
-
Success criteria: [how we’ll know it’s working]
The Integration Problem Nobody Solves
Your customer data lives in your CRM. Your product usage data lives in your analytics tool. Your marketing data lives in your ad platforms. Your financial data lives in your accounting system. Your analytics stack probably doesn’t connect these systems in ways that enable outcome measurement because integration is hard and because you built your stack tool-by-tool rather than designing it holistically.
Measuring outcomes requires connecting marketing activity to customer behavior to revenue realization. You need to know not just that someone clicked your ad and converted, but whether they became a profitable customer, how long they retained, what their support costs were, and how their behavior compares to customers from other sources. This requires data integration across systems that weren’t designed to talk to each other. ServiceNow performance solutions can help with this integration challenge, but only if you’ve mapped out what needs to connect and why.
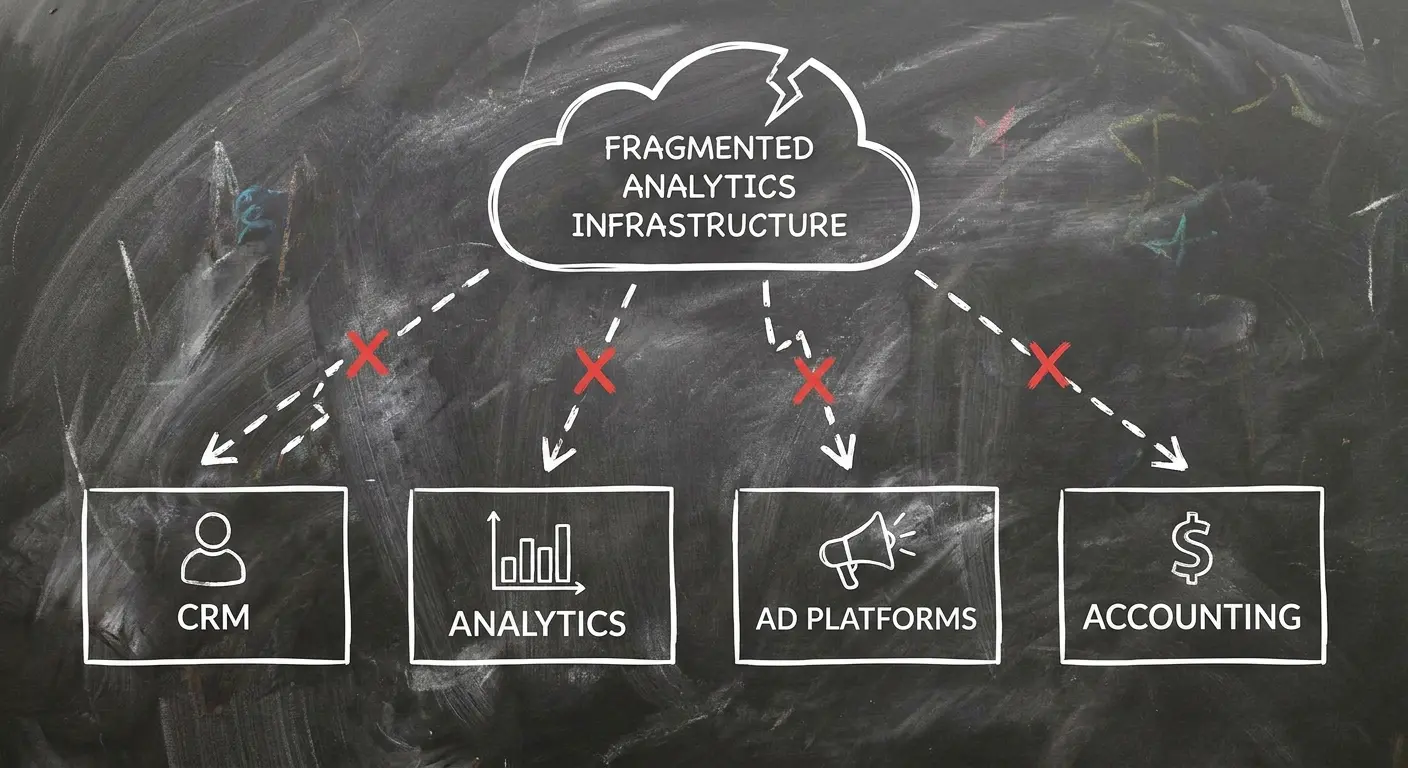
Most companies solve this with duct tape: manual exports, spreadsheet merging, or custom scripts that break every time a vendor updates their API. The better solution is building integration as a core requirement from the start. Your analytics architecture should be designed around customer-level data unification, where every interaction, transaction, and outcome connects to a persistent customer identifier.
This isn’t sexy infrastructure work, but it’s the foundation that makes outcome measurement possible. ServiceNow performance capabilities are wasted if your data sits in silos that never communicate.
Predictive vs. Descriptive: The Gap That’s Killing Your Competitive Advantage
Descriptive analytics tells you what happened. Your revenue grew 15% last quarter. Your email open rates declined 8%. Your paid search CPA increased by $12. These are facts, and they’re useful for reporting, but they don’t tell you what to do next.
Predictive analytics tells you what’s likely to happen and what actions would change those outcomes. Your current trajectory suggests 22% revenue growth next quarter, but if you reallocate 30% of display budget to paid search, models predict 28% growth instead.
Most marketing teams operate almost entirely in descriptive mode. We’ve gotten really good at explaining what happened and terrible at predicting what will happen or prescribing what we should do. This gap represents your competitive advantage opportunity because predictive capabilities compound over time. Companies that can forecast customer behavior, predict campaign performance, and model budget allocation scenarios make better decisions faster than companies stuck analyzing historical data. Understanding what is performance analytics means recognizing that backward-looking measurement without forward-looking prediction is incomplete.
The shift from descriptive to predictive analytics isn’t primarily a technology problem. You don’t need sophisticated AI or machine learning to start (though they help eventually). You need disciplined data collection, clear outcome definitions, and analytical frameworks that prioritize forward-looking questions over backward-looking reporting. What will happen if we change this? Which customers are most likely to churn? Which prospects are most likely to convert?
These questions require different data structures and analytical approaches than the “what happened last month” questions your current performance analytics probably focuses on.
Building Predictive Models That Actually Work
Predictive analytics fails when companies jump straight to complex modeling without establishing data foundations. You can’t predict customer lifetime value if you don’t have clean historical LTV data. You can’t forecast campaign performance if your attribution is broken. You can’t model budget optimization if you haven’t measured incrementality. Predictive analytics amplifies your data quality and measurement accuracy. If those foundations are weak, your predictions will be confidently wrong rather than useful.
Start with simple predictive questions that have clear validation mechanisms. Predict next month’s conversion rates by channel and compare predictions to actual results. Predict which trial users will convert to paid and measure accuracy. Predict which customers will make repeat purchases and track outcomes.
These simple models teach you what signals actually predict outcomes (versus what you assumed would predict outcomes) and build the muscle for more sophisticated prediction over time. Performance analytics should evolve from “what happened” to “what will happen” to “what should we do.”
The Scenario Planning Advantage
The real power of predictive analytics isn’t forecasting what will happen. It’s modeling what could happen under different scenarios. What if we cut paid social spend by 50% and reallocated it to content? What if we increased prices by 15%? What if we focused acquisition on enterprise customers instead of SMBs? Descriptive analytics can’t answer these questions because they haven’t happened yet. Predictive models can simulate outcomes and inform strategic decisions before you commit resources.

This scenario planning capability transforms analytics from a reporting function into a strategic planning function. Your quarterly planning process can evaluate five different budget allocation strategies and model expected outcomes for each one. Your pricing decisions can incorporate demand elasticity models rather than guesswork. Your market expansion plans can forecast customer acquisition costs and lifetime values before you enter new segments. You’re making decisions based on probable futures rather than extrapolated pasts.
The Measurement Paradox: When More Data Creates Less Clarity
We’ve never had more data, and we’ve never been more confused about what’s working. This isn’t a contradiction. It’s a predictable outcome of optimizing for data quantity rather than insight quality. Your analytics platform tracks 200 different metrics. Your dashboard displays 47 of them. Your team looks at maybe 10 regularly and makes decisions based on 3. The other 197 metrics exist because they were easy to collect, not because they inform decisions.
This data abundance creates three problems. First, it enables metric shopping, where teams cherry-pick whichever metrics make their performance look good rather than focusing on outcomes that matter. Second, it creates analysis paralysis, where you have so many metrics that you can’t identify clear patterns or priorities. Third, it obscures what’s actually important by treating all metrics as equally valuable when they’re not. Performance analytics drowning in vanity metrics is worse than no analytics at all.
The solution isn’t collecting less data. It’s being ruthlessly selective about which metrics you pay attention to and which ones you ignore. You need a hierarchy: outcome metrics that directly measure business impact (revenue, profit, customer retention), leading indicators that predict those outcomes (qualified lead volume, trial activation rates), and diagnostic metrics that help you understand why outcomes changed (traffic sources, engagement patterns). Everything else is noise.
The Metric Manipulation Problem
When teams are measured on specific metrics, they optimize for those metrics even when optimization harms actual outcomes. Your sales team is measured on lead volume, so they lower lead qualification standards and flood the pipeline with junk. Your content team is measured on traffic, so they chase viral topics unrelated to your business. Your paid media team is measured on ROAS, so they focus exclusively on bottom-funnel conversions and starve brand awareness.
This isn’t malicious. It’s rational behavior in response to misaligned measurement. The fix requires measuring teams on outcomes they can influence rather than outputs they can manipulate. Sales should be measured on revenue from qualified opportunities, not lead volume. Content should be measured on engaged traffic that converts, not total pageviews.
Paid media should be measured on incremental revenue contribution, not ROAS calculated from broken attribution models. When measurement aligns with actual business value, optimization drives growth instead of gaming. Performance analytics must resist the temptation to measure what’s easy instead of what matters.
Building a Metric Hierarchy That Drives Focus
Your analytics framework needs clear prioritization. Tier 1 metrics are your north star: the 2-3 outcomes that define business success (revenue growth, customer retention, market share). These are what leadership reviews and what strategy optimizes for. Tier 2 metrics are leading indicators: the 5-8 metrics that predict Tier 1 outcomes and inform tactical decisions. Tier 3 metrics are diagnostic: the 10-15 metrics that help you understand why Tier 1 and Tier 2 metrics changed.
Everything else gets ignored or reviewed only when investigating specific problems. This hierarchy prevents metric proliferation and ensures your team focuses analytical energy on what matters. Your weekly performance review looks at Tier 1 and Tier 2 metrics only. Your monthly deep dives incorporate Tier 3 metrics to diagnose patterns. Your quarterly planning refines the hierarchy based on what actually predicted outcomes versus what you thought would predict outcomes.
Here’s a test: Open your analytics dashboard right now. Look at the metrics on the first page. For each one, ask yourself: “If this number went up or down by 20%, what decision would I make differently?”
If you can’t answer that question for a metric, delete it. You’re tracking it out of habit, not strategy.
Building an Outcome-First Analytics Framework That Actually Works
Outcome-first analytics requires rethinking your entire measurement approach, not just adding new metrics to existing dashboards. You start by defining business outcomes you’re trying to influence: revenue growth, profit margin improvement, customer lifetime value increase, market share expansion. These aren’t marketing metrics. They’re business metrics that marketing should contribute to. Your analytics framework exists to measure marketing’s contribution to these outcomes, not to measure marketing activity in isolation.
Once outcomes are defined, you work backward to identify the customer behaviors and business results that drive those outcomes. Revenue growth comes from new customer acquisition and existing customer expansion. Customer acquisition comes from converting qualified prospects. Qualified prospects come from attracting your ideal customer profile. Each step backward reveals what you need to measure and how those measurements connect to outcomes that matter. Performance analytics built this way serves strategy instead of generating reports nobody reads.
Yeah, this is uncomfortable. It’ll expose every gap in how you currently measure things. You might discover you’re tracking dozens of metrics that don’t connect to any defined outcome. You might realize your conversion tracking captures activity but not the quality metrics that predict customer value. You might find that your most-watched dashboards answer questions nobody needs answered.
These discoveries are valuable because they reveal where to focus improvement efforts. What is performance analytics supposed to accomplish? If you can’t answer that question with specific business outcomes, you’re building measurement theater. Understanding performance analytics fundamentals means starting with outcomes and working backward to measurement design.
Connecting Marketing Activity to Business Outcomes
The hardest part of outcome-first analytics is building the connective tissue between marketing metrics and business results. Your content marketing drives traffic, but does that traffic convert? Do those conversions become profitable customers? Do those customers retain? Without these connections, you’re measuring activity in isolation and hoping it contributes to outcomes.
Building these connections requires data integration across systems and disciplined cohort analysis over time. You need to track customer cohorts from initial marketing exposure through conversion, activation, retention, and lifetime value realization. This means connecting your marketing analytics to your CRM, your product analytics, your support systems, and your financial data. It means tracking customers for months or years, not just through initial conversion. It means accepting that some marketing impact can’t be measured immediately because outcomes take time to materialize.
ServiceNow performance analytics platforms can facilitate this integration when configured properly, but the technology is useless without clear outcome definitions driving the implementation. A performance analysis tool is only as good as the strategy behind it. You need to define what success looks like before you start instrumenting measurement, not after.
The Experimentation Culture Requirement
Outcome-first analytics only works if you’re willing to test assumptions and act on results. Your framework might reveal that your highest-traffic channel drives low-quality customers. Your incrementality tests might show that your favorite campaign has zero incremental impact. Your cohort analysis might demonstrate that cheaper acquisition sources drive higher lifetime value than expensive ones. These insights are only valuable if you’re willing to reallocate resources based on evidence rather than intuition or organizational politics.
This requires building an experimentation culture where testing is expected, failure is acceptable, and evidence trumps opinion. Your team needs permission to run tests that might show negative results. Your leadership needs to support budget reallocation based on test outcomes. Your organization needs to value learning over being right. Without this cultural foundation, outcome-first analytics becomes another reporting exercise that doesn’t change behavior. ServiceNow performance capabilities and other enterprise platforms can’t fix cultural resistance to data-driven decision-making.
Starting Small and Scaling Systematically
You don’t need to rebuild your entire analytics infrastructure overnight. Start with one outcome metric and one major marketing investment. Define the outcome clearly (not just “increase revenue” but “increase revenue from customers with LTV above $X who retain for at least Y months”). Map the customer journey from marketing exposure to outcome realization. Identify data gaps that prevent measurement. Build the integration and tracking to close those gaps. Run incrementality tests to measure true impact. Use insights to optimize investment.
This focused approach builds capability and proves value before you scale. Once you’ve successfully measured one outcome for one investment, expand to additional outcomes and marketing activities. Each iteration teaches you what works in your organization and builds the data infrastructure, analytical skills, and cultural practices required for outcome-first analytics at scale. You’re building a system that compounds in value over time rather than implementing a one-time project that gets abandoned when the initial enthusiasm fades.
Where We Come In
Look, I get it. You read this whole thing and now you’re thinking “great, my analytics are broken, what the hell do I do about it?”
That’s where we come in. But not in the “let us sell you consulting” way. More in the “we’ve done this exact rebuild 50+ times and know where the bodies are buried” way.
We help companies define outcomes that actually matter (not the ones that sound good in board meetings), design measurement systems that connect marketing activity to those outcomes (which means integration work that’s boring but essential), and implement incrementality testing that reveals what’s really driving growth (which means killing some sacred cows).
We’re not interested in building you dashboard #47. We’re interested in building measurement systems that change how you allocate budget.
If that sounds like what you need, schedule a consultation. We’ll audit your current setup, identify the gaps between what you’re measuring and what you need to know, and map out what outcome-first analytics would look like for your specific business. No generic frameworks. No cookie-cutter dashboards.
Fair warning: this process will reveal uncomfortable truths about what’s working and what isn’t. If you’re not ready to act on those truths, we’re not the right fit.
Final Thoughts
I started this piece saying you’re drowning in data but starving for insight. If you’ve read this far, you know I’m right. Your dashboards are full. Your decisions are based on guesswork dressed up as analytics. Your competitors are in the same boat.
For now.
The companies that figure out outcome-first analytics in the next 12-18 months will have a compounding advantage. They’ll know what actually drives growth. They’ll allocate budget based on evidence, not politics. They’ll make better decisions faster.
You can be one of those companies, or you can keep measuring activity and hoping it correlates with success.
I know which one I’d choose.
The question is: do you have the stomach for what you’ll learn when you start measuring outcomes honestly? Because some of your favorite channels will show zero incremental impact. Some of your team’s best work will turn out to be waste. Some of your assumptions will be proven wrong.
That’s uncomfortable. It’s also how you win.
Your move.