If you think you get paid a flat rate per stream on Spotify, I’ve got some bad news for you. That “$0.003 per stream” number everyone throws around? It’s basically useless. “Spotify pays roughly $0.00238 per stream based on the Worldwide Average” according to Artist.Tools, but this average hides the brutal reality that can make the difference between earning $200 or $2,000 from the same 100,000 streams. Here’s what’s really happening with your money and how to actually figure out what you’re earning.
Table of Contents
-
Understanding Spotify’s Payment Structure
-
Calculator Tool Categories and Selection
-
Optimization Strategies for Revenue Maximization
-
Integration with Business Planning
-
Final Thoughts
TL;DR
-
Spotify doesn’t pay you a fixed rate – your earnings change based on who’s listening, where they’re from, and how much money Spotify made that month
-
Premium subscribers are worth 3-5x more than free users, so audience quality beats stream count every time
-
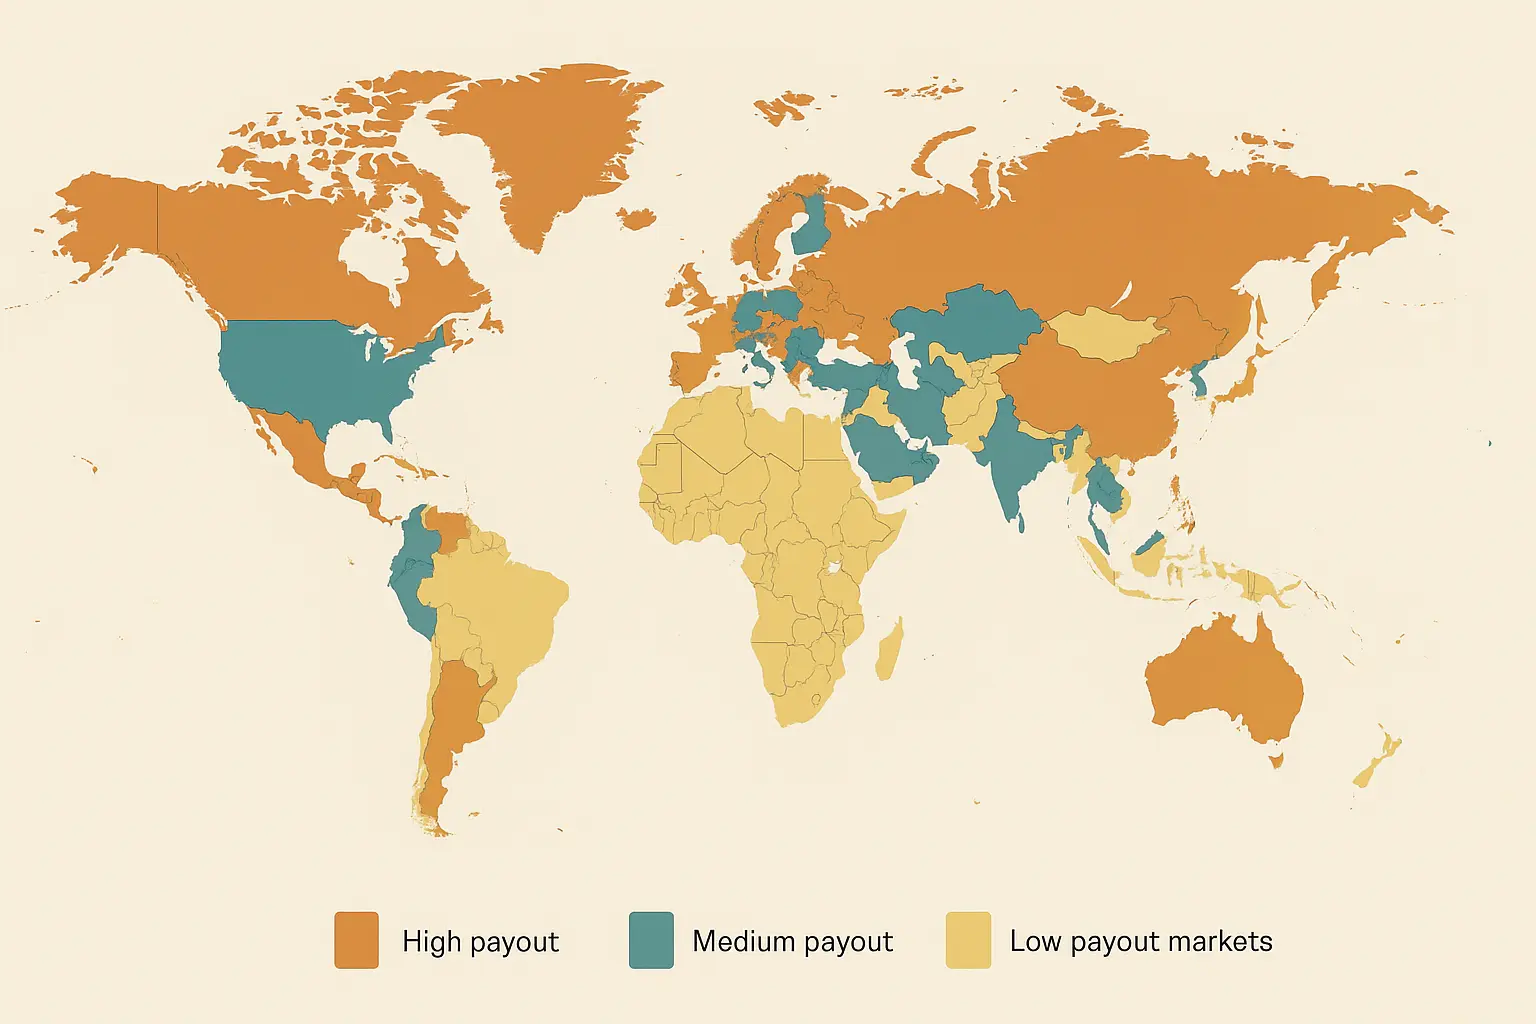
Where your listeners live matters huge – some countries pay 10x more per stream than others
-
Free calculators give you rough guesses, but serious artists need tools that actually help make decisions
-
Independent artists keep 50-85% of streaming money while major label artists often see just 10-20%
-
The real power comes from using these numbers to make smarter choices about your career, not just tracking what you already earned
Understanding Spotify’s Payment Structure
Look, if you’re still thinking Spotify pays you a set amount per stream, you’re leaving money on the table. This misconception costs musicians thousands every year, and honestly, it’s not your fault – the industry loves to keep this stuff confusing.
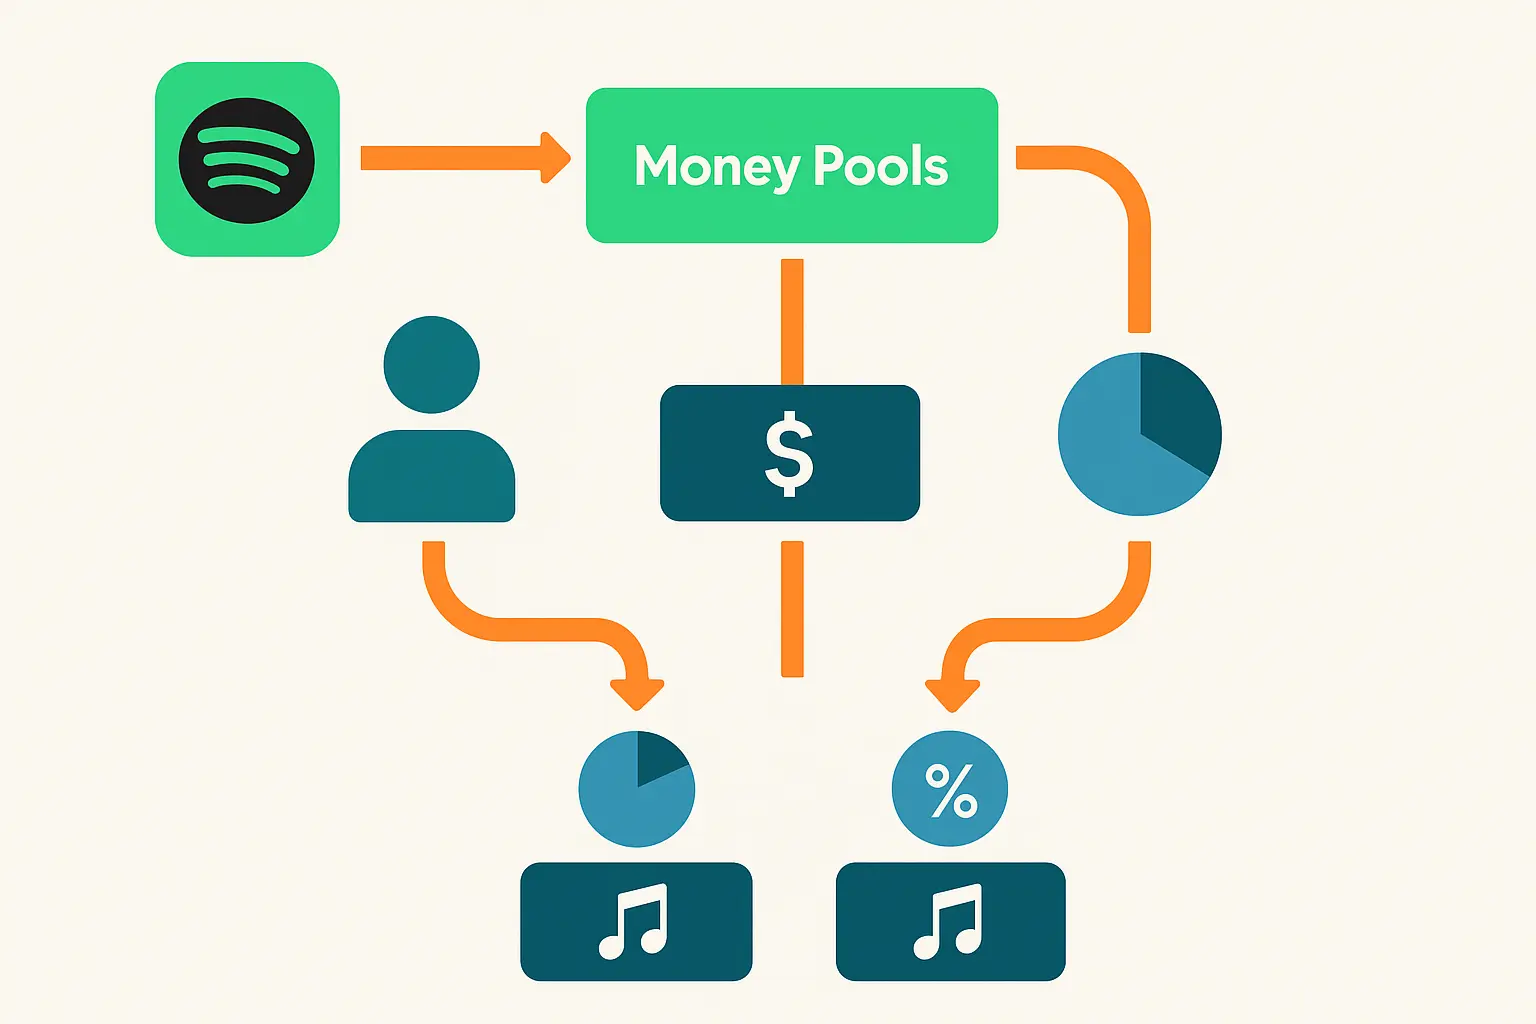
Here’s the deal: Spotify doesn’t have a piggy bank with your name on it. Every month, they throw all their money into one giant pot, then divide it up based on who got the most streams. So when Drake drops an album and dominates the charts, he’s literally taking money out of your pocket – not because he’s evil, but because there’s only so much money to go around.
This means your per-stream rate changes constantly. Some months you might earn more per stream even with fewer total plays. Other months, you’ll get more streams but less money. It’s maddening, but once you understand it, you can actually work with the system instead of against it.
Understanding these complex revenue models requires the same analytical approach used in market sizing for business opportunities, where multiple variables must be considered simultaneously to arrive at accurate projections.
How Your Streams Turn Into Cash
Ever stare at your $12.47 payout from 50,000 streams and wonder where you went wrong? I’ve been there – celebrating what felt like a breakthrough only to see my bank account barely budge.
The brutal truth is your streams don’t translate to dollars with any predictable formula. Instead, Spotify runs this complicated calculation that weighs a bunch of factors you probably never think about.
The streaming landscape got even messier in 2025 when “for a track to produce royalties on Spotify, it must have been played at least 1,000 times over the past year. Spotify announced their royalty changes in 2023 in a bid to help artists earn more by removing micro-payments which they claim never even reach the artists.” This threshold change basically told new artists: “Good luck getting your first payout.”
What Actually Affects Your Per-Stream Rate
Premium subscribers are your best friends. They’re paying Spotify $10+ a month, so Spotify has real money to share with you. Free users? They’re just watching ads, and ad money sucks compared to subscription money. We’re talking about 3-5 times more money per stream from premium users.
Geography is everything, and it’s brutal. A stream from someone in Norway pays you about 6 cents. The same stream from India? Maybe 1 cent. It’s not fair, but it’s reality. Spotify charges different prices in different countries, so you get paid differently too.
Then there’s the total money pool. During months when Spotify makes more money (think holidays when people gift subscriptions), there’s more cash to split up. During slow months, everyone gets less.
Geographic variations are no joke – RouteNote reports that “streams from the US may earn $0.0039 whilst a listen in Portugal can pay $0.0018” – basically, location can nearly double your earnings from the exact same song.
|
Subscriber Type |
Geographic Region |
Per-Stream Rate Range |
Revenue Quality |
|---|---|---|---|
|
Premium |
Nordic Countries |
$0.006 – $0.008 |
Highest |
|
Premium |
US/Canada |
$0.004 – $0.006 |
High |
|
Premium |
Western Europe |
$0.003 – $0.005 |
Medium-High |
|
Premium |
Emerging Markets |
$0.001 – $0.003 |
Medium |
|
Free Tier |
All Markets |
$0.0007 – $0.002 |
Low |
Here’s a real example that’ll make you sick: Two artists both get 100,000 streams. Artist A has mostly premium subscribers from Nordic countries and earns about $480. Artist B has mostly free users from emerging markets and earns roughly $120. Same stream count, same amount of work, but Artist A pays rent while Artist B buys groceries. Quality of listeners matters way more than quantity.
How Spotify Actually Splits Up the Money
Think of Spotify’s money like a giant pizza. Every month, they cut it up based on who got the most slices (streams). When Taylor Swift drops an album, she takes a bigger slice, which means everyone else gets slightly smaller pieces.
Your cut isn’t based on how much your individual listeners paid. It’s based on your share of all streams on the entire platform. If you got 0.001% of all Spotify streams that month, you get 0.001% of the artist revenue pool.
This system is why your per-stream rate bounces around like crazy. During months with massive releases from superstars, your rate drops even if your stream count stays the same. You’re fighting for pieces of the same pizza.
Why Premium vs Free Users Changes Everything
Premium subscribers are worth their weight in gold. A single premium stream can generate 3-5 times more money than a free stream, and here’s why: Premium users pay Spotify real money every month ($9.99+), giving Spotify actual cash to share with you. Free users just watch ads, and ad money is inconsistent and usually terrible.
This means 100,000 streams from premium subscribers in high-paying countries could earn you more than 300,000 streams from free users in lower-paying regions. I know it sounds crazy, but quality beats quantity every single time in streaming.
How the Money Pool Actually Works
The size of Spotify’s revenue pool isn’t constant – it grows and shrinks based on how many people are paying for subscriptions, seasonal patterns, and what’s happening in the global economy. These changes directly hit your payouts.
Once you get how this money pool thing works, you can actually time your releases to hit when there’s more cash floating around. It’s like knowing when the bar has happy hour specials.
Why Where Your Fans Live Matters So Much
Geographic differences in streaming payouts are staggering and honestly pretty depressing. A stream from Switzerland might pay you 10 times more than a stream from a developing market.
This happens because Spotify adjusts subscription prices based on what people can actually afford in each country. Norwegian subscribers pay premium prices, so Norwegian streams generate premium payouts. Countries with cheaper subscriptions contribute way less to the revenue pool.
Smart artists use this reality to focus their hustle. Instead of trying to go viral everywhere (which is exhausting and expensive), they target high-paying markets where each stream actually matters.
Seasonal Changes That Affect Your Paycheck
December is usually the golden month for streaming revenue. Holiday gift subscriptions, people listening more during time off, and higher advertising rates all mean there’s more money in the pot.
Summer can also be good due to increased music consumption during vacations and festival season. But January often sucks because people cancel subscriptions after blowing their money during the holidays.
Timing your releases around these patterns can seriously impact your earnings, even with the same number of streams.
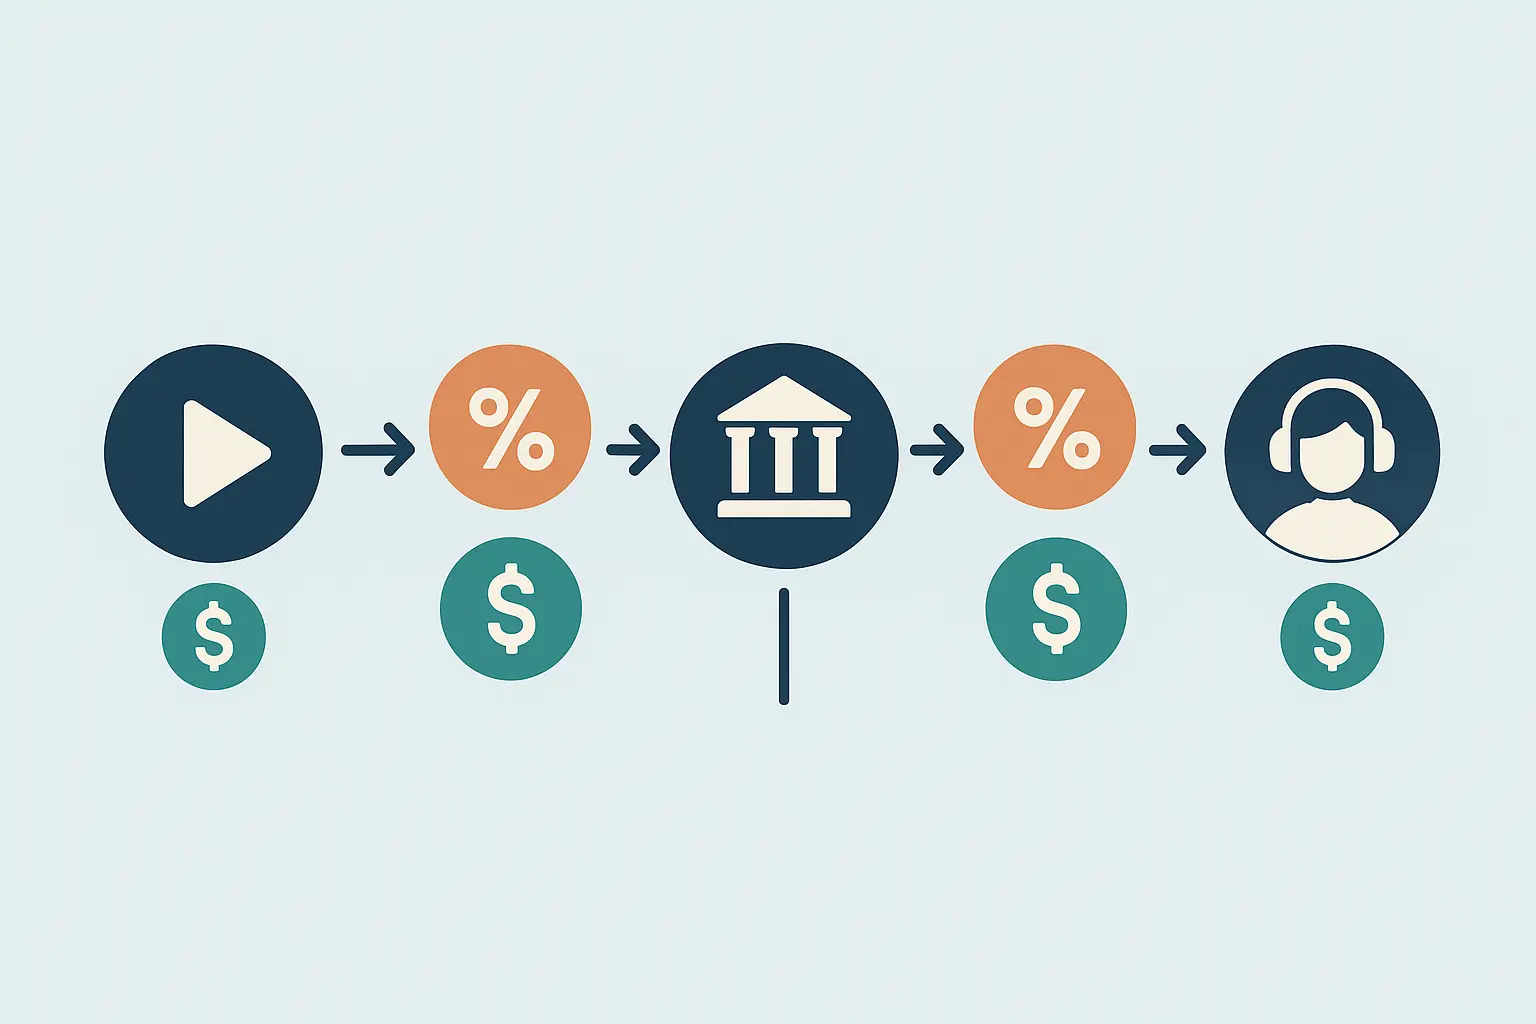
The Chain of People Taking Your Money
Money doesn’t go straight from Spotify to your bank account. It passes through a bunch of middlemen, each taking their cut along the way.
Understanding this chain is crucial because it determines how much of that calculated streaming revenue you actually see. The difference between a good deal and getting screwed can mean keeping 85% versus 15% of your streaming income.
Label Deals vs Going Independent
The difference between label and independent payouts is brutal. Major label artists often see only 10-20% of their streaming revenue after the label takes their cut for advances, marketing, distribution, and profit margins. Yeah, you read that right – they keep 80-90% of your money.
Independent artists using services like DistroKid, CD Baby, or TuneCore typically keep 85-95% of their streaming revenue, only paying small distribution fees. Some artists even keep 100% by handling distribution themselves through Spotify’s direct upload program.
This difference adds up fast. An independent artist earning $1,000 monthly from streams keeps $850-950, while a label artist with the same streams might only see $100-200. The math strongly favors independence if you can handle your own marketing and business stuff.
Would you rather keep 85% of smaller earnings or 15% of potentially larger earnings? That’s the question every artist faces, and honestly, most artists are better off keeping control of their money.
Artist.Tools shows that “1,000,000 streams would be $2380” at the platform level, but after label cuts, major label artists might only receive $238-476 of that amount, while independent artists could keep $2,023-2,261. That’s a massive difference for the same work.
Calculator Tool Categories and Selection
Most streaming calculators are garbage. They’ll tell you that 100K streams equals $300, then you get your actual payout and it’s $87. Here’s how to find tools that actually help instead of just disappointing you.
The key is matching the tool to what you actually need. If you’re just curious about ballpark numbers, basic tools work fine. But if you’re making real business decisions with real money, you need something that won’t lie to you.

Basic Tools That Give You Rough Ideas
Basic calculators serve a purpose, but they’re like using a ruler when you need a measuring tape. They’ll give you a general idea, but don’t bet your rent money on their numbers.
These tools typically just multiply your stream count by some average rate (usually $0.003-0.005) and call it a day. They’re useful for quick “what if” scenarios but miss all the stuff that actually determines your real payouts.
Free Online Calculators
Free calculators are everywhere, and most use the same lazy formula: streams × average rate = your money. Sites like StreamingCalculator.com and random music blog calculators all basically do this.
They assume you’ll get somewhere between $0.003-0.005 per stream, which is a rough average across all the different variables. Fine for answering basic questions like “Could I make a living with a million streams?” (Answer: probably not.)
The problem? They can’t tell you the difference between 100,000 streams from premium Norwegian subscribers versus free users from lower-paying markets. That difference could be $300 versus $70 in your actual bank account.
What to Remember When Using Free Calculators:
-
Input your stream count and note what rate they’re using
-
Remember this is just an average across everything
-
Consider it a baseline, not a promise
-
Factor in your distributor’s cut (usually 10-15%)
-
Account for any label or publishing splits
-
Don’t make major financial decisions based on these numbers
Platform-Specific Tools
Spotify-specific calculators understand the platform’s weird quirks better than generic tools. They know about the pro-rata system and usually use more current data about rate changes.
Tools built by people who actually understand the music industry provide better estimates because they focus on one platform instead of trying to cover everything. They might factor in recent changes to Spotify’s payout structure or seasonal variations that generic tools completely miss.
They’re more accurate than basic calculators but still can’t account for your specific audience demographics.
Multi-Platform Tools
Multi-platform calculators can reveal interesting patterns. You might discover that while Spotify generates more streams, Apple Music pays you better rates for your specific audience. Or that YouTube Music actually performs surprisingly well in certain markets.
The trade-off is accuracy. By trying to cover multiple platforms, these calculators often use more general data and can’t dive deep into any single platform’s specifics.
|
Platform |
Average Per-Stream Rate |
Market Share |
Revenue Quality |
|---|---|---|---|
|
Spotify |
$0.00238 |
31% |
Medium |
|
Apple Music |
$0.01 |
15% |
High |
|
YouTube Music |
$0.008 |
8% |
Medium-High |
|
Amazon Music |
$0.004 |
13% |
Medium |
|
TIDAL |
$0.013 |
1% |
Highest |
Advanced Tools That Actually Help
Advanced platforms turn revenue calculation from guesswork into actual strategy. These tools integrate your real streaming data with market intelligence to give you insights you can actually act on.
The investment in advanced analytics pays off when you’re spending real money on marketing or planning major releases. They help you understand not just what you’re earning, but why you’re earning it and how to earn more.
Similar to how comprehensive SEO content tools provide deeper insights than basic keyword checkers, advanced streaming analytics platforms offer strategic intelligence that basic calculators simply cannot match.
Connecting Your Actual Spotify Data
Connecting your Spotify for Artists account to advanced calculators unlocks personalized insights based on your real audience data. Instead of industry averages that might be totally wrong for your situation, you get calculations based on your actual listeners. This integration reveals patterns specific to your music. Maybe your audience is mostly premium subscribers in high-paying markets, meaning your per-stream rate is way above average. Or perhaps you have a strong following in emerging markets where volume makes up for lower per-stream rates.
The accuracy improvement is huge. Instead of generic estimates that are probably wrong, you get projections based on your actual listener behavior, where they’re from, and what type of accounts they have.
Take Sarah, an indie rock artist from Portland I know. She was pulling her hair out trying to figure out why her 100K streams only earned her $180 last month. When she dug into her Spotify for Artists data, she realized 65% of her streams came from premium subscribers in Germany and the UK, generating $0.0045 per stream on average. This data helped her spend her $2,000 marketing budget on German music blogs and UK playlist curators instead of random worldwide promotion. Result? 40% increase in high-value streams within three months.
Professional Analytics Suites
Professional analytics suites like Chartmetric, Soundcharts, and Music Tomorrow go way beyond just calculating revenue. They provide market intelligence that helps you understand the “why” behind your numbers.
These platforms analyze your performance against competitors, identify trending opportunities, and suggest ways to optimize. They might reveal that your streams spike when you release on Fridays versus Tuesdays, or that certain playlist placements generate higher-value streams.
The monthly cost ($50-200+) makes sense for artists generating significant streaming revenue or those spending real money on marketing. The insights can easily pay for themselves through better decisions.
Building Your Own Calculator
Building your own calculator might sound scary, but it’s often more accurate than generic tools. You can customize it for your specific situation, distribution deals, and audience characteristics.
DIY calculators also help you understand how everything works. When you build the formulas yourself, you develop gut instincts about how different variables affect your revenue.
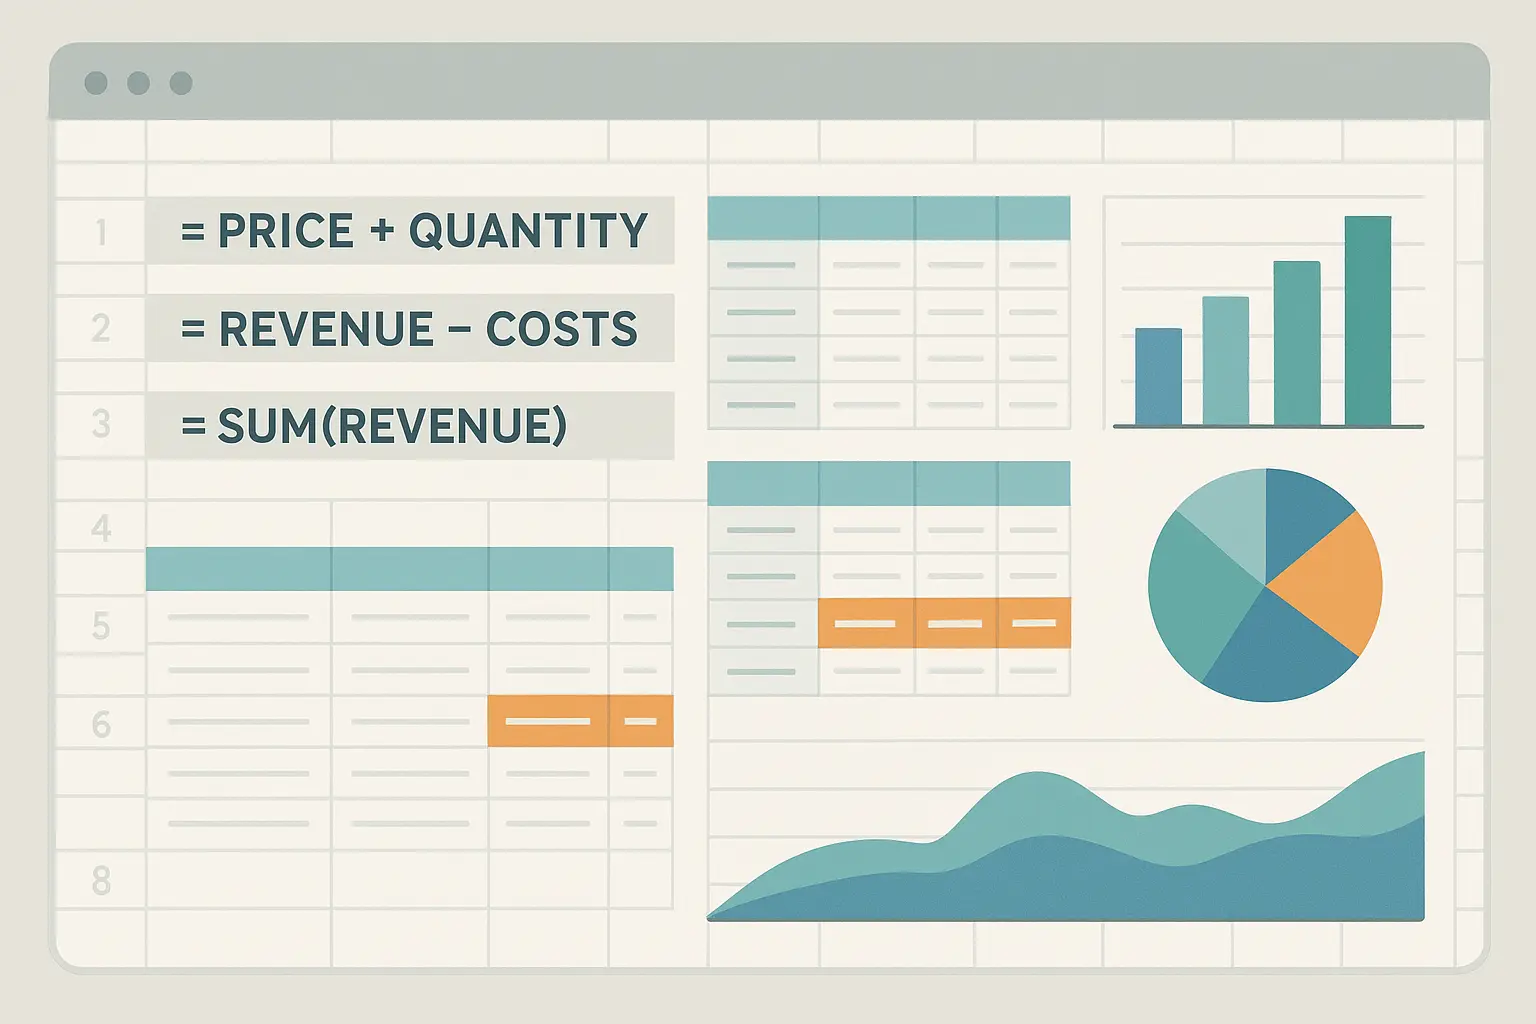
Creating Your Own Spreadsheet
Creating your own spreadsheet calculator starts with understanding your specific variables. You’ll need data on where your listeners are located, what type of accounts they have, and your distribution deal terms.
Start with basic columns: stream count, geographic region, subscriber type (premium/free), and regional payout rates. Then add your specific distribution percentage and any label or publishing splits.
The formula becomes: (Streams × Regional Rate × Subscriber Multiplier × Your Distribution %) = Your Actual Revenue
I’ve built templates that account for seasonal variations, playlist placement bonuses, and even projected growth rates. The initial setup takes a few hours, but you’ll have a tool that grows with your career and adapts to your changing circumstances.
You can find current regional payout data from industry reports and update the rates quarterly based on new information. This keeps your calculator more current than most commercial tools.
With RouteNote’s recent analysis showing that “for many artists, streaming revenue alone isn’t enough to fully support a sustainable music career” and that artists need “a patchwork of income streams: touring, merchandise sales, licensing, and more,” custom calculators become even more valuable for tracking multiple revenue sources alongside streaming income.
Optimization Strategies for Revenue Maximization
Raw numbers are just numbers until you turn them into action. The real value comes from using these insights to make smarter decisions about where to spend your time, money, and creative energy.
My buddy Jake was losing his mind over his streaming numbers. Dude had 200K streams but barely made enough for groceries. Turns out, most of his fans were using free Spotify in countries where streams pay pennies. Once he figured this out, he started targeting his Instagram ads toward premium users in Germany and the UK. Same amount of work, but now he’s actually paying rent with his music.
Targeting Countries That Actually Pay
Geographic targeting completely changed how I think about music marketing. Instead of trying to reach everyone everywhere (which is exhausting and expensive), focus on markets where each stream actually matters.
Calculator data shows you which countries generate your highest per-stream rates. Then you can target your advertising, playlist pitching, and promotional efforts toward those markets.
This approach might reduce your total stream count while increasing your actual revenue. Would you rather have 100,000 streams earning $200 or 80,000 streams earning $400? The choice becomes obvious when you see the real numbers.
Finding Your High-Value Markets
Finding high-value markets goes beyond just looking at per-stream rates. You need to consider how accessible the market is, how much competition there is, and whether your music actually fits the culture.
Nordic countries (Norway, Sweden, Denmark) consistently show high per-stream rates, but they’re also super competitive markets with sophisticated local music scenes. Switzerland and Luxembourg offer excellent rates with potentially less competition.
The key is finding markets where your music connects with people AND generates decent payouts. A stream from Germany might pay well, but if your music doesn’t vibe with German audiences, you’ll struggle to build anything sustainable there.
Research local music blogs, playlists, and radio stations in high-value markets. Understanding the cultural context helps you craft marketing messages that actually resonate with premium subscribers in these regions.
A folk artist I know discovered through calculator analysis that their highest-paying streams came from Canada and Australia. Instead of generic worldwide promotion, they focused their $1,500 marketing budget on Canadian folk radio stations and Australian indie playlists. This targeted approach increased their monthly revenue from $400 to $950 within six months, despite only a 30% increase in total streams.
Timing Your Releases for Maximum Revenue
Timing your releases based on revenue data can increase your earnings by 20-30% without changing anything else about your music or marketing.
Revenue calculators help you identify when the revenue pool is biggest and when premium subscribers are most active. This information guides release dates, playlist submission timing, and when to run your advertising campaigns.
When Premium Subscribers Are Actually Listening
Premium subscribers have different listening habits than free users. They’re more likely to discover new music during specific times: morning commutes, lunch breaks, and evening chill time.
Data shows premium subscribers are most active on Spotify between 7-9 AM and 6-8 PM on weekdays, with longer listening sessions on weekend evenings. They also tend to engage more with new releases on Fridays and Saturdays.
Time your release announcements, social media posts, and playlist pitches around these peak periods to increase your chances of reaching high-value listeners when they’re actively seeking new music.
This doesn’t mean only releasing during peak hours, but rather concentrating your promotional push when premium subscribers are most likely to discover and stream your music.
Analyzing Which Playlists Actually Pay
Some playlist placements generate thousands of low-value streams, while others deliver fewer streams that pay way more.
Calculate the revenue impact of different playlist placements by tracking stream increases and the quality of those streams. A placement on a playlist popular with premium subscribers in high-paying markets might generate 10,000 streams worth $40, while a bigger playlist with free users might deliver 25,000 streams worth $35.
Track which playlists your calculator data shows are most valuable, then focus your pitching efforts there. Go after curators whose playlists consistently deliver high-value streams rather than just high stream counts.
This analysis also helps you evaluate paid playlist promotion services. Many promise huge stream numbers but deliver low-quality traffic from bots that barely moves your revenue needle.
Playlist Evaluation Checklist:
-
Track the ratio of premium vs. free subscribers
-
Monitor where the new streams are coming from geographically
-
Calculate actual revenue per stream from the playlist
-
Compare to your average per-stream rate
-
Look at the curator’s other successful placements
-
Consider whether streams continue after the initial boost
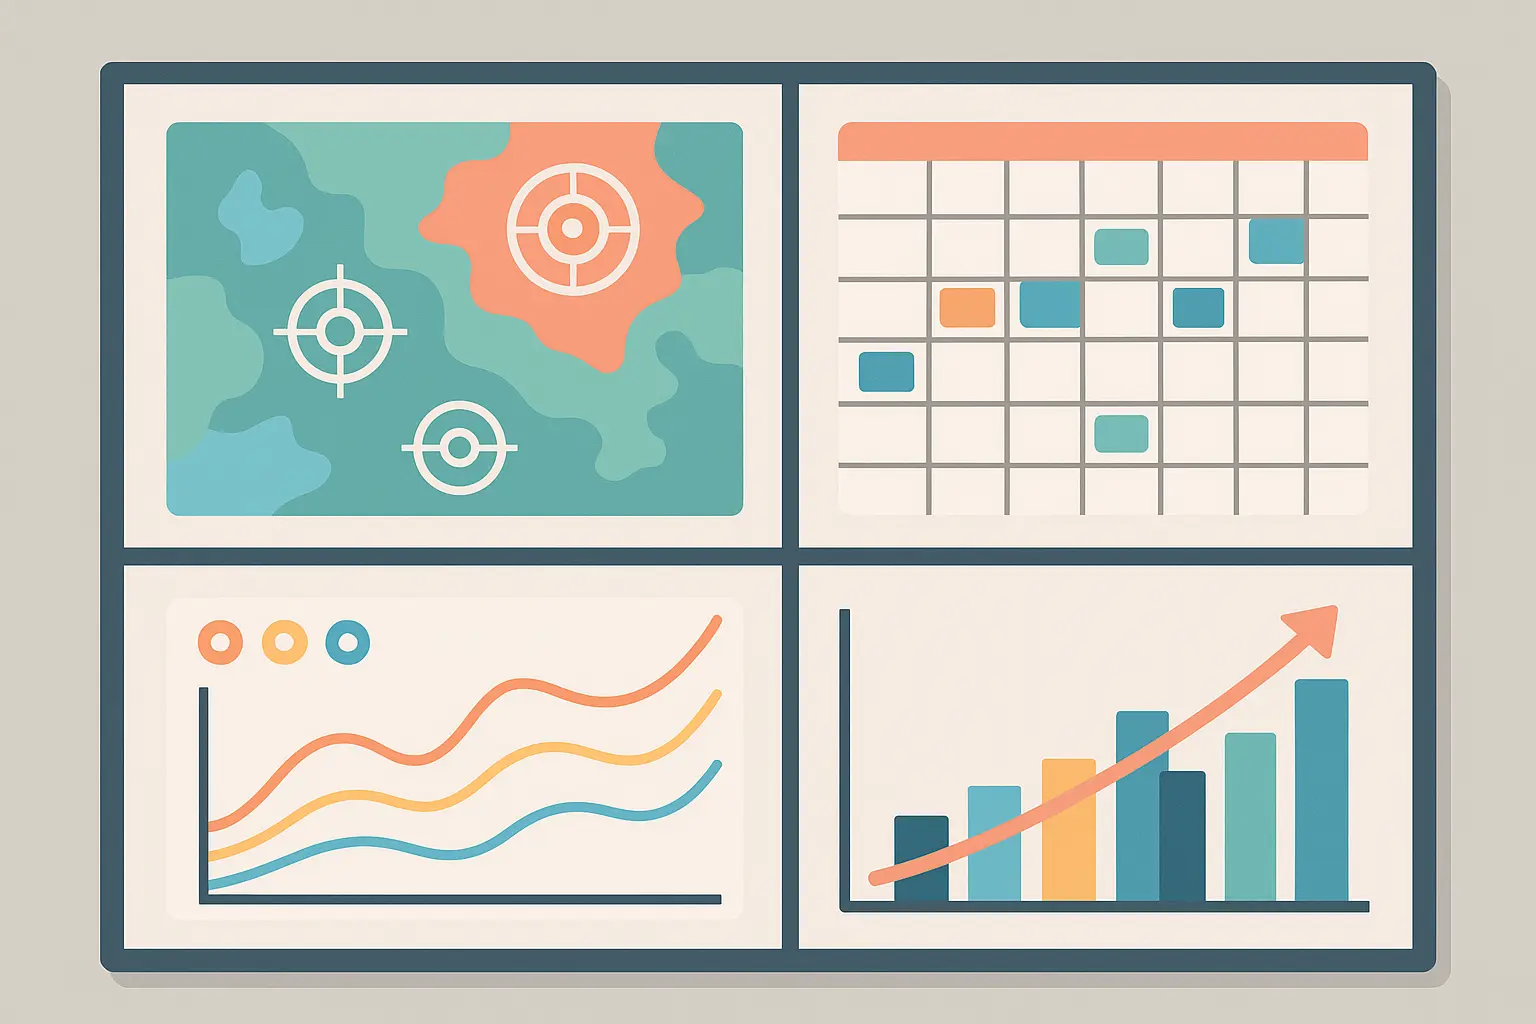
Integration with Business Planning
Revenue calculators reach their full potential when you integrate them into your broader business strategy. They’re not just tracking tools for what already happened – they’re planning tools for future success.
Smart artists use revenue projections to make informed decisions about recording budgets, marketing investments, and career moves. The data helps you separate realistic opportunities from expensive pipe dreams.
Just as retail math principles guide inventory and pricing decisions, streaming revenue calculations should inform every major business decision in your music career.

Financial Planning That Actually Works
Financial forecasting transforms your music career from a series of hopeful guesses into a data-driven business. Revenue calculators provide the foundation for realistic budgeting and investment planning.
Start by analyzing your historical streaming data to identify growth trends, seasonal patterns, and revenue consistency. Use this information to project future earnings and plan your expenses accordingly.
This approach prevents the feast-or-famine cycle that destroys many music careers. Instead of spending windfall months recklessly and struggling during slow periods, you can smooth out your cash flow and make strategic investments.
The forecasting methodology mirrors the approach used in GA4 analytics auditing, where historical data patterns inform future performance predictions and strategic decisions.
Break-Even Math for Your Releases
Before you spend a dime on your next release, do this math: Add up everything you’re spending (recording, mixing, artwork, promotion), then divide by what you actually earn per stream (not the fantasy number, your real number). That’s how many streams you need just to break even. If that number makes you sick to your stomach, maybe rethink your budget.
If your total costs are $2,000 and your average revenue per stream is $0.004, you need 500,000 streams to break even. This number helps you evaluate whether your marketing budget and promotional strategy are realistic or just expensive wishful thinking.
The analysis also reveals which expenses provide the best return on investment. Maybe professional mastering increases your playlist acceptance rate enough to justify the cost, while expensive music videos don’t generate proportional streaming increases.
Use this data to optimize your spending on future releases, focusing budget on elements that demonstrably increase streaming revenue.
Using Streaming Data for Tour Planning
Streaming data provides incredible insights for tour planning. Markets with high streaming revenue often translate to strong live attendance, but the correlation isn’t always direct.
Analyze your streaming revenue by city and region, then cross-reference with venue capacities and ticket prices in those markets. A city generating $500 monthly in streaming revenue might support a 200-capacity show, while a $2,000 streaming market could fill a 1,000-capacity venue.
Factor in travel costs, venue guarantees, and local promotion expenses to determine which markets offer profitable touring opportunities. Sometimes a smaller market with lower streaming numbers but cheaper operating costs provides better net profit than expensive major cities.
This analysis prevents costly touring mistakes and helps you build sustainable live revenue streams that complement your streaming income.
Making Smart Investment Decisions
This framework will save you from blowing your rent money on a playlist placement that promises 50K streams but delivers 5K plays from bots. Trust me, I’ve been there, and it sucks.
Create criteria for different investment types: marketing campaigns must show projected ROI within 6 months, equipment purchases should increase production efficiency or quality measurably, and education investments should lead to quantifiable skill improvements.
For marketing investments, calculate the stream increase needed to justify the cost. A $1,000 advertising campaign needs to generate at least 250,000 additional streams (at $0.004 per stream) to break even, plus additional streams for profit.
This framework helps you say no to opportunities that sound exciting but don’t make financial sense, while identifying investments that compound over time to build sustainable career growth.
Investment Evaluation Framework:
-
Calculate required stream increase for break-even
-
Assess probability of achieving target streams
-
Consider long-term vs. short-term benefits
-
Evaluate opportunity cost against other investments
-
Set measurable success metrics and timeline
-
Plan exit strategy if investment underperforms
This systematic approach to investment decisions parallels the methodology outlined in identifying high-impact content topics, where data-driven analysis guides resource allocation for maximum return.

Final Thoughts
Here’s the thing – streaming won’t make you rich overnight. But understanding how it actually works means you can stop leaving money on the table. Focus on quality listeners over quantity, target countries that actually pay decent rates, and stop chasing vanity metrics that don’t pay your bills.
The real power of revenue calculators comes from using these insights to make smarter decisions about your time, money, and creative energy. Whether you’re using a basic free calculator or investing in advanced analytics platforms, the key is turning data into action that actually improves your financial situation.
Understanding Spotify’s complex payment structure helps you set realistic expectations and identify opportunities for optimization. Geographic targeting, release timing, and audience quality matter way more than raw stream counts when it comes to actual revenue. The difference between earning $100 and $1,000 from the same number of streams often comes down to understanding these nuances that most artists completely ignore.
Integration with business planning transforms revenue calculations from tracking tools into strategic planning instruments. Break-even analysis, tour planning correlation, and investment decision frameworks help you build a sustainable career rather than just chasing viral moments that don’t pay the rent.
The music industry has always been tough, but at least now you can see exactly where your money comes from and why. Use that knowledge to make smarter decisions, not just louder complaints about streaming payouts.
Your music deserves to earn you a living. Now you know how to make that happen.