


Last year, I was bragging to my friend about my “smart” investment portfolio until she asked me one simple question: “What are you actually paying in fees?” I had no clue. That’s when I discovered expense ratio calculators, and honestly, I wish someone had slapped me with this reality check years earlier. I found this crazy stat on Omni Calculator – the average ETF expense ratio is 0.45%, while expense ratios can range as low as 0.045% for funds like SPY and as high as 2.95% for specialized funds like the Global X SuperDividend® Alternatives ETF. Those tiny percentages? I basically ignored them like expired coupons – until I saw what they actually cost me over decades.
Table of Contents
-
Understanding Expense Ratio Fundamentals
-
Expense Ratio Impact Assessment
-
Variable Expense Ratio Calculations
-
Advanced Calculator Applications
TL;DR
-
Expense ratios eat away at your returns annually, ranging from 0.05% for index funds to 2.5% for actively managed funds
-
Small percentage differences compound dramatically over decades – a 1% higher expense ratio can cost you tens of thousands in lost returns (yeah, it’s that brutal)
-
Basic calculators need your investment amount, timeline, and fund expense ratio to show true cost impact
-
Variable expense ratios change based on fund performance or asset levels, requiring some pretty smart math to figure out
-
Advanced calculators help you figure out where to put your money across account types and compare multiple funds simultaneously
-
Tax-efficient calculations factor in whether switching funds justifies potential tax consequences
Understanding Expense Ratio Fundamentals
Getting a handle on expense ratios starts with understanding what you’re actually paying for when you invest in funds and ETFs. These annual fees cover everything from management salaries to administrative costs, and they’re automatically deducted from your returns whether your fund performs well or tanks completely. The key is learning how expense ratio calculators transform these seemingly small percentages into real dollar amounts that’ll make your stomach drop when you see the long-term impact.
Basic Expense Ratio Mechanics
Every mutual fund, ETF, and investment vehicle charges an annual fee expressed as a percentage of your total investment. This expense ratio covers the fund company’s costs for managing your money, from research and trading to customer service and regulatory compliance. Understanding this foundation helps you use expense ratio calculators effectively to see what you’re really paying – and trust me, it’s probably more than you think.
What You’re Actually Paying For
An expense ratio represents the annual fee that gets automatically deducted from your investment returns. When you see a 0.75% expense ratio, that means you’ll pay $7.50 annually for every $1,000 invested. The math is straightforward, but the long-term impact? That’s where things get ugly.
The fee covers management salaries, research costs, trading expenses, administrative overhead, and regulatory compliance. Actively managed funds typically charge more because they employ analysts and portfolio managers who actively buy and sell securities. Index funds charge less since they simply track a benchmark without all the fancy decision-making.
I found this eye-opening insight from Saxo Bank that emphasizes “even a small difference in expense ratios can lead to significant disparities in portfolio performance over time due to compounding.” I wish I’d understood this concept earlier in my investing journey – would’ve saved me a lot of money and probably a few sleepless nights.
How the Math Actually Works
The calculation itself is straightforward: total annual fund operating expenses divided by average net assets, multiplied by 100 to get a percentage. However, an expense ratio calculator does the heavy lifting by showing you the cumulative impact over your investment timeline.
Similar to how businesses use retail math calculations to optimize their profit margins, expense ratio calculators help you optimize your returns by revealing those sneaky hidden costs.
Most calculators use this basic formula structure but add layers of complexity that’ll make your head spin if you think about it too hard. They factor in your specific investment amount, contribution schedule, and time horizon to project total costs. Some advanced versions even account for the compounding effect – basically showing you how the money you lose to fees each year would’ve grown if it stayed invested. (Yeah, it hurts to think about.)
Industry Standards You Should Know
Expense ratios vary dramatically across fund types. Low-cost index funds might charge just 0.05%, while specialized actively managed funds can hit 2.5% or higher. Most mainstream funds fall between 0.5% and 1.5%, but here’s where it gets interesting – knowing these benchmarks can save you serious cash.
I’ve found that knowing these benchmarks helps when using calculators to evaluate funds. If you’re looking at a domestic stock index fund charging 1.2%, that’s probably way too high compared to alternatives charging 0.1% or less. International funds and specialized sectors typically justify higher fees due to increased complexity and research requirements, but don’t let them fool you into thinking all high fees are worth it.
|
Fund Type |
Typical Expense Ratio Range |
What You’re Paying For |
|---|---|---|
|
Index Funds |
0.03% – 0.20% |
Passive tracking, minimal management |
|
Actively Managed Mutual Funds |
0.50% – 1.50% |
Active management, research, analysis |
|
Sector/Specialty ETFs |
0.10% – 0.50% |
Specialized research, niche markets |
|
International Funds |
0.30% – 1.00% |
Foreign market research, currency hedging |
|
Alternative Investment Funds |
1.00% – 2.95% |
Complex strategies, specialized expertise |
Calculator Input Requirements
Accurate expense ratio calculations depend on having the right data points ready before you start. You’ll need your investment details, fund-specific information, and timeline preferences to get meaningful results. Missing or incorrect inputs can dramatically skew your cost projections and lead to some pretty bad investment decisions – been there, done that.
Investment Details You’ll Need
Start with your initial investment amount and any planned regular contributions. Most calculators ask for monthly or annual addition amounts since these significantly impact total fee calculations over time. Your investment timeline matters too – a 10-year horizon versus 30 years produces vastly different cost projections that’ll either make you feel okay or completely sick to your stomach.
Don’t forget about your expected return assumptions. While you can’t predict future performance (if you can, please call me), using historical averages – typically 7-10% for stock funds – helps calculators show how expense ratios reduce your net returns. Some calculators let you run multiple scenarios with different return assumptions, which is pretty handy when you’re trying to plan for different market conditions.
Before you dive in, make sure you’ve got these things handy:
-
☐ Initial investment amount
-
☐ Monthly or annual contribution schedule
-
☐ Investment timeline (years)
-
☐ Fund’s stated expense ratio
-
☐ Expected annual return assumption
-
☐ Additional fees (12b-1, redemption fees)
-
☐ Tax status of account (taxable vs. tax-advantaged)
Fund-Specific Data Points
You’ll need the fund’s stated expense ratio, which you can find in the prospectus or fact sheet. However, some funds have additional fees that aren’t included in the basic expense ratio – and these sneaky little charges can really add up. Look for 12b-1 fees, redemption fees, or performance-based charges that might apply.
Historical performance data helps too, though it’s not always required for basic calculations. Some advanced calculators compare your fund’s performance against benchmarks to show whether higher fees are actually justified by better returns. (Spoiler alert: they usually aren’t.)
Types of Expense Calculations
Different investment vehicles require different calculation approaches, and understanding these variations helps you choose the right calculator for your needs. From straightforward mutual fund calculations to complex multi-fund portfolio analysis, each method serves specific scenarios and provides unique insights into your investment costs. And yes, I know this math is boring as hell, but stick with me – it’s worth it.
Standard Mutual Fund Calculations
Traditional mutual fund expense calculations are the most straightforward, which is probably why I started here when I was figuring all this stuff out. You input your investment amount, the fund’s expense ratio, and your timeline. The calculator multiplies your balance by the expense ratio each year, showing both annual costs and cumulative impact.
These calculators typically assume you’re reinvesting dividends and capital gains, which affects the total amount subject to fees. They also account for the compounding effect – how the money lost to fees each year would’ve grown if it remained invested. The first time I used one of these calculators, I literally said “oh crap” out loud.
Here’s a real example that made me want to cry when I first saw it: investing $50,000 in a mutual fund with a 1.2% expense ratio over 25 years with an expected 8% annual return. The calculator shows you’ll pay approximately $1,800 in fees during the first five years, but by year 25, annual fees alone reach over $4,000 as your account balance grows. Total fees over the 25-year period? Over $85,000. That’s enough to buy a Tesla Model 3.
ETF and Index Fund Variations
ETFs and index funds often have lower expense ratios, but the calculation method remains similar. However, ETFs might have additional trading costs if you’re making frequent purchases, which some calculators factor into total cost analysis.
Index fund calculators sometimes include comparison features showing cost differences between similar funds. Since these funds track the same benchmarks, expense ratios become the primary differentiator in long-term performance. Makes you wonder why anyone would choose the expensive option, right?
Complex Fund Structure Analysis
Some funds have multiple share classes with different expense ratios, and this is where things get complicated fast. Class A shares might have front-end loads but lower ongoing fees, while Class C shares have higher annual expenses but no upfront costs. Advanced calculators help you compare these structures over different time horizons.
Funds with performance fees add another layer of complexity that’ll make your head spin. These charges only apply when the fund exceeds certain benchmarks, making cost projections more difficult. Specialized calculators model different performance scenarios to estimate total costs under various market conditions.
Multi-Fund Portfolio Calculations
When you own multiple funds, you need weighted average expense ratio calculations. These tools factor in each fund’s allocation percentage and expense ratio to determine your portfolio’s overall cost structure. I spent way too many Saturday mornings figuring this stuff out before I found calculators that do it automatically.
Portfolio calculators also help with asset location decisions – determining which funds belong in taxable versus tax-advantaged accounts based on their expense ratios and tax efficiency. This optimization can significantly reduce your total investment costs over time, which is basically free money if you do it right.
Expense Ratio Impact Assessment
The real eye-opener comes when you see how small expense ratio differences compound over decades of investing. Expense ratio impact calculators reveal the hidden cost of fees by showing exactly how much wealth you’re giving up to fund companies over your investment lifetime. These tools transform abstract percentages into concrete dollar amounts that’ll make you question every investment decision you’ve ever made.
Long-Term Cost Projection
Time amplifies the impact of expense ratios exponentially, turning seemingly insignificant percentage differences into massive wealth transfers over decades. Long-term projection calculators reveal how a fund charging 1.5% versus 0.5% can cost you hundreds of thousands in lost returns over a 30-year investment horizon. When I first ran these numbers, I needed more coffee and possibly a drink.
Here’s a real-world example from Omni Calculator that demonstrates just how dramatic these cost differences can be: comparing ARKK ETF (0.75% expense ratio, 30.97% historical return) versus SPY ETF (0.0945% expense ratio, 13.59% return) over 6 years with $10,000 initial investment and $5,000 annual contributions shows total costs of $2,916.27 versus $207.66 respectively. That’s a difference of over $2,700 in just six years.
Compound Effect Modeling
The compound effect of expense ratios is brutal when you see it calculated over decades. A 1% difference in expense ratios doesn’t just cost you 1% annually – it costs you the growth on that 1% every single year for your entire investment timeline. Talk about getting kicked while you’re down.
I’ve used calculators that model this compounding effect, and the results made my stomach drop. On a $100,000 investment over 30 years, the difference between a 0.5% and 1.5% expense ratio can exceed $200,000 in lost wealth. The calculator shows how that extra 1% annually would’ve grown at your assumed rate of return, creating a snowball effect of lost opportunity that just keeps getting bigger.
These models assume you’re reinvesting all dividends and capital gains, which means your fee base grows each year along with your account balance. The calculator compounds both your returns and your costs, showing the true long-term impact of seemingly small percentage differences. It’s like watching a slow-motion train wreck of your money.
Opportunity Cost Analysis
Opportunity cost calculators compare potential returns between high and low expense ratio funds investing in similar assets. They show you exactly what you’re giving up by choosing convenience or brand recognition over cost efficiency.
Just as market sizing calculations help businesses quantify potential opportunities, expense ratio impact calculators quantify the opportunity cost of high fees – and trust me, you won’t like what you see.
The most effective calculators I’ve used display side-by-side projections showing your account balance with different expense ratios. Seeing your potential wealth with a 0.1% expense ratio versus 1.2% makes the cost difference tangible and immediate. It’s like seeing two different versions of your financial future.
Some calculators go further by showing what you could buy with the money lost to higher fees – vacation homes, cars, or additional years of retirement income. This emotional connection to the numbers often motivates better investment decisions more than abstract percentages. We’re talking about a nice vacation home in Florida levels of money here.
Here’s where it gets really depressing: using an opportunity cost calculator, a $250,000 portfolio split between a high-cost actively managed fund (1.4% expense ratio) and a low-cost index fund (0.06% expense ratio) over 20 years shows the high-cost option costs an additional $127,000 in fees. That could fund your kid’s entire college education.
Return Impact Calculations
Expense ratios directly reduce your net returns every single year, and return impact calculators show exactly how this affects your wealth accumulation. These tools adjust your expected returns downward by the expense ratio amount, revealing your true investment performance after accounting for fees. Sound familiar?
Here’s a stat from Saxo Bank that really drove this home for me: “two investors each starting with USD 100,000 and earning a 7% annual return before fees” show dramatic differences after 20 years. Investor A with a 1% expense ratio ends with approximately $320,713, while Investor B with a 0.2% expense ratio reaches $372,756, saving $52,043 through lower costs. That’s more than most people make in a year.
Net Return Adjustments
Net return calculators subtract expense ratios from your gross returns to show actual performance. If your fund earns 8% but charges 1.2% in fees, your net return is 6.8%. Over time, this difference compounds dramatically and will slowly eat away at your wealth. These calculators help you understand that a fund’s reported performance numbers don’t reflect what you actually earn. The fund company reports gross returns before expenses, but you receive net returns after all fees are deducted. This distinction becomes crucial when comparing investment options or planning for retirement income needs – and it’s something I wish someone had explained to me years ago.
Advanced calculators factor in tax implications too. In taxable accounts, you pay taxes on the full dividend and capital gain distributions, even though part of your returns went to pay fund expenses. This creates a double hit that further reduces your net returns. Talk about getting kicked while you’re down.
|
Investment Scenario |
Gross Return |
Expense Ratio |
Net Return |
20-Year Growth on $100K |
|---|---|---|---|---|
|
Low-Cost Index Fund |
8.0% |
0.1% |
7.9% |
$466,096 |
|
Average Mutual Fund |
8.0% |
0.8% |
7.2% |
$414,696 |
|
High-Cost Active Fund |
8.0% |
1.5% |
6.5% |
$353,584 |
|
Premium Active Fund |
8.0% |
2.0% |
6.0% |
$320,714 |
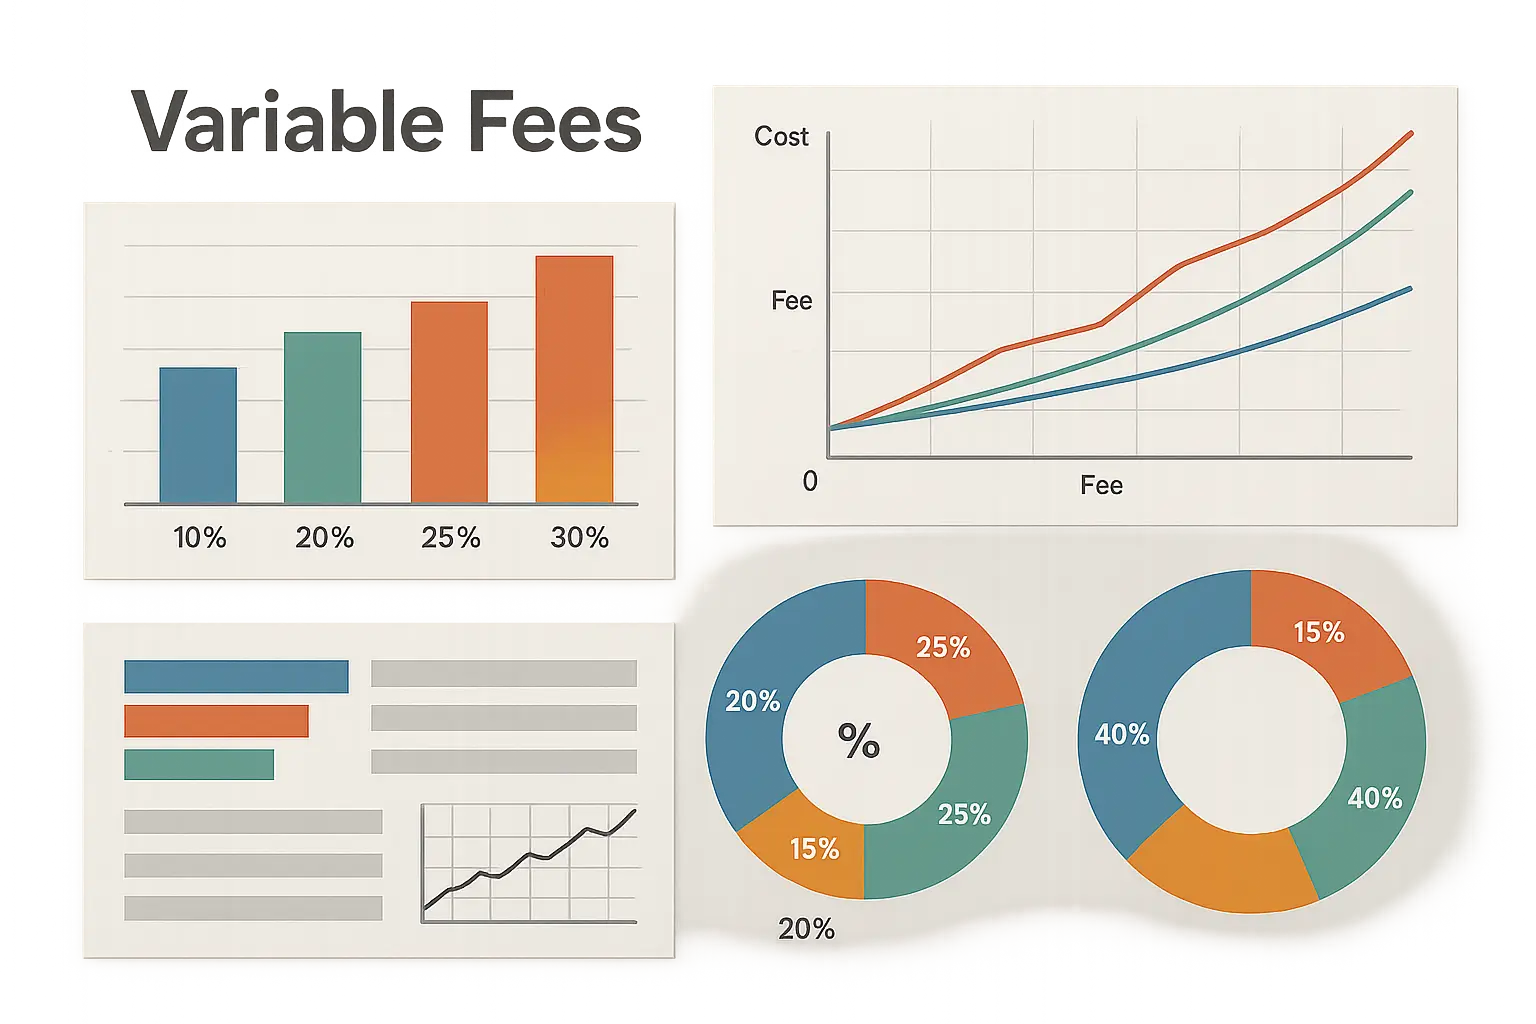
Variable Expense Ratio Calculations
Not all funds charge fixed expense ratios throughout your investment period, and variable expense ratio calculators help you navigate these more complex fee structures. Some funds reduce fees as assets grow, while others add performance-based charges that fluctuate with market conditions. Understanding these variations is crucial for accurate long-term cost projections – and trust me, it gets complicated fast.
Performance-Based Fee Structures
Performance-based fees add complexity to expense calculations since costs vary depending on how well the fund performs relative to benchmarks. These variable structures require specialized calculators that can model different performance scenarios and their impact on your total investment costs over time. (Don’t worry, I’ll explain this in normal person terms.)
Tiered Expense Models
Many funds reduce expense ratios as their assets under management grow, passing some economies of scale to investors. Tiered expense calculators factor in these breakpoints to project how your costs might decrease over time as the fund grows. It’s like getting a bulk discount, but you never know when it’ll kick in.
These calculators typically require assumptions about fund growth rates and your investment timeline. A fund might start at 1.2% for the first $100 million in assets, drop to 1.0% for the next $400 million, and settle at 0.8% above $500 million. Your long-term costs depend on when these breakpoints are reached – if ever.
I’ve found these calculations particularly useful for newer funds or those in niche markets where asset growth is more predictable. The potential fee reductions can make a higher initial expense ratio more palatable if you’re confident in the fund’s growth prospects. But that’s a big “if.”
Performance Fee Integration
Some funds charge additional fees when they exceed certain performance benchmarks. These performance fees might be 10-20% of returns above a specified hurdle rate, creating variable expense ratios that change annually based on market performance. Yeah, it’s as confusing as it sounds.
Calculators for performance-fee funds typically run Monte Carlo simulations or scenario analysis to estimate total costs under different market conditions. They might show best-case, worst-case, and average-case scenarios for total expenses over your investment timeline.
The challenge with these calculations is that performance fees can create significant year-to-year cost variations. A fund might charge 1% in a poor performance year but 2.5% in a strong year, making long-term cost projections more art than science. Here’s where it gets interesting – and expensive.
Here’s a real example that made me question everything: a hedge fund-style mutual fund charges a 1.5% base fee plus 20% of returns above 8% annually. Using a performance fee calculator, if the fund returns 12% in year one, your total expense ratio becomes 2.3% (1.5% base + 0.8% performance fee). In a year with 6% returns, you pay only the 1.5% base fee, creating unpredictable annual costs that’ll keep you guessing.
Dynamic Calculation Methods
Advanced calculators adjust expense ratios based on changing fund characteristics or market conditions. They might factor in asset flows, performance trends, or regulatory changes that could affect future fee structures. (This is where I usually need more coffee.)
These dynamic models often incorporate probability distributions for various outcomes rather than fixed assumptions. They might show that your expense ratio has a 70% chance of staying below 1.5% but a 30% chance of exceeding 2% based on historical patterns and fund characteristics.
Scenario Planning Tools
Scenario planning calculators help you prepare for different expense ratio outcomes by modeling various market conditions and fund performance levels. These tools are essential when evaluating funds with variable fee structures or when trying to understand how different market environments might affect your investment costs. Been there?
Best and Worst Case Modeling
Scenario calculators run multiple projections showing expense impacts under various market conditions. They might model bull markets, bear markets, and sideways markets to show how performance-based fees or tiered structures affect your total costs.
The most useful scenario tools I’ve encountered show probability-weighted outcomes rather than just extreme cases. They might indicate that you have a 60% chance of paying between 1.0% and 1.3% annually, with smaller probabilities of higher or lower costs based on historical patterns.
These models help with investment decision-making by showing the range of possible outcomes rather than single-point estimates. You can evaluate whether the potential for lower fees in good scenarios justifies the risk of higher fees in poor scenarios. Makes you wonder what else you’re missing, right?
Before you dive into variable expense ratio planning, make sure you’ve got these covered:
-
☐ Identify all fee components (base, performance, tiered)
-
☐ Understand breakpoint thresholds
-
☐ Model different performance scenarios
-
☐ Calculate probability-weighted average costs
-
☐ Compare against fixed-fee alternatives
-
☐ Factor in fund growth projections
-
☐ Review historical fee variations

Advanced Calculator Applications
Sophisticated expense ratio calculators go beyond basic cost calculations to help optimize your entire investment strategy. These advanced tools integrate expense analysis with portfolio allocation, tax planning, and account optimization to minimize your total investment costs while maximizing after-tax returns across all your accounts. Now, here’s the part that’ll really get you excited about saving money.
Portfolio Optimization Strategies
Portfolio optimization calculators use expense ratio data alongside other factors to determine the most cost-effective allocation across your investment accounts. These tools help you place the right funds in the right account types while maintaining your desired asset allocation and minimizing total investment costs. After making pretty much every mistake possible, I can tell you this stuff actually works.
Asset Location Planning
Asset location calculators determine optimal fund placement across taxable and tax-advantaged accounts based on expense ratios, tax efficiency, and expected returns. They might recommend holding tax-inefficient, high-expense-ratio funds in IRAs while keeping low-cost, tax-efficient index funds in taxable accounts.
Similar to how GA4 audits help optimize data tracking across different platforms, asset location planning optimizes fund placement across account types – and the results can be pretty impressive.
These calculators factor in the tax deductibility of expenses in different account types. In taxable accounts, you can’t deduct fund expenses, but in some retirement accounts, the tax-deferred growth might offset higher expense ratios. The optimal placement depends on your tax bracket, investment timeline, and available fund options.
I’ve used calculators that model different asset location strategies over 20-30 year periods, showing how proper fund placement can add thousands to your after-tax wealth even when total expense ratios remain the same. It’s basically free money if you do it right.
According to Carroll Advisory, their expense ratio calculator automatically fetches expense ratios for ETFs and mutual funds when you enter the investment symbol, then displays your portfolio’s weighted expense ratio to provide a comprehensive view of all fees impacting your investments. Pretty handy when you’re trying to see the big picture.
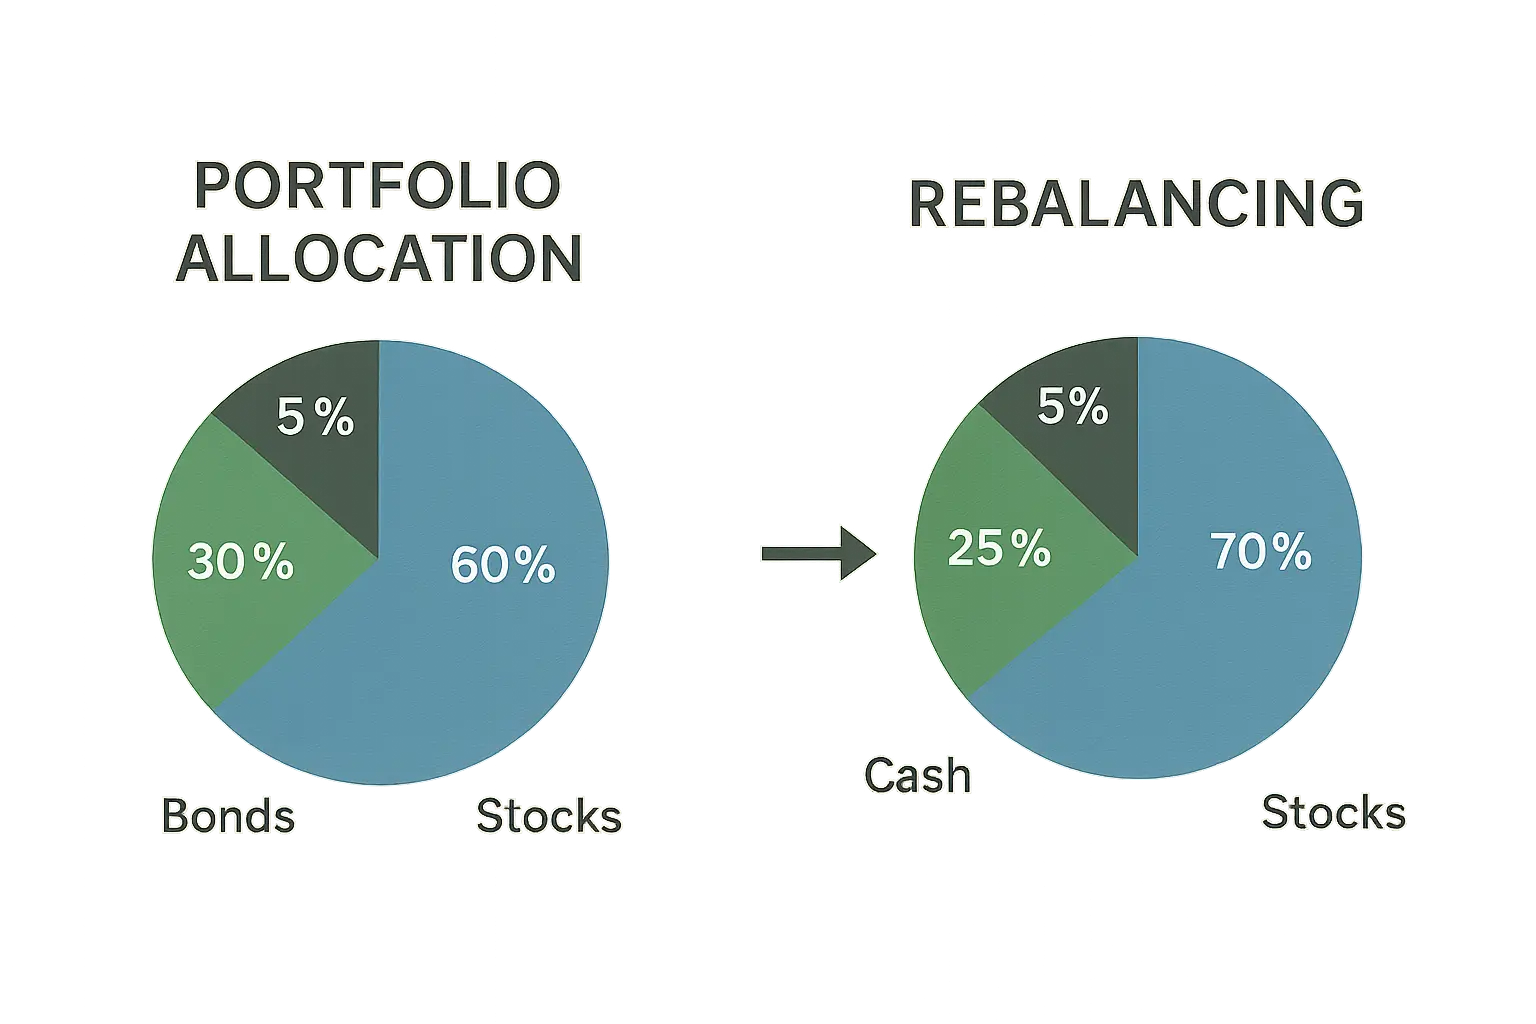
Rebalancing Cost Analysis
Rebalancing calculators factor expense ratios into portfolio maintenance decisions. They help determine whether the benefits of rebalancing outweigh the ongoing costs of higher expense ratio funds you might need to purchase.
These tools are particularly useful when your target allocation requires funds with different expense ratios. The calculator might show that maintaining precise allocation percentages isn’t worth the additional costs if it requires frequent purchases of high-expense-ratio funds.
Advanced rebalancing calculators also consider tax consequences and trading costs alongside expense ratios to determine optimal rebalancing frequencies and thresholds. It took me embarrassingly long to figure out that perfect allocation isn’t always worth the cost.
Tax-Efficient Calculations
Tax-efficient calculators integrate expense ratio analysis with tax planning to maximize your after-tax returns. These tools help determine when switching to lower-cost funds justifies potential tax consequences and how to optimize fund selection across different account types based on their tax treatment.
Tax-Loss Harvesting Integration
Tax-loss harvesting calculators determine whether switching to lower expense ratio funds justifies the tax consequences of selling existing positions. They factor in current unrealized gains or losses, your tax bracket, and the long-term savings from reduced expense ratios.
These calculations become complex when you have significant unrealized gains in high-expense-ratio funds. The calculator might show that paying taxes now to switch to a fund with 0.8% lower expenses will save money over a 15-year timeline, but not over 5 years. (Yeah, I had to look this up too.)
Some calculators also factor in the wash sale rule and suggest alternative low-cost funds that track similar but not identical benchmarks to avoid tax complications while still reducing ongoing expenses.
Retirement Account Optimization
Retirement account calculators help determine optimal fund selection for 401(k), IRA, and other tax-advantaged accounts based on available options and their expense ratios. They’re particularly useful when your employer’s 401(k) has limited, high-cost options – which is unfortunately pretty common.
These tools might recommend contributing enough to get the full employer match despite high expense ratios, then directing additional retirement savings to IRAs with better fund options. They calculate the break-even point where employer matching overcomes high expense ratios.
For those with access to institutional share classes in retirement plans, these calculators show the long-term value of these lower-cost options compared to retail versions of the same funds in taxable accounts. My biggest “aha” moment was realizing how much this difference actually mattered.

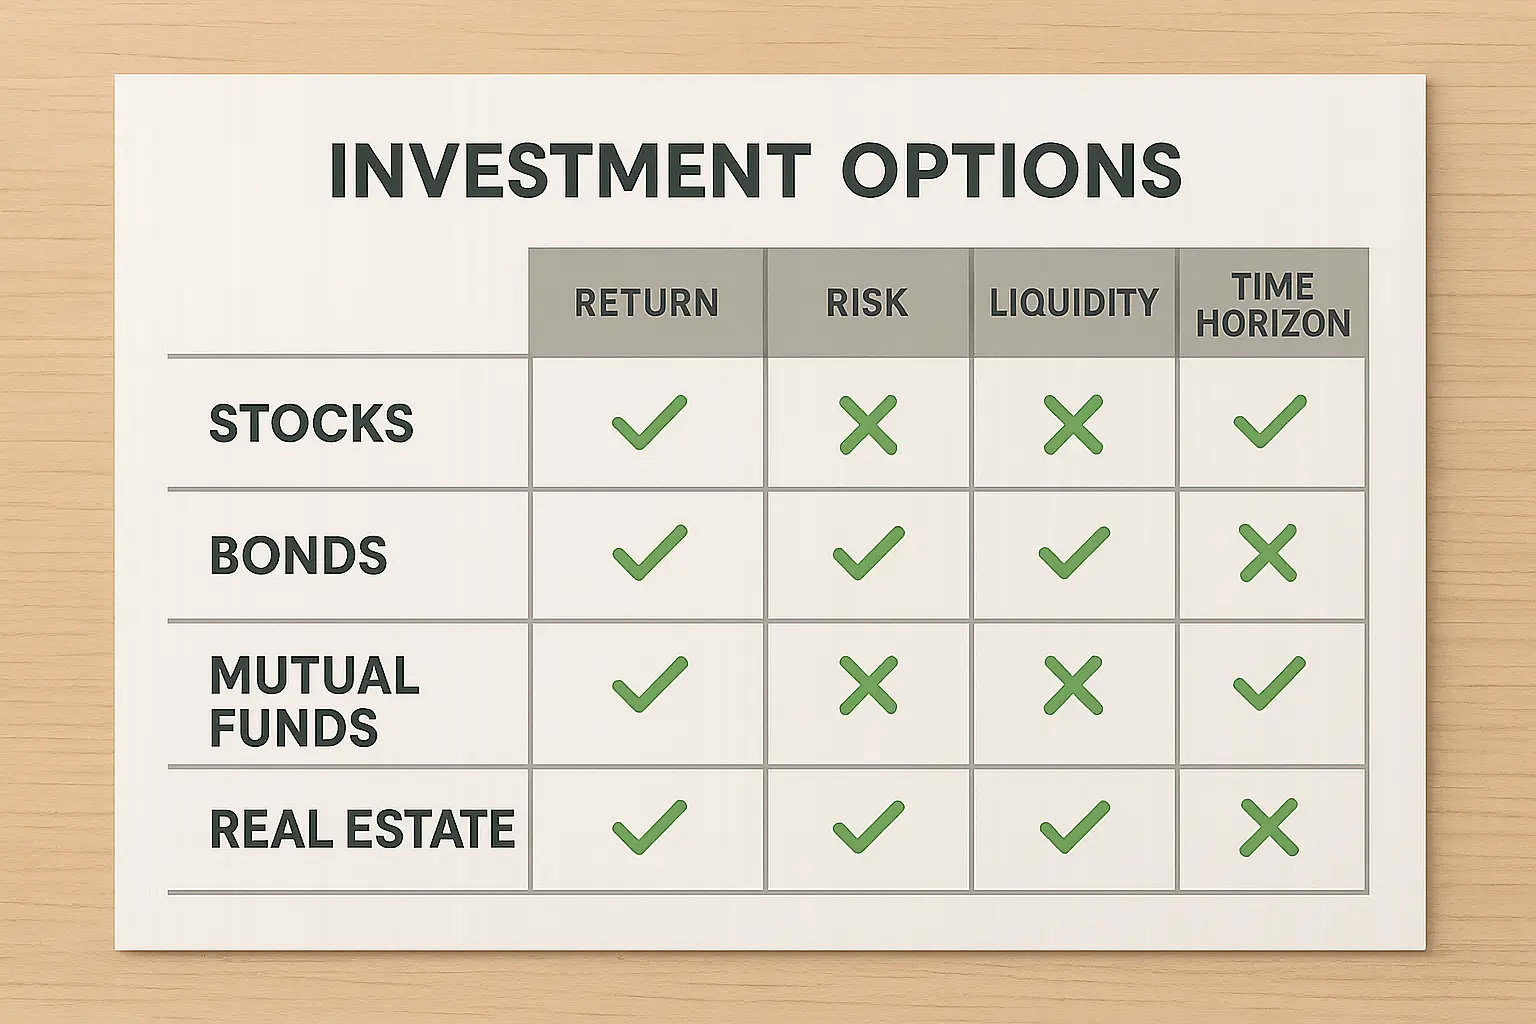
Comparative Analysis Tools
Comparative analysis calculators evaluate multiple investment options simultaneously, showing side-by-side expense ratio impacts and helping you make informed decisions between similar funds. These tools are essential when choosing between funds with different fee structures, performance histories, and investment approaches.
Side-by-Side Fund Comparison
Multi-fund comparison calculators run parallel calculations showing expense ratio impacts across different fund options investing in similar assets. They display projected account balances, total fees paid, and net returns for each option over your specified timeline.
Just as tool comparisons help marketers choose the best analytics platform, fund comparison calculators help you select optimal investment vehicles – and the differences can be staggering.
The most effective comparison tools I’ve used include performance adjustments alongside expense ratios. They might show that a fund with a 0.3% higher expense ratio has historically delivered 0.5% better annual returns, making the higher fees potentially worthwhile despite higher costs. But wait, there’s more bad news…
These calculators often include breakeven analysis showing how long a higher-cost fund would need to outperform to justify its additional expenses. They might reveal that a 1.2% expense ratio fund needs to beat a 0.2% alternative by at least 1% annually just to break even after fees. Spoiler alert: that rarely happens.
Advanced comparison tools factor in risk-adjusted returns using metrics like Sharpe ratios to determine whether higher fees correlate with better risk management or simply reduce net returns without additional value. I’m no math genius, but even I could see the patterns here.
Here’s how to pick the right advanced calculator for your needs:
-
Basic Needs: Single fund expense calculation
-
Intermediate Needs: Multi-fund portfolio analysis
-
Advanced Needs: Tax optimization and asset location
-
Professional Needs: Risk-adjusted performance comparison
-
Features to Look For: Automatic data fetching, scenario modeling, tax integration
-
Red Flags: Hidden fees not included, outdated expense ratios, limited customization
Final Thoughts
Look, I get it. This isn’t the most exciting topic in the world. But after seeing how much money I was basically lighting on fire with high fees, I became that annoying friend who won’t shut up about expense ratios. Trust me, your future self will thank you for paying attention to this stuff now.
Expense ratio calculators transform abstract percentages into concrete dollar amounts that reveal the true cost of investing. The difference between a 0.5% and 1.5% expense ratio might seem trivial, but over decades of investing, it can cost you hundreds of thousands in lost wealth. These tools eliminate the guesswork by showing exactly what you’re paying and what you’re giving up in potential returns.
The most valuable insight from using these calculators isn’t just seeing your costs – it’s understanding how small decisions compound over time. Choosing low-cost index funds over actively managed alternatives, optimizing fund placement across account types, and regularly reviewing expense ratios can dramatically improve your long-term investment outcomes without requiring any additional risk or market timing skills.
Whether you’re evaluating a single fund or optimizing an entire portfolio across multiple accounts, expense ratio calculators provide the data you need to make informed decisions. The key is using them consistently and factoring their insights into your overall investment strategy rather than treating them as one-time analysis tools. After making this mistake for way too long, I can tell you it’s worth the effort to get this right from the start.
