
Last month, I watched a client burn through $15,000 in Facebook ads because they used a “free marketing calculator” that told them to spend 20% of revenue on social media. The problem? They were a B2B software company selling to CTOs – not exactly Facebook’s sweet spot.
Look, I get it. You’ve probably Googled “marketing budget calculator” at 2 AM, desperate for someone to just tell you how much to spend on Google Ads. Been there. The reality is that most businesses are making critical mistakes in both calculator selection and budget allocation, leading to wasted resources and missed opportunities.
I’m going to show you why choosing the right marketing budget calculator matters more than the calculations themselves. We’ll dive deep into what actually works, what doesn’t, and how to avoid the expensive mistakes I see businesses make every day.
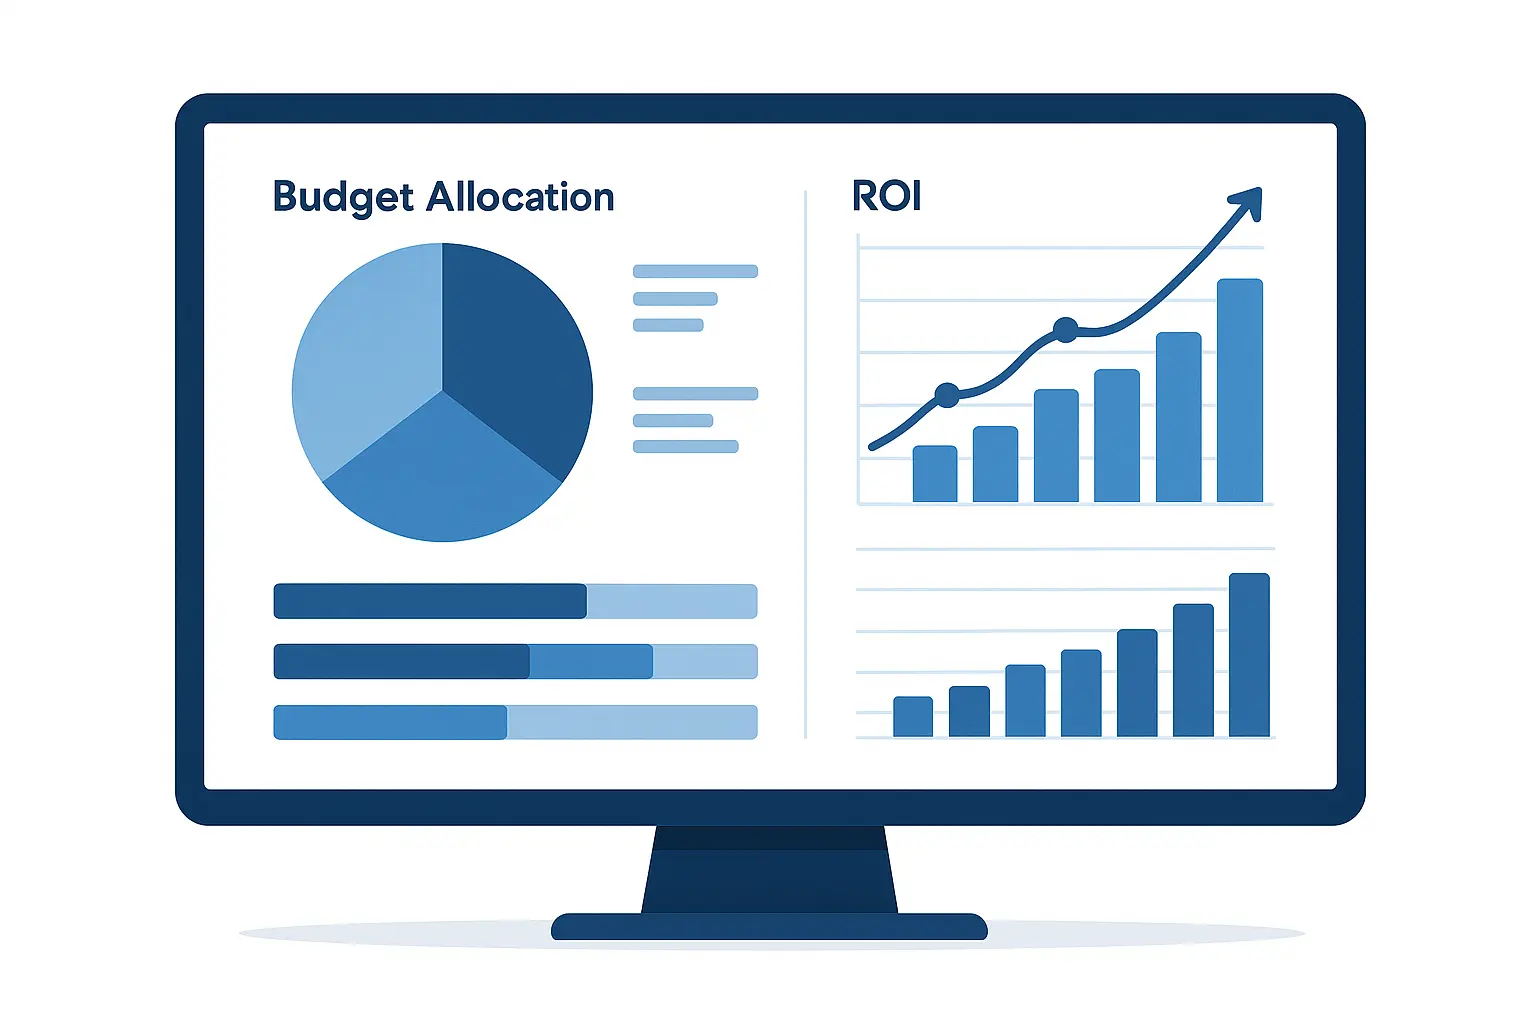
Table of Contents
-
Understanding Marketing Budget Calculators and Their Core Components
-
Free vs. Premium Calculator Options: What You Actually Get
-
Advertising Calculator Specialization for Paid Media Success
-
Strategic Integration and ROI Measurement That Actually Works
-
How The Marketing Agency Solves Calculator Limitations
-
Final Thoughts
TL;DR
-
Marketing budget calculators help stop you from throwing money at the wall, but most businesses pick the wrong type for their needs
-
Free calculators give you basic ballpark numbers but can’t handle the messy reality of attribution and customization
-
Premium tools provide the sophisticated tracking and integration that’s worth the investment if you’re spending serious money
-
Different advertising platforms need different approaches – what works for Google Ads won’t work for TikTok
-
The best budget allocation connects to actual business goals and adjusts based on what’s really happening, not just what you hoped would happen
-
The Marketing Agency’s approach fixes calculator limitations by combining AI insights with human strategy and ongoing optimization
Understanding Marketing Budget Calculators and Their Core Components
Look, here’s the thing about marketing budget calculators – they’re not magic. I’ve seen too many business owners treat them like some kind of crystal ball that’ll solve all their marketing problems. They won’t. But when you use them right, they can save you from making expensive mistakes.
Think of these tools like GPS for your marketing budget. They won’t drive the car for you, but they’ll keep you from ending up in the wrong neighborhood with an empty gas tank.
The reality is, most calculators are processing the same basic stuff: how much money you make, how much it costs to get a customer, and what those customers are worth over time. Sounds simple, right? It’s not. Because garbage in, garbage out is the law of the land here.
I recently worked with a client who was convinced their marketing budget should be 25% of revenue because some calculator told them so. Turns out they were comparing themselves to e-commerce businesses when they were actually a B2B consulting firm. Completely different animals.
According to HowToSaaS research, smaller companies are spending larger proportions on marketing. The companies spending the highest proportion of their budget or revenue on marketing are the smaller companies within this survey — those with under $100 million in revenue and fewer than 500 employees. This makes sense – when you’re trying to grow fast, you need to invest heavily in getting noticed.
When you’re thinking about budget allocation, you should also consider market sizing methodologies to make sure you’re not planning to capture 90% of a market that doesn’t exist.
What Actually Goes Into These Things
Your calculator is only as good as the numbers you feed it. And most people are feeding it terrible numbers.
Revenue targets are where most people mess up first. I can’t tell you how many times someone’s told me they want to “double revenue next year” without any real plan for how that’s supposed to happen. Your calculator needs realistic numbers, not wishful thinking.
Customer acquisition cost is another place where people get creative with math. “Well, if we don’t count the time I spend on sales calls…” Stop right there. Count everything. Your real CAC is probably higher than you think.
Customer lifetime value is where people really go off the rails. Everyone’s an optimist when it comes to how long customers will stick around. Use actual data, not what you hope will happen.
Here’s what I tell my clients: spend a week tracking where your customers actually come from and how much you actually spend to get them. The numbers might hurt, but at least they’ll be real.
The Numbers That Actually Matter
Modern calculators need three categories of real data, not the fantasy numbers most people plug in:
Revenue and Growth Reality Check
-
What you actually made last year (not what you told your investors)
-
Growth targets that don’t require a miracle
-
Seasonal ups and downs (retail businesses, I’m looking at you)
-
Historical data that shows patterns, not cherry-picked good months
Customer Economics – The Brutal Truth
-
Real customer acquisition cost (including your time, your team’s time, everything)
-
Actual customer lifetime value based on how long people really stick around
-
Average order value that accounts for returns and refunds
-
Retention rates based on customers who actually pay, not just sign up
What Your Competition Is Really Doing
-
Industry benchmarks from reliable sources, not blog posts
-
Competitor spending patterns (if you can figure them out)
-
Market share goals that make sense
-
Where you actually fit in the competitive landscape
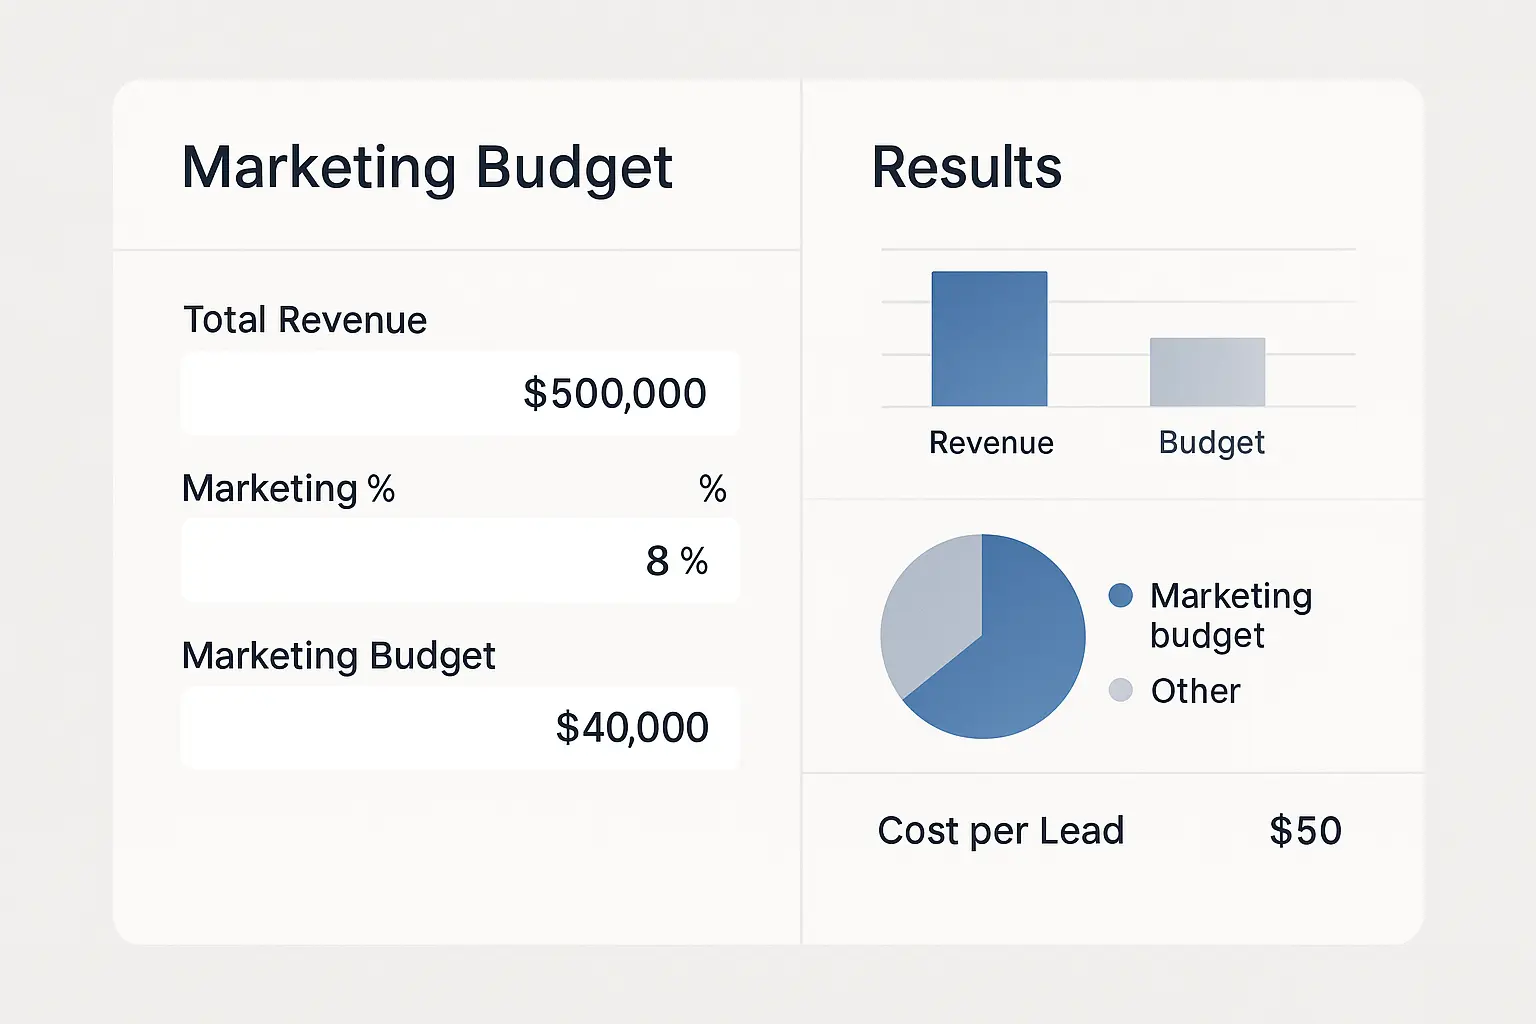
Take Sarah’s HR software startup. She had $200K to spend and was terrified of wasting it. The generic calculator told her to spend 15% of her $500K revenue target on marketing – about $75K. But when we dug into her real numbers, her CAC was $800, her CLV was $12,000, and she needed 50 new customers to hit her goals. That meant she actually needed $40K for customer acquisition, with the rest going to retention and expansion. Big difference.
Input Variables That Drive Accurate Results
The accuracy of your budget allocation depends on how honest you are about these inputs. Most businesses lie to themselves about at least two of these numbers.
Revenue targets should be based on what you can actually achieve, not what would make you happy. I recommend using conservative projections – it’s better to exceed expectations than explain why you fell short to your investors or your spouse.
Customer acquisition costs vary dramatically, and most people underestimate them. B2B software companies might spend $500+ to acquire a customer, while e-commerce businesses might target $50 or less. But here’s the thing – your industry average doesn’t matter. Your actual cost does.
Lifetime value calculations get tricky because you’re predicting the future. Focus on actual retention data rather than what you think will happen. Most businesses overestimate CLV by 50-100% and wonder why their marketing doesn’t pay off.
|
Business Type |
Typical CAC Range |
Average CLV |
Recommended Marketing Spend |
|---|---|---|---|
|
B2B SaaS |
$500-$2,500 |
$15,000-$50,000 |
8-15% of revenue |
|
E-commerce |
$25-$150 |
$200-$1,000 |
10-20% of revenue |
|
Professional Services |
$200-$800 |
$5,000-$25,000 |
6-12% of revenue |
|
Manufacturing |
$1,000-$5,000 |
$25,000-$100,000 |
5-10% of revenue |
The Math Behind the Magic
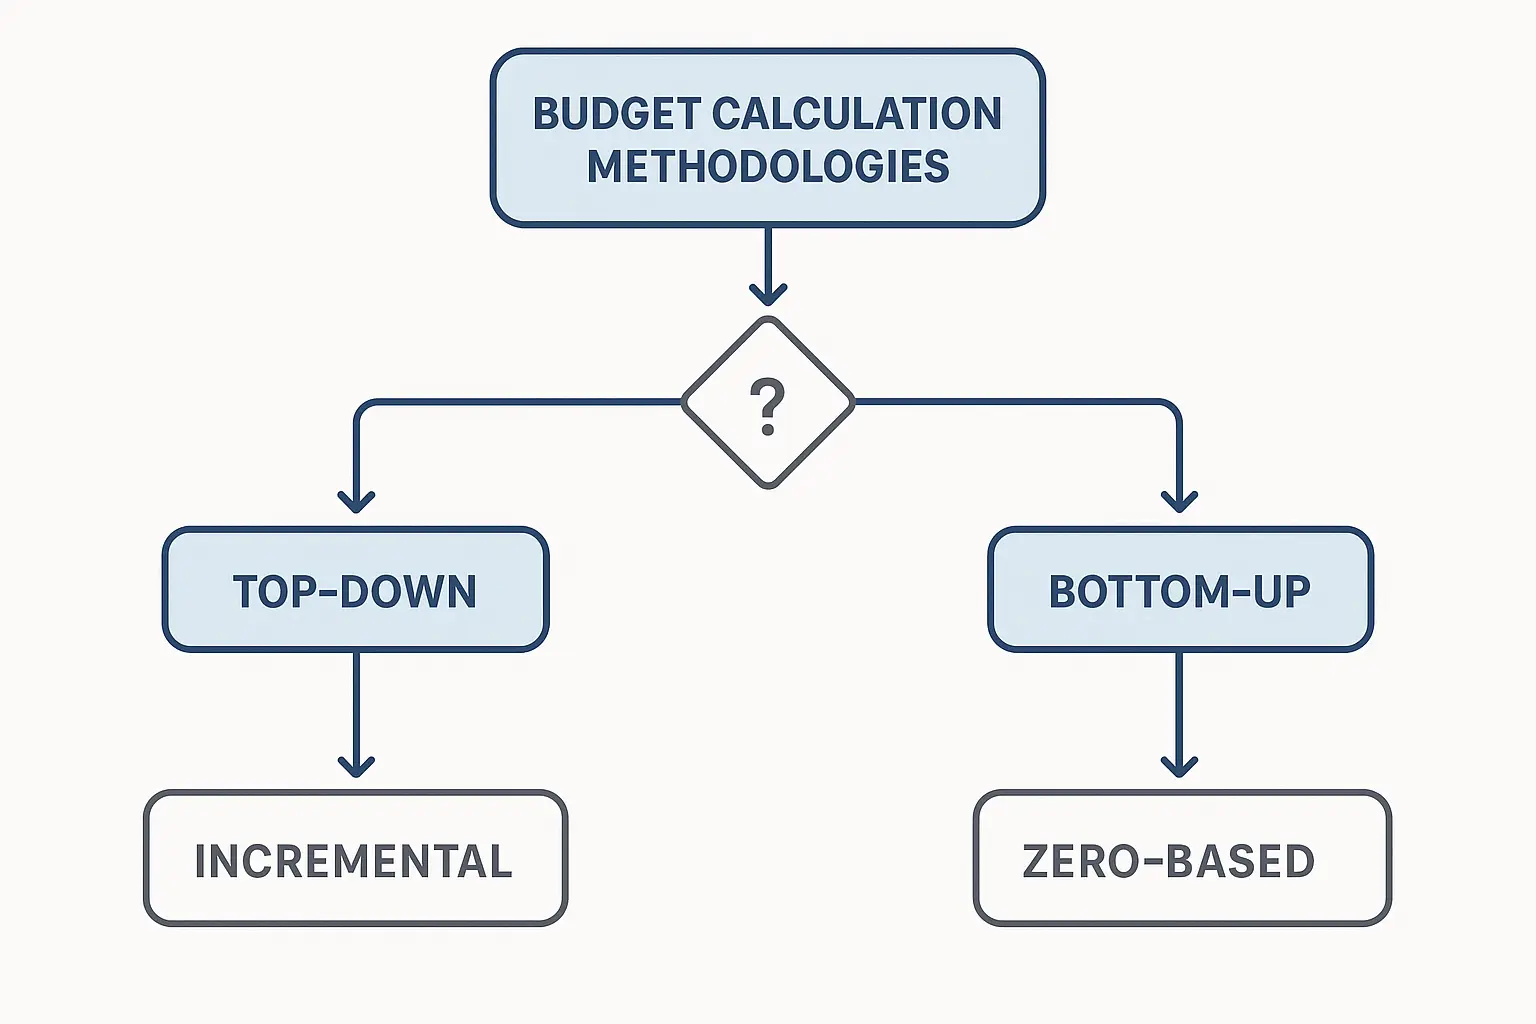
These calculators use different approaches, and understanding them helps you pick the right one for your situation.
The percentage-of-revenue method is the most common. “Spend 5-10% of revenue on marketing.” It’s also often wrong. A startup burning through investor cash might need to spend 30%. A mature business in a stable market might only need 3%.
The objective-and-task method works backwards from what you want to achieve. Want 100 new customers? Figure out what it costs to get them and work from there. This takes more effort but gives you better results.
Competitive parity basically means “spend what the other guys spend.” This can work if you know what your competitors are actually spending and if you’re trying to maintain market share rather than grow it.
Here’s what nobody tells you: your first three months of data will probably be garbage. Your conversion tracking will be broken. Your attribution will be wrong. And that’s totally normal. The key is starting with something reasonable and adjusting as you get better data.
Making Sense of What Comes Out
Getting the numbers is one thing. Knowing what to do with them is another.
Good calculators don’t just tell you to spend $10K on digital marketing. They break it down: $4K on Google Ads, $3K on Facebook, $2K on content, $1K on email. That’s actionable.
ROI projections should pass the smell test. If a calculator promises 500% returns across the board, find a different calculator. Most businesses see 200-300% ROI on their best channels, and that’s after they’ve figured out what they’re doing.
Scenario planning is where premium calculators earn their keep. What happens if you cut the budget in half? What if you double it? These “what if” scenarios help you make better decisions when budgets get tight or opportunities arise.
The biggest mistake I see? People obsessing over their cost-per-click when their landing page converts at 0.3%. It’s like worrying about the price of gas when your car has three flat tires.
Digital Marketing Budget Optimization Strategies
Digital marketing calculators are different beasts entirely. They have to deal with real-time data, multiple touchpoints, and the fact that customers bounce around between channels like pinballs.
The good news? Digital channels give you way more data to work with. The bad news? Most people drown in that data and make worse decisions because of it.
I’ve seen businesses obsess over click-through rates while ignoring the fact that their landing pages convert like a screen door. Digital calculators should help you see the forest through the trees, not get lost in metric-land.
The industry is seeing some interesting developments in specialized budget tools. Recently, Adam Expo Stand launched Europe’s first AI-powered Exhibition ROI Calculator — a revolutionary predictive analytics tool that helps exhibitors estimate their return on investment (ROI) before committing to trade shows Digital Journal reports. This shows how calculators are getting more sophisticated and industry-specific.
Splitting Your Digital Budget
Each digital channel has its own personality, and your calculator needs to understand that.
Google Ads can give you customers today, but you’ll pay for that immediacy. Facebook might be cheaper per click, but the people clicking aren’t necessarily ready to buy. LinkedIn costs more but might deliver better B2B leads.
Email marketing usually gives you the best ROI, but only if you have people to email. Content marketing takes forever to pay off, but when it does, it compounds like crazy.
Here’s what I’ve learned: start with 60% of your budget on channels that are already working, and use 40% to test new opportunities. Don’t put all your eggs in one basket, but don’t spread yourself so thin that nothing gets proper attention.
PPC campaigns need constant feeding and optimization. I typically recommend 60% of PPC budget on proven keywords and 40% on testing new opportunities. Social media varies by platform – LinkedIn costs more per click but often delivers higher-quality B2B leads. Facebook and Instagram offer broader reach at lower costs, but the quality can be hit or miss.
Content marketing and SEO require patience. Budget allocation should account for content creation, promotion, and the fact that results take 6-12 months to show up. But when they do, the compound effect can be substantial.
For businesses trying to optimize their content budget, understanding high-impact blog topics can help you prioritize content investments that actually drive business results.

Attribution – Or “Which Ad Actually Worked?”
This is where most calculators fall apart, and it’s probably the most important part.
Your customer saw your Facebook ad, Googled your company name, read three blog posts, signed up for your email list, and bought something two weeks later after getting a promotional email. Which channel gets credit for the sale?
Most free calculators just give all the credit to email (last click). That’s like giving the assist to whoever scored the goal and ignoring the other four players who made it possible.
Better calculators try to split the credit more fairly. Still not perfect, but at least they’re trying to see the bigger picture.
Multi-touch attribution reveals the true customer journey, but it requires sophisticated tracking that most businesses don’t have set up properly. Time-decay attribution gives more credit to recent touchpoints, which works well for longer sales cycles. Position-based attribution splits credit between first and last interactions while distributing some credit to the middle touches.
Data-driven attribution uses machine learning to figure out optimal credit distribution, but you need a lot of data for this to work well. Most small businesses should start with something simple and get more sophisticated as they grow.
Free vs. Premium Calculator Options: What You Actually Get
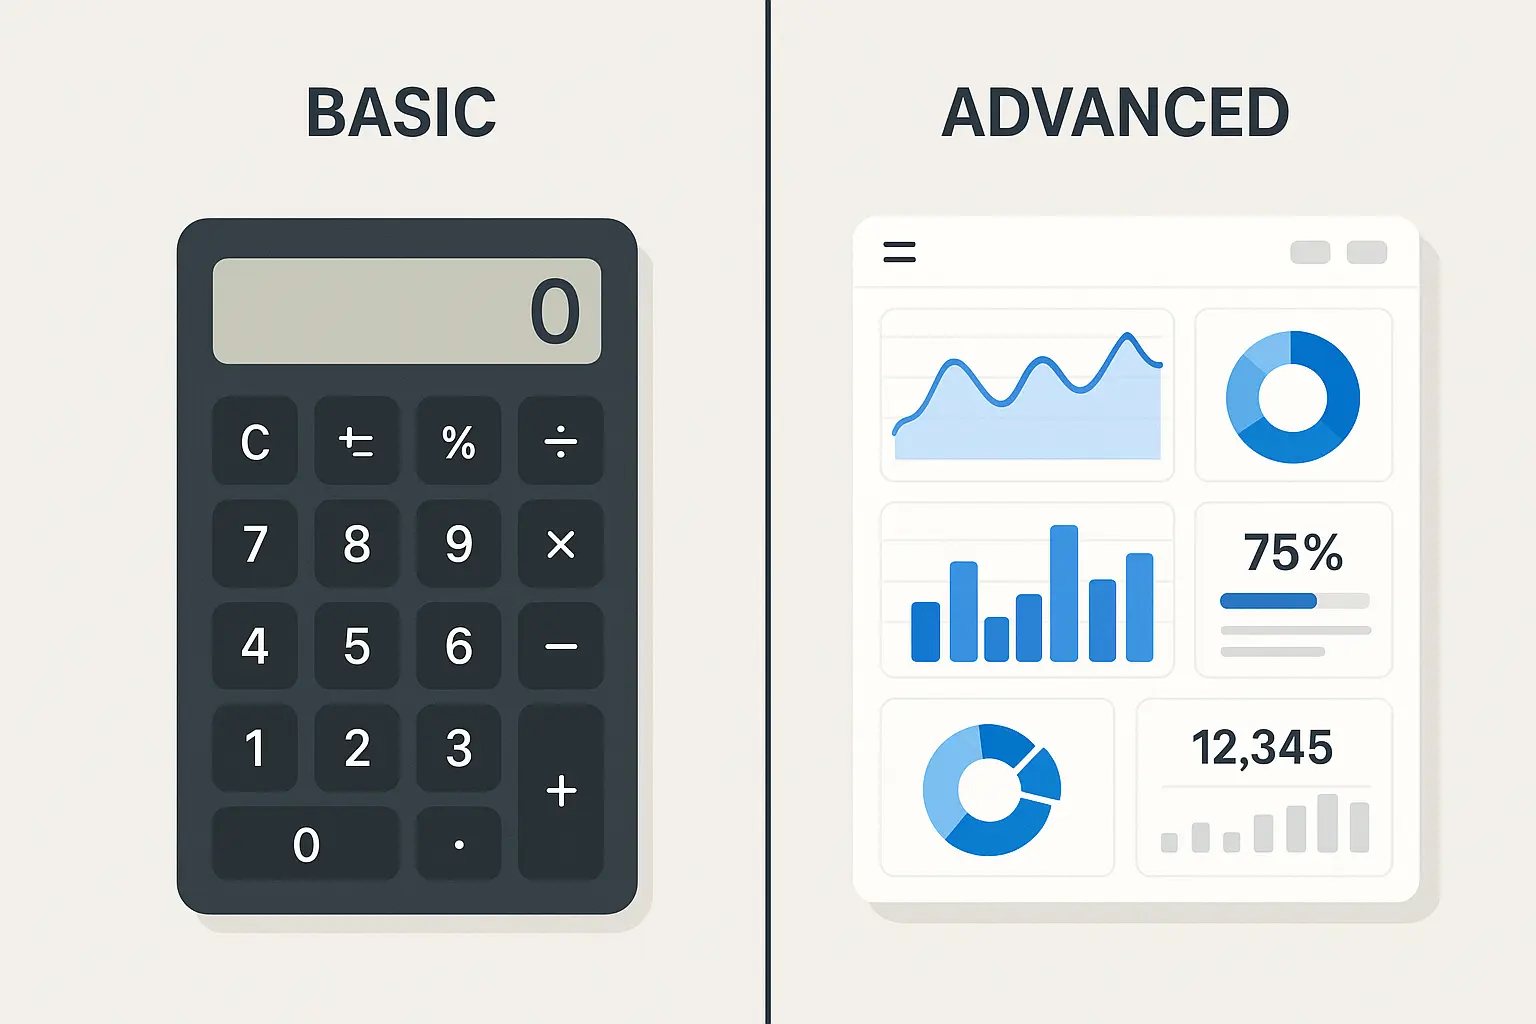
Let’s talk money. Free calculators exist, premium ones cost anywhere from $50/month to $500/month or more. The question is: what’s the difference worth to you?
The free vs. premium decision usually comes down to how complex your business is and how much you’re spending on marketing. If you’re a local restaurant spending $2K/month, a free calculator is probably fine. If you’re a SaaS company spending $50K/month across multiple channels, you need something more sophisticated.
Free Calculators – Good Enough to Get Started
Free calculators are like the free samples at Costco. They’ll give you a taste, but you’re not walking out full.
They’re perfect for getting a rough idea of where you should be spending. If you’re a $500K business and a free calculator tells you to spend $50K on marketing, that’s probably in the ballpark.
Where they fall short is in the details. They’ll tell you to spend money on “digital marketing” but won’t tell you whether that should be Google Ads or Facebook or email or what.
Most free calculators use industry averages, which means they’re wrong for your specific business. But if you’re just starting out and need to convince your boss that marketing deserves a real budget, they’ll do the job.
Research shows that the average marketing spend as a percentage of the total budget is 11.7%. The average marketing spend as a percentage of the total revenue is 14.6% according to HowToSaaS. Free calculators typically use these industry averages as baseline recommendations, which is fine for initial planning but not great for optimization.
What You Actually Get for Free
Free calculators typically offer simple percentage-based calculations, basic channel recommendations, and standard industry benchmarks. That’s about it.
The functionality focuses on broad strokes rather than detailed optimization. You’ll get recommendations like “spend 12% of revenue on marketing” and maybe a basic breakdown like “60% digital, 40% traditional.”
Industry benchmarks provide context, but they’re usually pretty generic. You might see data for “technology companies” or “retail businesses,” but nothing specific to your exact situation.
Template outputs help with presentations, which is actually pretty valuable if you need to present to executives or investors. Most free calculators will generate a basic report or spreadsheet you can customize.
Where Free Tools Fall Short
Free tools often lack sophisticated attribution modeling, have limited customization options, and don’t integrate with your existing business systems. These limitations become real problems as your business grows.
Attribution modeling is typically absent or overly simplified. Most free tools use last-click attribution or ignore attribution entirely, which leads to budget misallocation.
Customization is minimal. You might be able to adjust industry categories or company size, but you can’t modify the underlying assumptions or calculation methods.
Integration capabilities are usually nonexistent. Free calculators operate in isolation, requiring manual data entry and preventing automated updates.
Support varies wildly. Some free tools offer decent documentation, while others give you a calculator and wish you luck.
Premium Calculators – When You Need the Good Stuff
Premium calculators earn their keep when your business gets complicated or when you’re spending enough money that small improvements in efficiency justify the cost.
They’ll integrate with your actual data instead of making you guess. They’ll track which channels are really working instead of just assuming. They’ll help you plan for different scenarios instead of giving you one number and calling it good.
The reporting features alone can be worth the cost if you have to present to executives or investors. Nothing says “I know what I’m doing” like charts that actually make sense.
Custom modeling is where premium tools really shine. Instead of using generic industry data, they learn your specific business patterns and give you recommendations based on what actually works for you.
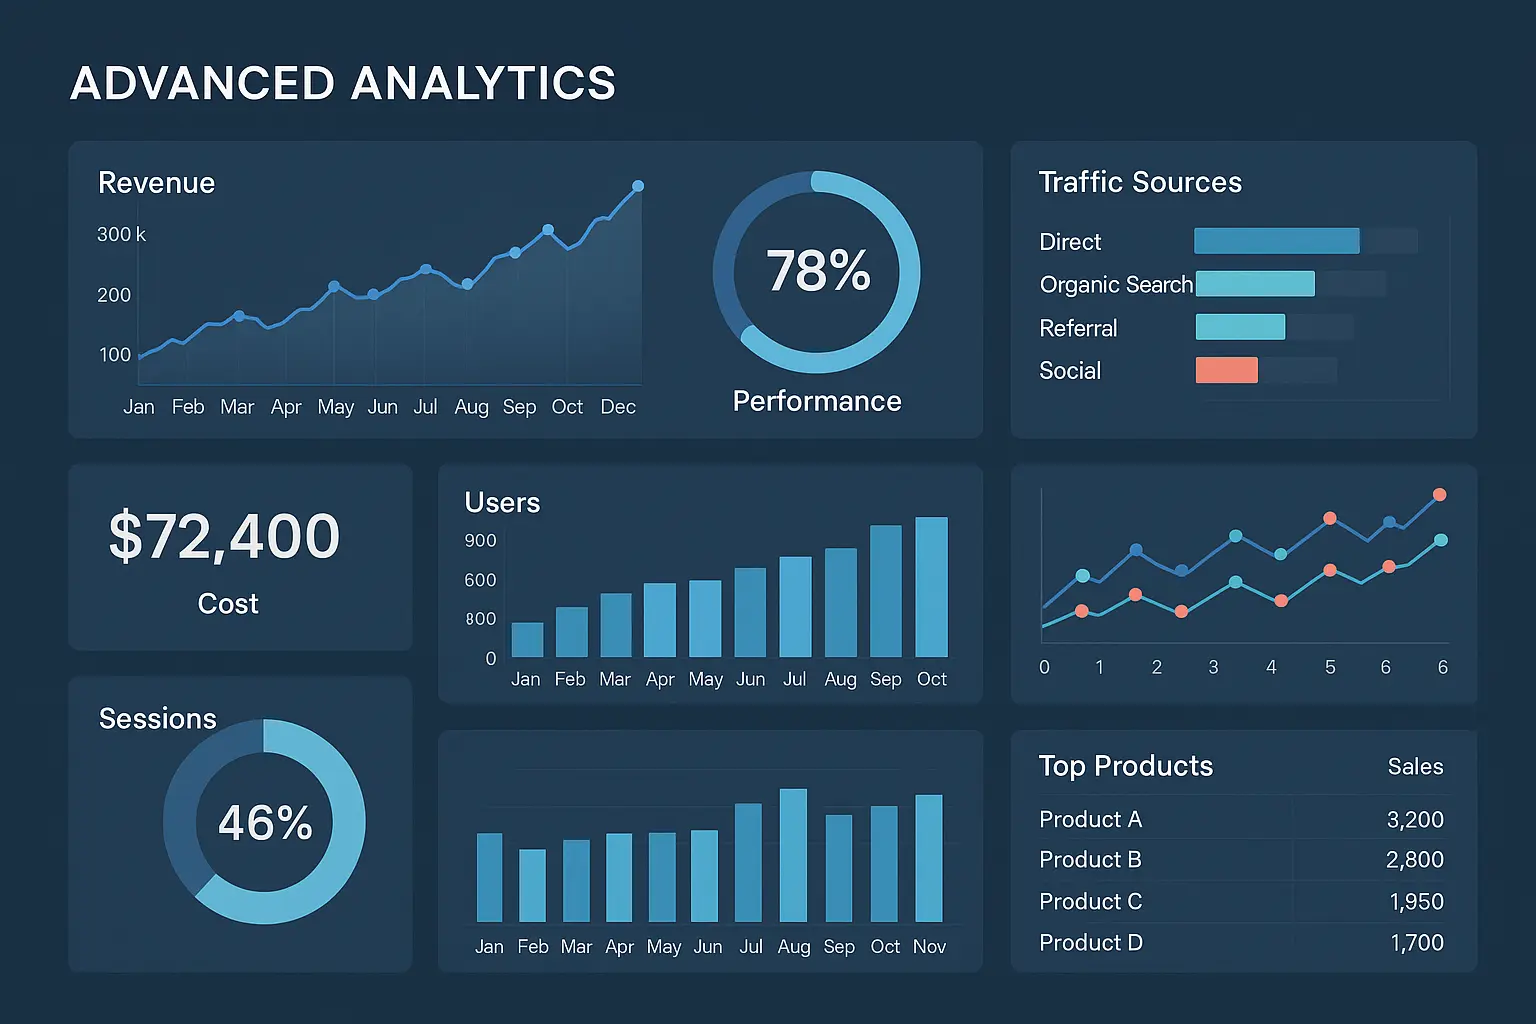
Advanced Analytics and Reporting
Premium tools provide comprehensive dashboards, predictive modeling, scenario planning, and detailed ROI projections with customizable reporting features. This is where you start getting real value for your money.
Comprehensive dashboards consolidate multiple data sources into one view. You can see budget allocation, performance metrics, and optimization opportunities without jumping between five different tools.
Predictive modeling uses your historical data and market trends to forecast what’s likely to happen. These aren’t crystal ball predictions, but they’re way better than guessing.
Scenario planning lets you model different situations. What happens if the economy tanks and you need to cut your budget by 30%? What if a competitor launches a big campaign and you need to respond? These “what if” scenarios help you prepare for different situations.
Custom reporting features let you create presentations tailored to different audiences. Your board wants high-level metrics and ROI projections. Your marketing team wants channel-specific performance data and optimization recommendations.
Real-time updates keep your data current, which matters when you’re making budget decisions based on last week’s performance instead of last quarter’s.
When evaluating premium analytics, you should also consider how these tools work with comprehensive GA4 audit processes to make sure your data is actually accurate and your tracking is set up properly.
Integration and Scalability
High-end calculators integrate with your CRM, marketing automation platforms, and analytics tools while scaling to handle complex organizational structures. This integration eliminates manual data entry and provides more accurate inputs.
CRM integration gives you real customer data instead of industry averages. Understanding your actual customer segments, acquisition costs, and lifetime values leads to much better budget decisions.
Marketing automation connections enable automatic budget adjustments based on campaign performance. If your email campaigns are crushing it, the system can recommend shifting more budget toward list building and email creative.
Analytics tool integration provides comprehensive performance data from Google Analytics, Facebook Ads Manager, and other platforms. Instead of manually updating spreadsheets, your budget recommendations update automatically based on actual performance.
Multi-location and multi-brand support handles complex business structures. If you’re running campaigns for different product lines or in different markets, premium tools can manage that complexity.
User management ensures the right people see the right data. Your marketing manager might need operational details while your CEO just wants the executive summary.
Custom Algorithm Development
Premium solutions often allow custom algorithm development, industry-specific modeling, and personalized consultation services. This is where you’re really paying for sophistication that matches your business.
Industry-specific modeling accounts for the unique characteristics of your market. B2B software companies have different dynamics than e-commerce retailers or professional services firms.
Custom algorithm development lets you incorporate your proprietary data and unique business factors. Your customer acquisition patterns, seasonal variations, and competitive advantages get built into the calculations.
Consultation services help with implementation and ongoing optimization. Premium providers often include strategic guidance as part of their offering, which can be worth the cost alone.
Ongoing support ensures you actually get value from the tool. Regular check-ins, training sessions, and optimization recommendations help improve results over time.
Advertising Calculator Specialization for Paid Media Success
Advertising calculators are the specialists of the budget calculator world. They speak the language of CPCs and conversion rates and Quality Scores.
If you’re spending serious money on ads – let’s say more than $5K/month – you need tools that understand the nuances of paid advertising.
Generic marketing calculators treat all advertising the same. Specialized advertising calculators understand that Google Ads works differently than Facebook, which works differently than LinkedIn or TikTok.
The gaming industry is also getting into specialized calculators. SOFTSWISS launches free online casino cost calculator for early-stage business planning Yogonet reports, showing how niche industries are developing targeted budget tools.

Platform-Specific Calculations
Google Ads works differently than Facebook, which works differently than LinkedIn. Generic calculators treat them all the same. Specialized ones understand the differences.
Google Ads costs depend on Quality Score, keyword competition, and how well your ads match what people are searching for. Facebook costs depend on how relevant your ads are to your audience and how much competition there is for that audience’s attention.
LinkedIn is expensive but might be worth it for B2B. TikTok is cheap but your audience might not be there. YouTube is great for demonstrations but terrible for impulse purchases.
A good advertising calculator knows these differences and allocates your budget accordingly.
PPC and Search Advertising
Search advertising is immediate but competitive. Someone searches for “divorce lawyer,” sees your ad, clicks it, and hopefully becomes a client.
The tricky part is that different keywords have different values. “Divorce lawyer” might cost $200 per click but convert at 5%. “How to file for divorce” might cost $5 per click but convert at 0.5%.
Your calculator needs to understand these trade-offs and help you find the sweet spot between volume and efficiency.
Quality Score is Google’s way of rewarding relevant, useful ads with lower costs. A calculator that ignores Quality Score is like a GPS that doesn’t know about traffic – technically functional but not very helpful.
Keyword research integration helps identify opportunities and budget requirements. High-volume, low-competition keywords offer better ROI than competitive terms that drain budgets quickly.
Quality Score optimization can reduce costs by 30-40% while improving ad positions. Most businesses don’t realize how much this impacts their budget efficiency.
Seasonal adjustments matter too. Retail businesses need higher budgets during holiday seasons, while B2B companies might reduce spending during summer months when decision-makers are on vacation.
Take a legal services firm targeting “personal injury lawyer” keywords. They might face CPCs of $150-$300, with a 2% conversion rate and $5,000 average case value. Their calculator would recommend a monthly budget of $15,000-$25,000 for search campaigns, split between branded terms (20%), high-intent keywords (60%), and broader informational queries (20%).
Social Media Advertising
Social media advertising is about interrupting people in a good way. They’re not searching for your product; you’re introducing them to it.
This means your targeting has to be spot-on, and your creative has to be compelling. It also means your conversion rates will probably be lower than search advertising, but your costs per click should be lower too.
Facebook and Instagram are great for reaching consumers. LinkedIn is better for B2B. TikTok is perfect for reaching younger audiences. Your calculator should understand these differences and allocate budget accordingly.
The other thing about social media advertising is creative fatigue. Your ads stop working after people see them too many times. Your budget needs to account for constantly creating new ads, not just running the same ones forever.
Audience targeting precision affects costs significantly. Broad audiences cost less per impression but often deliver lower conversion rates. Narrow targeting increases costs but improves relevance and conversion rates.
Platform-specific metrics guide optimization decisions. Facebook emphasizes relevance scores, LinkedIn focuses on click-through rates, and TikTok prioritizes completion rates and engagement.
Cross-platform audience overlap needs consideration. Targeting the same audience across multiple platforms can increase costs without proportional benefits.
According to HowToSaaS data, tech and software companies allocate roughly the average proportion of their total budget to marketing (12.05%), but considerably below the average proportion of their total revenue to marketing (8.61%). This suggests most software companies have room to increase their social media advertising budget.
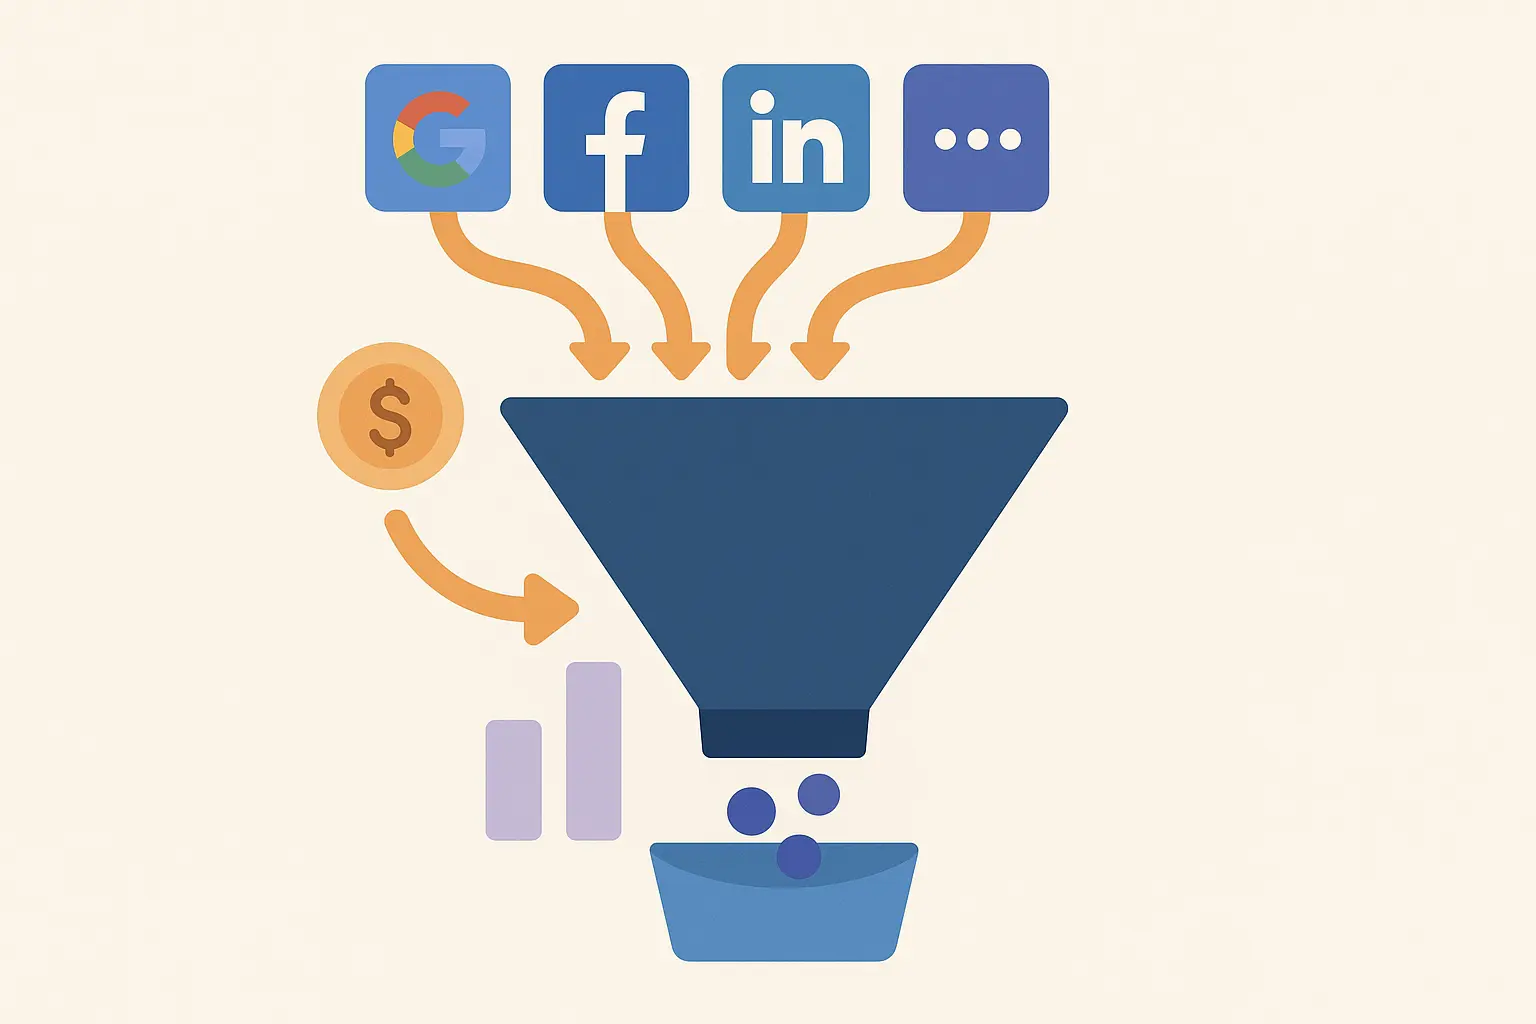
Cross-Platform Budget Optimization
Here’s where things get really complicated. Your customers don’t live on just one platform. They might see your Facebook ad, Google your company, read your blog, and buy something after getting an email.
Which platform gets credit for the sale? How do you allocate budget when channels work together?
Advanced advertising calculators help you distribute budgets across multiple platforms while maintaining consistent messaging and maximizing overall effectiveness.
Multi-Platform Attribution
This is the holy grail of marketing analytics, and most people get it wrong.
Customer journey mapping reveals platform interactions that single-platform reporting misses. A customer might see your Facebook ad, search for your brand on Google, and convert through a LinkedIn retargeting campaign.
Attribution windows affect budget allocation decisions. Seven-day windows favor lower-funnel activities, while 30-day windows give more credit to awareness campaigns.
Cross-device tracking complicates things but provides more accurate insights. Customers often discover brands on mobile devices but convert on desktop computers.
Incrementality testing helps validate attribution models by measuring the true impact of advertising spend through controlled experiments.
|
Platform |
Average CPC |
Conversion Rate |
Best For |
Budget Allocation |
|---|---|---|---|---|
|
Google Ads |
$1-5 |
3-5% |
High-intent searches |
40-50% |
|
Facebook/Instagram |
$0.50-2 |
1-3% |
Awareness & retargeting |
25-35% |
|
|
$5-15 |
2-4% |
B2B targeting |
10-20% |
|
TikTok |
$0.25-1 |
1-2% |
Younger demographics |
5-15% |
Strategic Integration and ROI Measurement That Actually Works
This is where most businesses fall apart. They get so focused on the tactics – CPCs and conversion rates and all that – that they forget about the bigger picture.
Your marketing budget should support your business goals, not exist in its own little world.
Marketing budget calculators need to integrate with your broader business strategy and provide clear ROI measurement capabilities that actually mean something to your bottom line.
Business Goal Alignment
If your business goal is to acquire customers at any cost, your marketing budget should reflect that. If your goal is profitability, you need different metrics and different allocation strategies.
Most calculators assume you want to maximize revenue. But what if you want to maximize profit? What if you want to build brand awareness for a future product launch? What if you want to steal market share from a competitor?
Your calculator should understand what you’re actually trying to achieve and recommend budget allocation accordingly.
When aligning marketing budgets with business goals, companies should also consider comprehensive retail math fundamentals to ensure their budget allocations consider profit margins, inventory turnover, and other financial metrics.
Revenue Target Integration
Here’s a simple framework: work backwards from your revenue goals to figure out how many customers you need, then figure out how much you need to spend to get those customers.
Want $1M in new revenue? If your average customer is worth $1,000, you need 1,000 new customers. If it costs you $200 to acquire a customer, you need a $200K marketing budget.
This assumes your conversion rates and customer values stay constant, which they won’t. But it gives you a starting point that’s tied to actual business outcomes instead of arbitrary percentages.
Revenue goal decomposition helps determine required marketing performance. Growth target realism affects budget allocation accuracy – aggressive growth targets might require higher marketing investment, but unrealistic goals lead to budget waste.
Seasonal planning accounts for demand fluctuations and competitive dynamics. Your budget allocation should increase during high-demand periods and decrease during slower seasons.
Cash flow considerations matter too. Marketing spend should align with revenue collection patterns to maintain healthy cash flow.
A SaaS company with $5M ARR targeting 100% growth needs $5M in new revenue. With an average deal size of $10,000 and 18-month sales cycle, they need 500 new customers. If their blended CAC is $2,000, they need a $1M marketing budget. But the calculator should recommend front-loading spend in Q1-Q2 to account for the sales cycle delay.
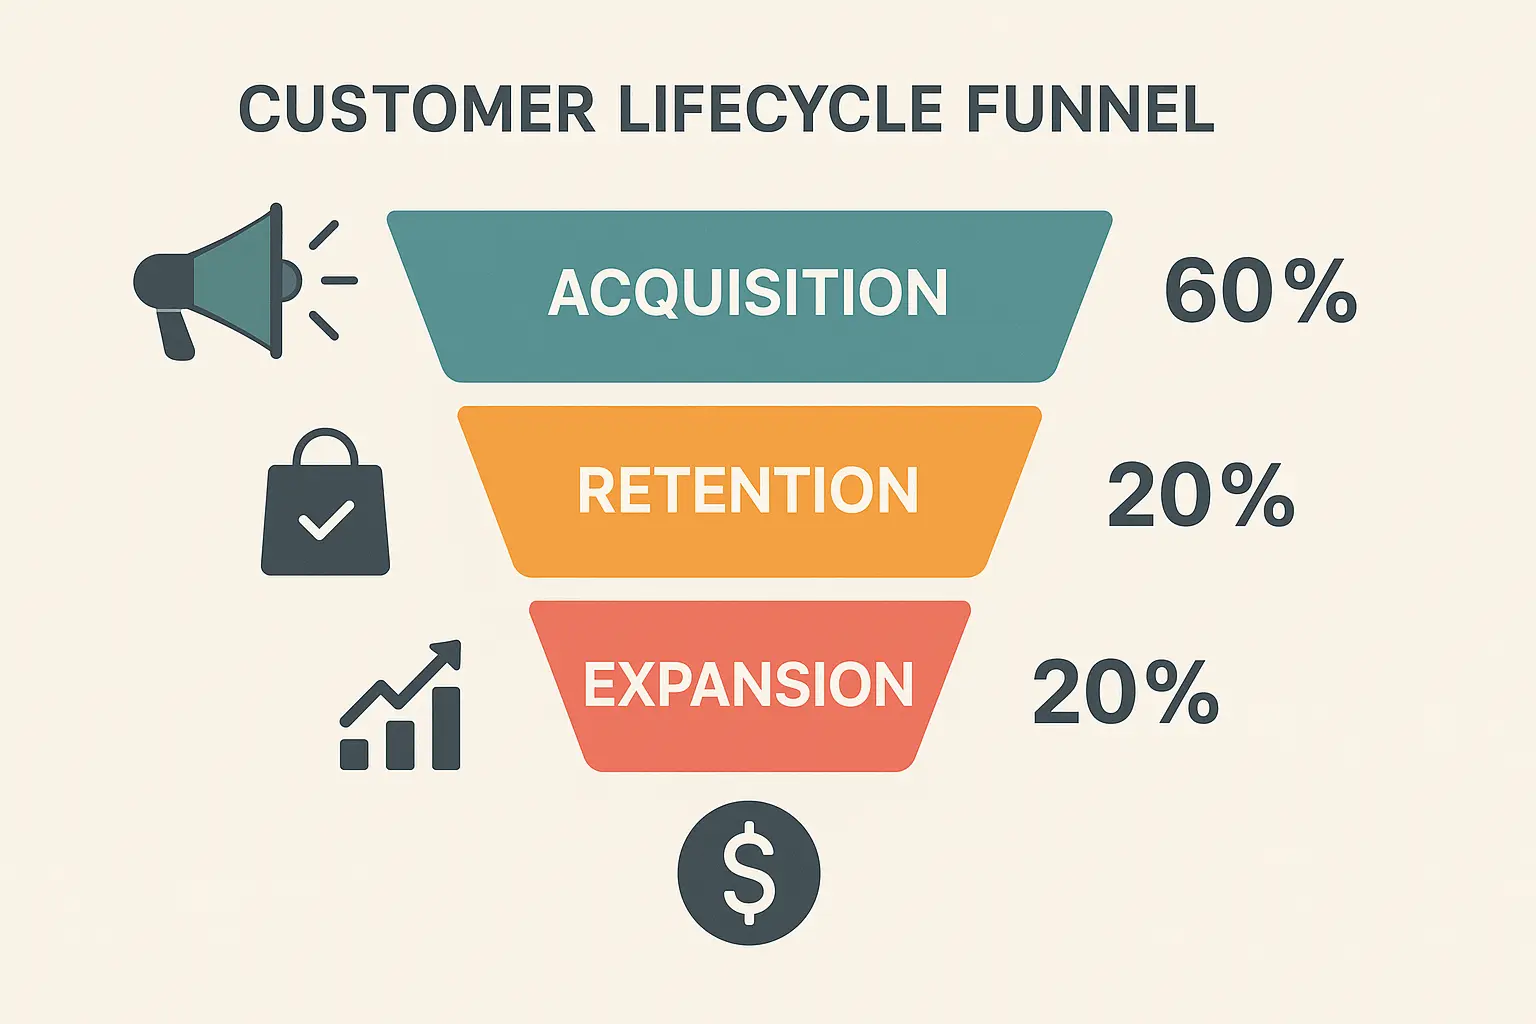
Customer Lifecycle Considerations
Understanding the full customer lifecycle prevents overinvestment in acquisition at the expense of retention and expansion opportunities.
Acquiring new customers costs 5-25 times more than retaining existing ones, but growth requires both activities. Your budget allocation should reflect this balance.
Customer lifetime value calculations guide budget decisions. High-CLV customers justify higher acquisition costs and more retention investment.
Retention rate improvements compound over time. A 5% retention rate improvement can increase profits by 25-95% depending on your business model.
Expansion revenue opportunities often get insufficient budget allocation, even though existing customers typically convert at higher rates and generate larger order values.
Performance Tracking and Optimization
The best marketing budget isn’t set once at the beginning of the year and forgotten about. It’s constantly adjusted based on what’s working and what isn’t.
Your calculator should help you identify when to double down on successful campaigns and when to cut your losses on unsuccessful ones.
Monthly budget reviews should be standard practice. What worked last month? What didn’t? What changed in the market? How should next month’s budget be different?
Real-Time Budget Adjustments
Performance thresholds should trigger automatic recommendations. When cost-per-acquisition exceeds targets by 20%, the system should suggest budget reallocation or campaign optimization.
Opportunity identification helps capitalize on unexpected performance. If a campaign delivers 50% better results than projected, the calculator should recommend increased investment.
Budget velocity considerations prevent over-optimization. Rapid budget shifts can disrupt campaign learning phases and reduce overall performance.
Approval workflows ensure appropriate oversight while enabling quick decisions. Marketing managers might approve small adjustments while larger changes require executive approval.
Predictive Analytics Integration
Machine learning algorithms can identify patterns that humans miss. Seasonal trends, competitive responses, and market shifts become predictable with sufficient data.
Forecasting accuracy improves with data volume and time. New implementations provide basic predictions, while mature systems offer sophisticated insights.
Proactive recommendations prevent performance degradation. The system might suggest increasing budgets before seasonal demand spikes or reducing spend before market downturns.
Confidence intervals help evaluate prediction reliability. High-confidence predictions justify immediate action, while low-confidence forecasts require additional monitoring.
How The Marketing Agency Solves Calculator Limitations
Here’s the thing about calculators – they’re tools, not strategies. They can tell you how much to spend, but they can’t tell you how to spend it well.
That’s where working with specialists makes sense. The Marketing Agency takes calculator insights and turns them into actual campaigns that work.
Instead of generic recommendations like “spend 30% on social media,” they’ll tell you exactly which audiences to target, which creative to test, and how to optimize for your specific business goals.
The Marketing Agency’s data-driven approach directly addresses common pain points businesses face when using marketing budget calculators through AI-driven analytics combined with human strategic insight.
Generic calculators provide broad recommendations, but The Marketing Agency creates customized strategies that account for your unique business situation. Their process begins with understanding your specific challenges and opportunities rather than plugging numbers into a formula.
The Marketing Agency leverages advanced AI-powered optimization tools to enhance traditional marketing calculator capabilities, providing more sophisticated budget allocation recommendations than standard tools can deliver.
The Discovery Call process performs live budget calculation sessions using your actual business data rather than industry averages. This personalized approach produces more accurate and actionable recommendations.
Their core services integrate seamlessly with budget optimization strategies:
-
PPC optimization ($750-$5,000/month) uses AI-driven keyword research and automated audience segmentation to maximize advertising efficiency
-
Email marketing strategies ($1,200-$10,000/month) focus on maximizing ROI from existing customer relationships
-
Inbound marketing ($500-$3,000/month) provides comprehensive buyer’s journey oversight and optimization
Attribution modeling expertise addresses a critical component that standard budget calculators often oversimplify. The Marketing Agency ensures accurate budget allocation across channels through sophisticated tracking and analysis.
They also incorporate comprehensive content optimization strategies that align budget allocation with content performance metrics, ensuring marketing investments support both paid and organic channel success.
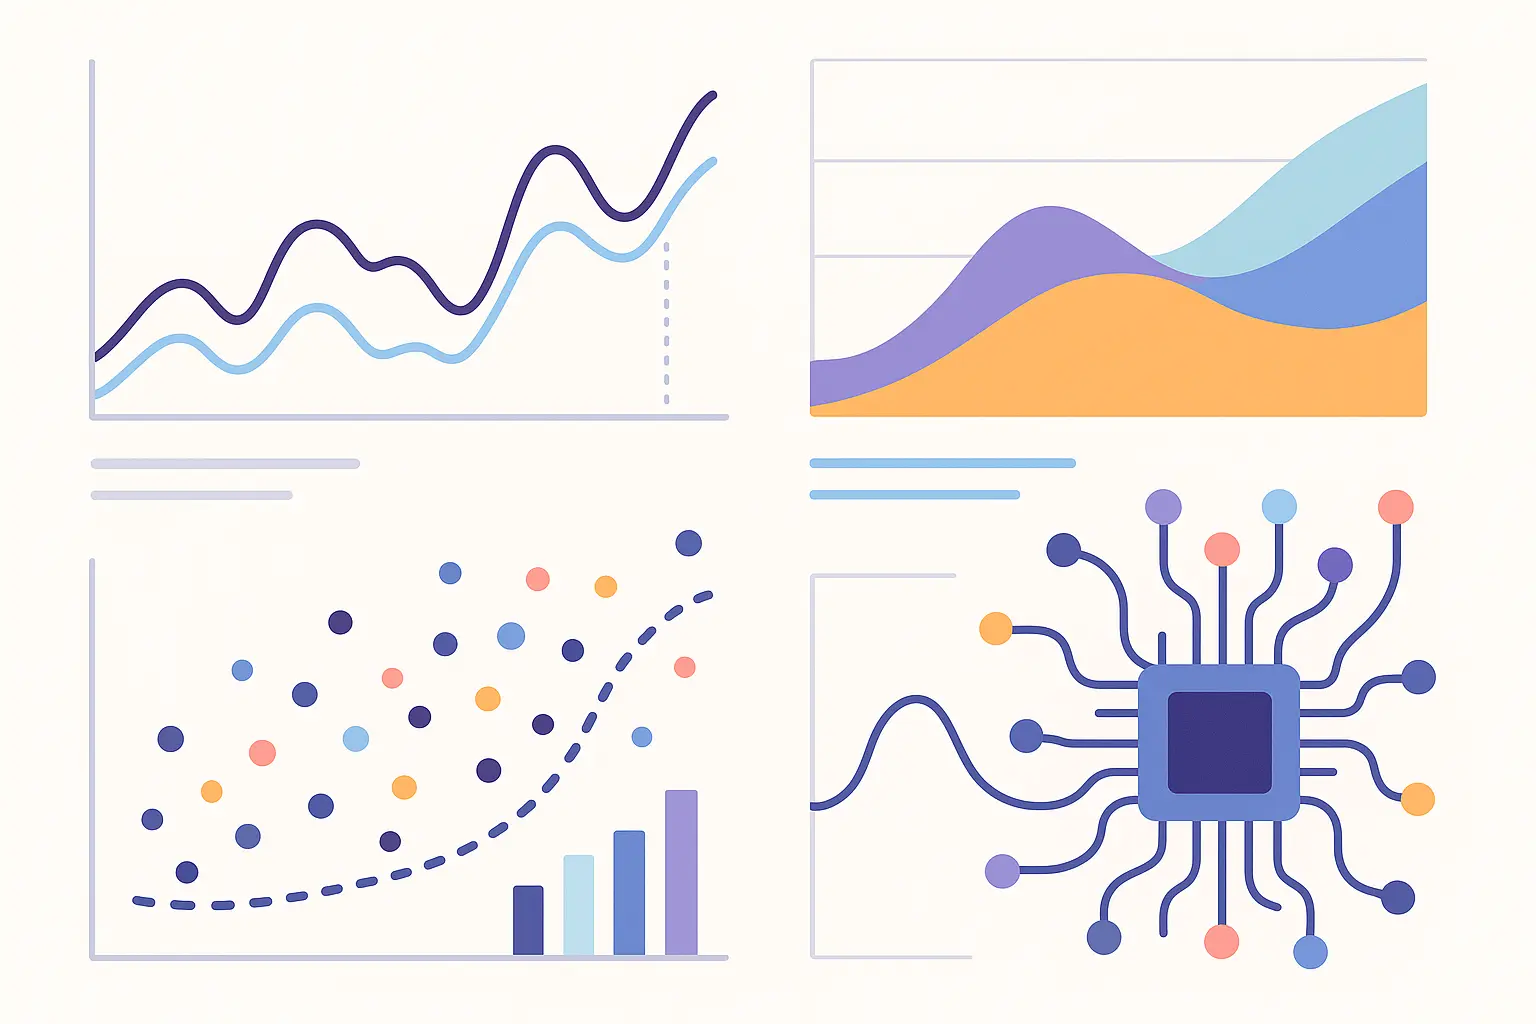
AI-Driven Analytics with Human Insight
The best budget optimization combines machine learning with human experience. AI can process data and identify patterns that humans would miss. Humans can provide context and strategic thinking that AI can’t.
The Marketing Agency uses both. Their AI analyzes your data to identify opportunities and inefficiencies. Their strategists translate those insights into actionable campaigns.
This combination produces better results than either approach alone. AI handles the data processing and pattern recognition while humans provide strategic context and creative problem-solving.
Personalized Budget Allocation Strategies
Every business is different. A SaaS company selling to enterprise clients needs different budget allocation than an e-commerce store selling consumer products.
The Marketing Agency creates custom allocation strategies based on your business model, customer lifecycle, competitive landscape, and growth objectives.
Instead of industry benchmarks, you get recommendations based on what actually works for businesses like yours. They look at your actual customers, your actual competition, and your actual market conditions.
AI-driven analytics combined with human creativity provides the sophisticated budget optimization that premium calculators promise, but with ongoing strategic partnership and real-time adjustments based on actual performance data.
This dynamic approach adapts to market conditions and business growth rather than relying on static annual planning. The result is continuously optimized marketing investment that evolves with your business needs.
Ongoing Optimization and Adjustment
Budget allocation isn’t a “set it and forget it” activity. Markets change, competition changes, your business changes.
The Marketing Agency provides ongoing optimization to ensure your budget allocation evolves with your business. Monthly reviews, quarterly strategy sessions, and real-time adjustments based on performance data.
This ongoing partnership ensures your marketing investment continues to deliver results as your business grows and changes. Instead of annual budget planning sessions, you get continuous optimization based on what’s actually happening in your market.
Ready to move beyond generic calculator recommendations? Schedule a Discovery Call with The Marketing Agency to develop a customized budget strategy that actually works for your business.
Final Thoughts
Marketing budget calculators are useful tools, but they’re just the starting point. The real work happens when you take those recommendations and turn them into campaigns that actually drive business results.
Free calculators work fine for basic planning. Premium calculators provide better insights and integration. But neither replaces the need for strategic thinking and skilled execution.
The most important thing is to start somewhere. Pick a calculator that matches your business complexity and budget, use it to get a baseline recommendation, then start testing and optimizing based on real performance data.
Remember that all marketing budget allocation is experimental. You’re making educated guesses based on available data, then adjusting based on results. The businesses that succeed are the ones that embrace this experimental mindset and continuously improve their approach.
Whether you use a free calculator, invest in premium tools, or work with specialists like The Marketing Agency, the key is to stay focused on business outcomes rather than marketing metrics. Revenue, profit, and customer acquisition matter more than clicks, impressions, and engagement rates.
Your marketing budget should be a strategic investment in business growth, not just a cost center. The right tools and approach can help you make that investment wisely.
Bottom line: spend 30 minutes this week cleaning up your conversion tracking before you worry about any calculator recommendations. You can’t optimize what you can’t measure accurately.
