


Table of Contents
-
Understanding TikTok’s Engagement Puzzle
-
Breaking Down the Math That Actually Matters
-
Manual Calculations vs. Automated Tools
-
Advanced Analytics That Change Everything
-
Turning Data Into Content Gold
-
How The Marketing Agency Can Help
-
Final Thoughts
TL;DR
-
TikTok engagement rates typically range from 3-9%, with smaller accounts often outperforming larger ones
-
The basic formula divides total engagement by followers, but reach-based calculations give you more accurate insights
-
Comments and shares carry more weight than likes in TikTok’s algorithm
-
Manual calculations work for basic tracking, but automated tools provide real-time monitoring and competitor analysis
-
Your first few hours post-upload are critical for algorithm distribution
-
Different content types require different engagement benchmarks and measurement approaches
Understanding TikTok’s Engagement Puzzle
Why Your Follower Count Doesn’t Tell the Whole Story
Look, I get it – we all get caught up in those follower counts. I’ve watched countless creators obsess over hitting that next milestone while completely ignoring whether anyone actually cares about their content. Here’s the reality check – TikTok’s algorithm doesn’t give a damn if you have 100K followers if only 50 people actually interact with your stuff. With the average TikTok engagement rate sitting at 1.5% as of March 2025, figuring out these metrics becomes pretty crucial if you’re serious about this whole TikTok thing.
A solid tiktok engagement rate calculator shows you what’s really happening with your content beyond those surface-level numbers we all chase. These metrics give you the real picture of how your audience actually connects with what you’re putting out there. We’re talking about data that shows whether your content strategy actually works or if you’re just shouting into the void (been there too).
Just like when we dig deep into comprehensive analytics in GA4 audits to understand what’s really going on, figuring out TikTok engagement requires you to actually measure stuff systematically. The best tiktok engagement rate calculator tools help you understand which metrics actually matter for your goals and audience.
According to SocialInsider, the average TikTok engagement rate is 3.30% (calculated by views), which means anything above that is considered to be a good engagement rate for TikTok.
The Foundation: Core Engagement Rate Basics
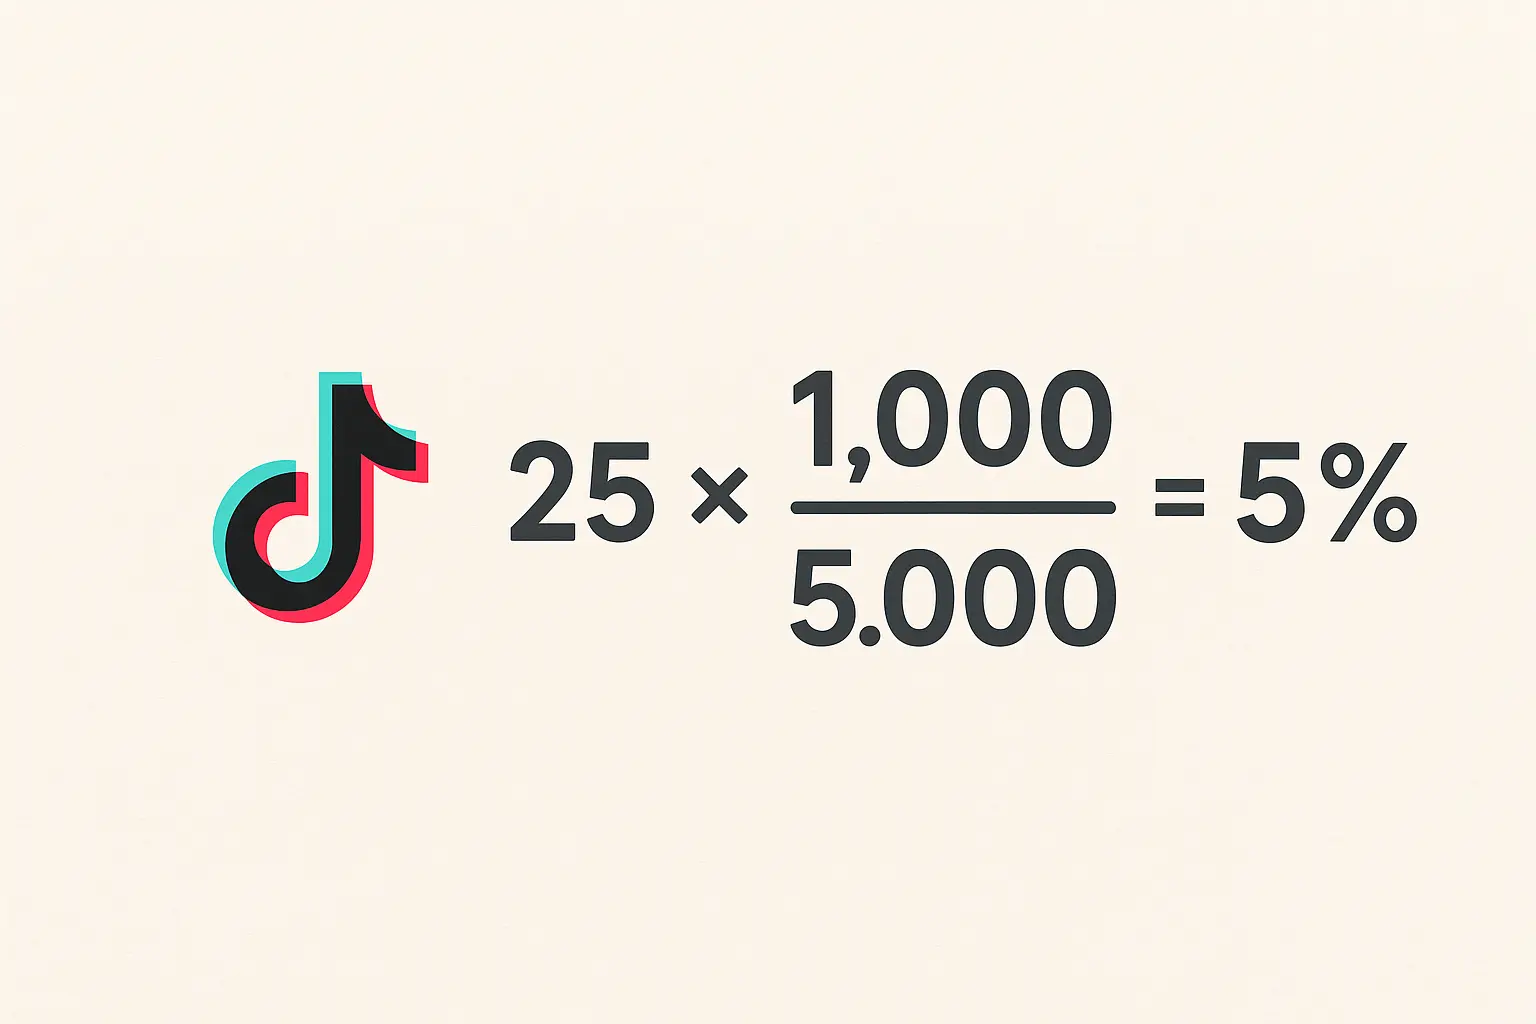
The basic engagement rate formula is pretty straightforward, thank goodness. You grab all your engagement actions (likes, comments, shares, saves), divide by your follower count, then multiply by 100. Boom – you’ve got your percentage.
But here’s where it gets interesting (and way more useful). The engagement rate by reach formula gives you a much clearer picture because it measures interactions against actual viewers, not just followers. This calculation divides total engagement by video views, showing you how compelling your content really is to people who actually see it.
Any decent tiktok engagement calculator should give you both follower-based and reach-based calculations so you get the complete picture. Let’s say your TikTok video got 500 likes, 50 comments, and 25 shares (total engagement: 575) with 10,000 views. Your engagement rate by reach would be (575 ÷ 10,000) × 100 = 5.75%, which beats the platform average and means your content actually connects with people.
TikTok’s Unique Engagement DNA
Here’s the thing – TikTok isn’t Instagram or Facebook. This platform has its own personality, and understanding this makes all the difference in how you track your numbers.
Comments represent way deeper engagement because people actually took time to respond to your content. Shares mean your content is worthy of personal recommendation – that’s huge. The algorithm recognizes this and weights these interactions more heavily than simple likes.
Video completion rates, rewatches, and profile visits are TikTok’s secret sauce metrics that most basic engagement calculators completely miss. These signals tell the algorithm whether your content is actually worth showing to more people. A good tiktok engagement rate calculator should account for these TikTok-specific behaviors.
Just like social media management tools like Hootsuite provide platform-specific analytics, your tiktok engagement rate calculator needs to understand TikTok’s unique ecosystem. Research from HypeAuditor shows that the average engagement rate on TikTok in 2020 was 17.5%, but by 2021, any TikTok engagement rate higher or equal to 13% is considered reasonable for TikTok influencers.
According to recent analysis from Hootsuite’s 2025 TikTok engagement research, the platform now hosts more than 1.5 billion monthly active users and 3 billion global installations, making it one of the most engaging social media platforms in the world.
Breaking Down the Math That Actually Matters
Manual Calculation Methods That Work
Sometimes you just need to get your hands dirty with the numbers. Manual calculations give you complete control over how you measure your performance, and honestly, it helps you understand what’s actually happening.
The basic calculation is simple enough: add up all engagement actions, divide by follower count, then multiply by 100. This works great when you’re tracking consistent follower growth and want a straightforward metric that makes sense.
Time-period analysis gets a bit more sophisticated, but it’s worth it. I look at engagement rates across specific timeframes to spot trends and seasonal patterns. This approach helps you nail down optimal posting schedules and identify which content themes work best during different periods.
Think of it like this – not all engagement is created equal. Weighted calculations assign different values to engagement types based on their actual impact on your goals. You might give comments a 3x multiplier compared to likes because they show stronger community building potential. While a basic tiktok engagement rate calculator gives you standard metrics, manual calculations let you customize the weighting based on what actually matters to you.
|
Engagement Type |
Standard Weight |
Weighted Value |
Business Impact |
|---|---|---|---|
|
Likes |
1x |
1 point |
Low – passive engagement |
|
Comments |
3x |
3 points |
High – active conversation |
|
Shares |
5x |
5 points |
Very High – viral potential |
|
Saves |
4x |
4 points |
High – content value indicator |
Manual Calculation Checklist
-
☐ Collect likes, comments, shares, and saves for your target period
-
☐ Figure out your follower count at measurement time
-
☐ Apply weighted values if you’re using advanced calculations
-
☐ Calculate percentage: (Total Engagement ÷ Followers) × 100
-
☐ Compare against previous periods and industry benchmarks
-
☐ Document results so you can spot trends
Post-Specific Deep Dives
Individual post analysis shows you which specific videos actually hit the mark with your audience. Instead of looking at overall account performance, you calculate engagement rates for single videos to identify what makes your top-performing content tick.
Content type comparison analysis examines engagement rates across different video formats, topics, and styles. This systematic approach shows you which content categories consistently deliver the best results, taking the guesswork out of your content planning. A specialized tiktok post engagement rate calculator helps you dive deep into individual video performance, revealing patterns that broader analytics might miss.
Here’s a real example that’ll blow your mind: A beauty brand analyzed their last 30 TikTok posts and discovered that tutorial videos averaged 8.2% engagement rate, while product showcases only achieved 4.1%. This data-driven insight led them to shift 70% of their content strategy toward educational formats, resulting in a 40% overall engagement increase. Pretty wild, right?
Manual Calculations vs. Automated Tools
The Power of Automated Platforms
Third-party analytics tools completely change how you track engagement. Platforms like Hootsuite Analytics, Sprout Social, and Later provide comprehensive TikTok engagement rate calculations with bonus features like competitor analysis and trend identification that you just can’t get manually.
Native TikTok Analytics through Pro accounts gives you built-in engagement metrics straight from the platform. This free tool provides essential data including profile views, video views, and follower demographics without requiring external subscriptions – and hey, free is always good.
Custom calculator development allows agencies and large brands to create tailored measurement tools aligned with specific KPIs. These solutions incorporate proprietary weighting systems and integrate with existing marketing technology stacks.
Much like choosing between different SEO tools like Ahrefs vs SEMrush, selecting the right tiktok engagement rate calculator depends on your specific needs and budget. Whether you need a simple tiktok calculator for basic metrics or a comprehensive analytics platform, the key is finding tools that align with your measurement goals.
Data from TheSocialCat indicates that a good engagement rate on TikTok typically ranges from 4% to 18%, depending on the creator’s follower count, with nano- and micro-influencers often seeing higher engagement rates.

Real-Time Monitoring Game-Changers
Live engagement tracking monitors rates as they develop, letting you identify viral content early and capitalize on trending opportunities. This immediate feedback enables quick content strategy adjustments when you spot something taking off – and trust me, timing is everything on TikTok.
Performance alert systems notify you when engagement rates exceed or fall below predetermined thresholds. These automated notifications help maintain consistent engagement standards and enable proactive content management. Advanced tiktok engagement calculator platforms provide these real-time insights, helping creators and brands stay ahead of performance trends instead of always playing catch-up.
Automated Tool Selection Checklist
-
☐ Real-time engagement tracking capabilities
-
☐ Competitor analysis and benchmarking features
-
☐ Historical data storage and trend analysis
-
☐ Custom alert and notification systems
-
☐ Integration with existing marketing tools
-
☐ Accurate follower and view count tracking
-
☐ Export capabilities for reporting
Advanced Analytics That Change Everything
Setting Benchmarks That Actually Matter
Let’s be real about what good looks like. Industry standard comparisons help you understand how your engagement rates stack up against similar accounts in your niche. TikTok engagement rates typically range from 3-9%, with micro-influencers often achieving higher rates than larger accounts due to more engaged, niche audiences.
Setting performance targets involves creating realistic, measurable goals based on your current performance, growth trajectory, and business objectives. These targets should account for follower growth patterns and seasonal variations in your specific industry – because let’s face it, your Halloween content probably won’t perform the same in July.
Similar to how we approach market sizing for business opportunities, using a tiktok engagement rate calculator requires understanding industry benchmarks and competitive landscapes.
|
Industry |
Average Engagement Rate |
Top Performer Range |
Benchmark Goal |
|---|---|---|---|
|
Entertainment & Media |
0.83% |
2-5% |
1.5% |
|
Food & Beverage |
0.46% |
1-3% |
1% |
|
Retail |
0.46% |
1-4% |
1% |
|
Healthcare & Wellness |
0.41% |
1-3% |
0.8% |
|
Nonprofit |
0.89% |
2-6% |
1.5% |
Recent industry analysis from Hootsuite’s 2025 TikTok Engagement Study reveals that user engagements are listed as the most important factor in the TikTok algorithm, meaning the more users like, share, comment, and interact with content, the more likely it is to be found organically.

Turning Data Into Content Gold
Data-Driven Content Strategy
Here’s where things get exciting. Data-driven content planning uses engagement rate analysis to identify optimal posting times, content formats, and topics that actually resonate with your audience. This systematic approach replaces guesswork with proven performance indicators – no more throwing spaghetti at the wall to see what sticks.
Audience engagement improvement tactics include specific strategies that actually work: asking questions, using trending sounds, creating interactive content, and responding promptly to comments. These methods directly impact engagement rate calculations by increasing user interactions in meaningful ways.
ROI measurement and attribution connect engagement rates to business outcomes like website traffic, lead generation, and sales conversions. This analysis demonstrates the business value of TikTok engagement and informs budget allocation decisions – because at the end of the day, engagement needs to translate to something tangible.
Just as we focus on high-impact blog topics for content marketing, using a tiktok engagement calculator helps identify high-performing content themes for TikTok success.
Here’s a real example that’ll make you rethink everything: A fitness influencer tracked engagement rates across different workout types and discovered that 15-second HIIT demonstrations achieved 12.3% engagement compared to 6.1% for longer form content. By shifting to shorter, high-intensity formats, they doubled their average engagement rate within three months. Sometimes the data tells a story you never expected.
Content Optimization Checklist
-
☐ Analyze top-performing content for common themes
-
☐ Identify optimal posting times based on engagement data
-
☐ Test different content formats and measure results
-
☐ Monitor trending hashtags and sounds in your niche
-
☐ Track completion rates and rewatch metrics
-
☐ Respond to comments within first 2 hours of posting
-
☐ Create content series based on high-engagement topics

TikTok Engagement Rate Calculation Template
Manual Calculation Worksheet:
Post Details:
- Video Title: ________________
- Post Date: ________________
- Followers at Time of Post: ________________

Engagement Metrics:
- Likes: ________________
- Comments: ________________
- Shares: ________________
- Saves: ________________
- Views: ________________

Calculations:
Total Engagement = Likes + Comments + Shares + Saves = ________________

Engagement Rate by Followers = (Total Engagement ÷ Followers) × 100 = ________________%

Engagement Rate by Views = (Total Engagement ÷ Views) × 100 = ________________%

Weighted Engagement Score = (Likes × 1) + (Comments × 3) + (Shares × 5) + (Saves × 4) = ________________
Advanced Tracking Methods
Want to know which of your followers actually stick around and engage? That’s where cohort analysis comes in handy. This method examines how different user groups engage with your content over time, revealing whether your engagement rates improve with audience maturity and helping identify the most valuable follower segments.
A/B testing frameworks allow systematic comparison of different content approaches. You can test posting times, video lengths, caption styles, and hashtag strategies while measuring their impact on engagement rates. It’s like having a laboratory for your content strategy.
Predictive modeling uses historical engagement data to forecast future performance. These models help optimize content calendars and identify the best opportunities for viral content distribution – though let ‘s be honest, predicting virality is still part art, part science.
Content Performance Audit Checklist
-
☐ Review last 30 days of post performance data
-
☐ Identify top 5 and bottom 5 performing posts
-
☐ Analyze common characteristics of high-engagement content
-
☐ Document optimal posting times and days
-
☐ Evaluate hashtag performance and reach
-
☐ Assess video length impact on completion rates
-
☐ Review comment sentiment and response rates
-
☐ Calculate average engagement rate by content category

How The Marketing Agency Can Help
Look, if you’re feeling overwhelmed by all this data stuff, you’re not alone. The Marketing Agency’s focus on “strategies rooted in data and science” makes them solid partners for businesses looking to maximize TikTok ROI. Their performance-focused approach eliminates the guesswork from engagement rate optimization.
Their expertise in attribution modeling proves particularly valuable for connecting TikTok engagement rates to actual business outcomes. This capability helps properly allocate marketing budgets across different channels based on real performance data – not just gut feelings or vanity metrics.
Ready to turn your TikTok engagement data into measurable business results? The Marketing Agency can provide the analytical framework and strategic guidance needed to ensure your TikTok investment delivers concrete ROI.

Final Thoughts

TikTok engagement rate calculators aren’t just number-crunching tools – they’re your roadmap to understanding what actually works with your audience. The difference between successful creators and those struggling to gain traction often comes down to how well they interpret and act on their engagement data.
Manual calculations give you control and transparency, while automated tools provide efficiency and advanced insights. The key is choosing the right approach for your specific goals and consistently using that data to refine your content strategy.
Here’s the bottom line: engagement rates above 3% put you in good company, but the real magic happens when you use these metrics to create content that genuinely connects with your audience. Don’t just chase the numbers – use them to build something meaningful.
