


Table of Contents
-
Understanding Revenue Calculator Fundamentals
-
Amazon FBA Revenue Calculator Specialization
-
Advanced Revenue Optimization Strategies
-
Technology Integration and Future Developments
TL;DR
-
Revenue calculators aren’t just fancy spreadsheets – they’re the secret weapon that separates thriving businesses from the ones barely scraping by
-
Amazon FBA calculators need to handle Amazon’s deliberately confusing fee structure, storage costs, and cutthroat competition
-
Advanced calculators use AI and predictive analytics to spot opportunities before your competitors even know they exist
-
Real-time data integration and cloud processing are game-changers for accuracy and strategic value
-
Getting this right means balancing user-friendly interfaces with sophisticated math that actually works
Understanding Revenue Calculator Fundamentals
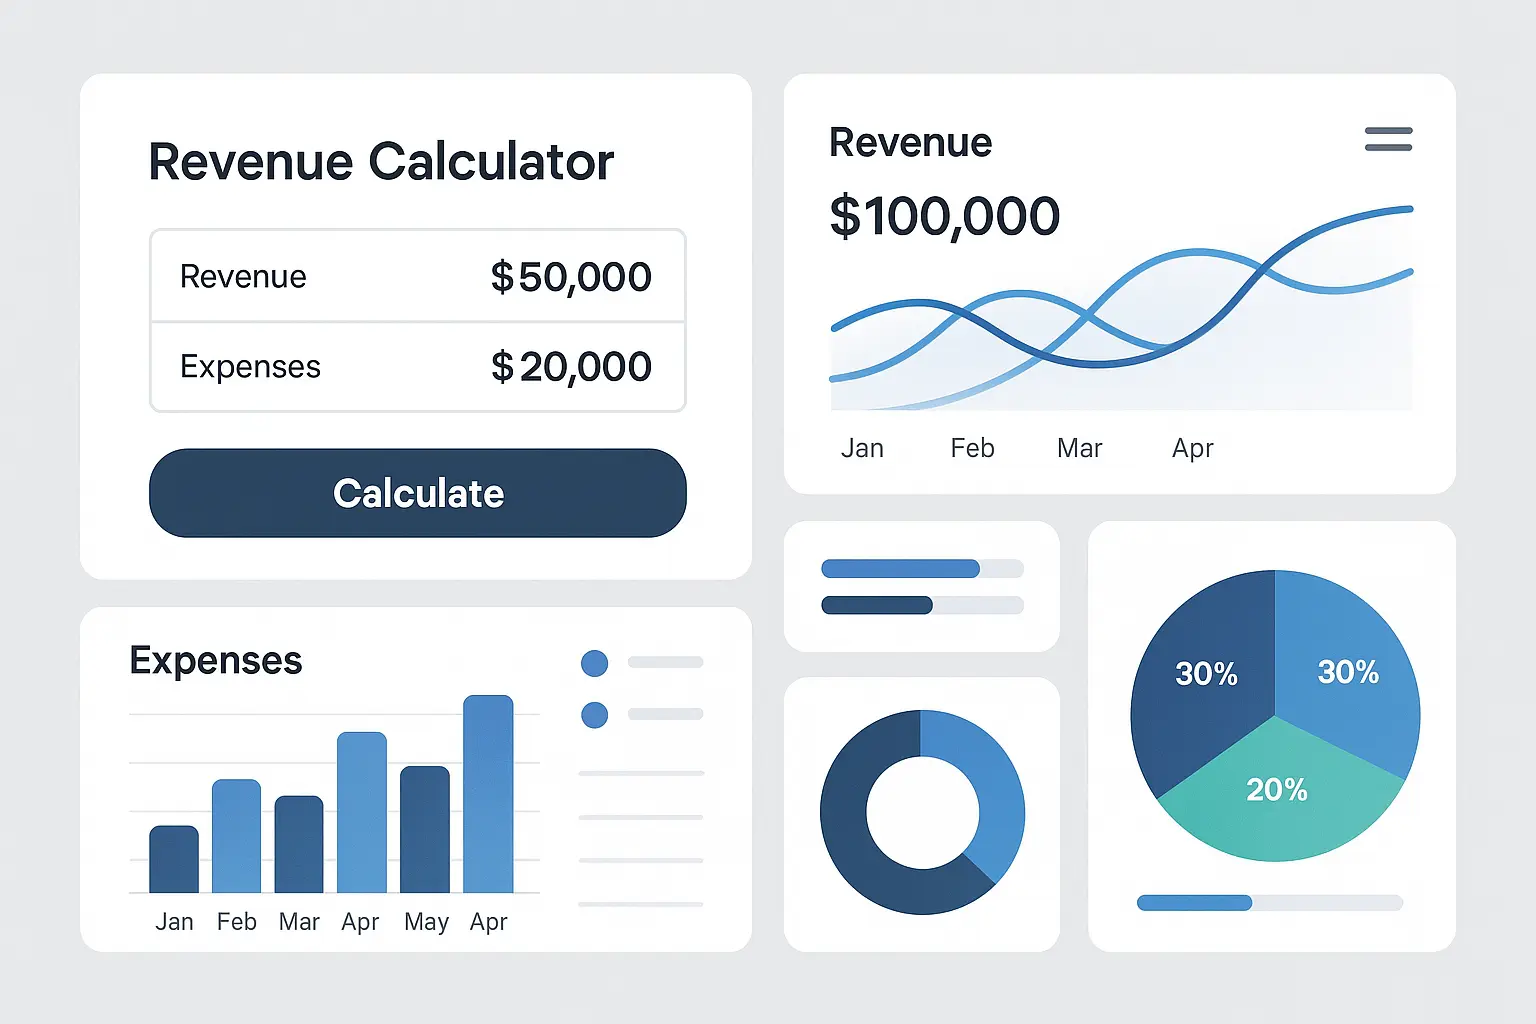
Look, I’ll be straight with you – most people think revenue calculators are just fancy spreadsheets. They’re dead wrong. After working with these tools for over a decade, I can tell you they’re actually the secret weapon that separates thriving businesses from the ones barely scraping by.
I’ve watched too many business owners treat sophisticated financial engines like basic multiplication machines, and it’s costing them serious money. These tools can transform complex financial data into clear, actionable insights, but only if you know how to use them properly.
When companies nail their pricing strategy, they can maximize total revenue at the sweet spot where demand elasticity equals -1. Omnicalculator’s revenue analysis shows how strategic price increases can boost revenue from $600 to $800 when you move from elastic to unitary elastic demand conditions. That’s real money we’re talking about.
The Mathematical Engine Behind Smart Business Decisions
Revenue = Price × Quantity sounds dead simple, right? I used to think the same thing until I started working with real businesses. That’s when I discovered that modern companies don’t operate on simple math anymore.
Here’s what I mean – I had this client running a subscription box service. Three different pricing tiers, seasonal demand that swung wildly, and customers who upgraded and downgraded constantly. Their “simple” calculator couldn’t handle any of it. We’re talking about a business losing actual money because they couldn’t accurately predict their revenue.
Similar to how businesses need sophisticated retail math calculations to optimize their pricing strategies, revenue calculators must handle complex mathematical relationships that go way beyond basic formulas.
Beyond Basic Formulas: Where Real Money Gets Made
The magic happens when you move beyond those basic formulas everyone learns in business school. I remember another client – a small manufacturer with volume discounts. Buy 100 units, get one price. Buy 500, get a better price. Buy 1,000, and suddenly you’re in a completely different pricing tier. Their old calculator treated everything like a flat rate. No wonder they were confused about which customers were actually profitable.
|
Pricing Model Type |
Complexity Level |
Calculator Requirements |
|---|---|---|
|
Fixed Price |
Low |
Basic multiplication |
|
Tiered Pricing |
Medium |
Volume-based calculations |
|
Dynamic Pricing |
High |
Real-time market data integration |
|
Subscription-based |
High |
Churn rate and MRR modeling |
|
Freemium |
Very High |
Conversion funnel analysis |
Subscription businesses face even crazier complexity. I’m working with a SaaS company right now where 60% of their Basic plan users ($29/month) upgrade to Professional ($99/month) within six months. But here’s the kicker – only 15% of Professional users ever upgrade to Enterprise ($299/month).
A basic calculator would miss this upgrade pattern completely. We’re talking about potentially underestimating annual revenue by 30-40%. That’s not a rounding error – that’s the difference between getting funding and going out of business.
And don’t even get me started on seasonal stuff. E-commerce businesses see massive holiday spikes, while B2B companies basically go into hibernation during summer. I’ve seen too many business owners get blindsided by these patterns because their calculators assumed steady growth all year long.
Statistical Modeling That Actually Works
This is where things get interesting (and where most businesses completely drop the ball). Statistical analysis isn’t just academic nonsense – it’s what transforms your calculator from a basic tool into something that can actually predict the future.
I implemented a system last year that uses probability distributions to model customer lifetime value. The accuracy improvements were insane. Instead of guessing that customers stick around for “about 18 months,” we could predict with 85% accuracy which customers would churn in the next 90 days.
Trend forecasting is another game-changer, but most people do it wrong. They just draw straight lines from historical data and call it good. The best systems I’ve built account for cyclical patterns, growth acceleration, and market maturity. I can actually spot when a trend is about to shift before it becomes obvious in the raw numbers.

Here’s something that’ll blow your mind – churn rate modeling. Most calculators treat customer retention like it’s a fixed percentage. “Oh, we lose 5% of customers every month.” But that’s garbage. Customer retention varies by segment, engagement level, and where they are in their lifecycle. Advanced models consider all these factors.
Data Quality: The Foundation Everything Builds On
I cannot stress this enough – garbage in, garbage out. I’ve watched companies make million-dollar strategic decisions based on flawed data, and it’s painful every single time.
Validation rules are your first line of defense. Price ranges, quantity limits, date validations – all the boring stuff that catches obvious errors before they mess up your calculations. But validation goes deeper than basic range checking. You need logical consistency between related fields.
Real-time market data integration keeps your calculations current. I see too many businesses using competitor prices from six months ago or industry benchmarks that are completely outdated. Markets move fast, and your calculator needs to keep up.
Error checking is where most people get lazy. If your revenue projection suddenly jumps 500% without any corresponding input changes, something’s seriously wrong. Smart calculators flag these situations automatically.
Choosing the Right Calculator for Your Business Model
This is where I see the biggest mistakes. People try to force-fit calculators into business models they weren’t designed for. I learned this the hard way trying to use a retail calculator for a SaaS business. Spoiler alert: it didn’t work.
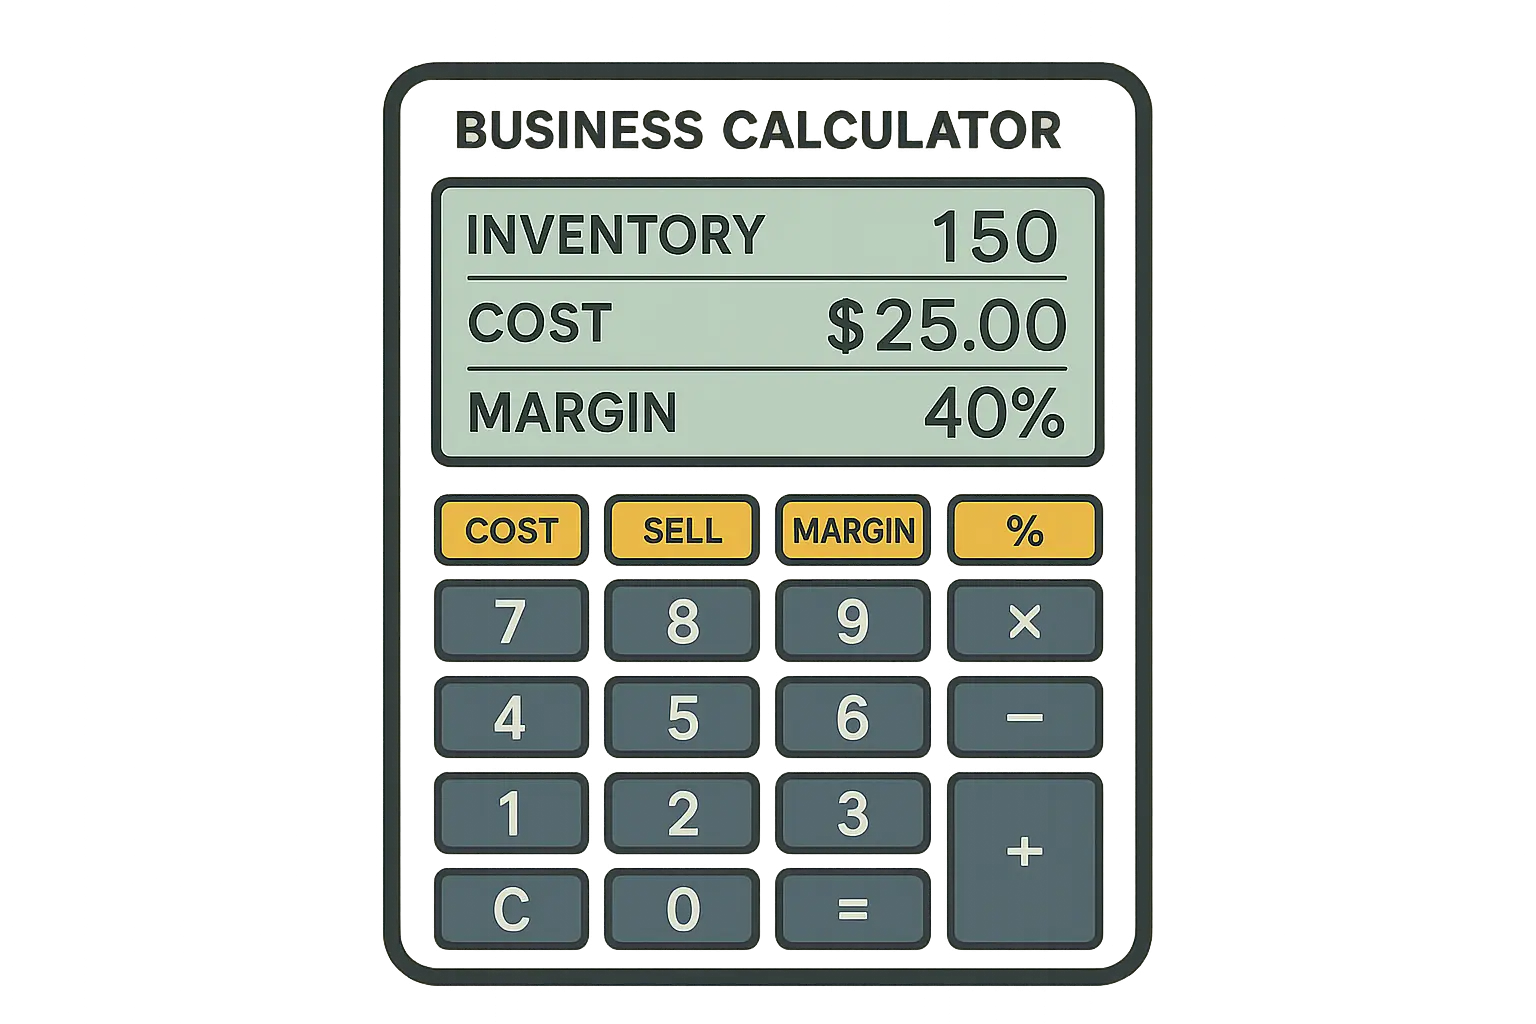
Traditional Business Calculations That Still Matter
Retail businesses need calculators that understand inventory turnover, markup percentages, and seasonal demand. Unit economics become crucial when you’re dealing with physical products that spoil, need storage, and cost money to ship.
Manufacturing is even more complex. Raw material costs fluctuate, production capacity has limits, and economies of scale kick in at different volumes. Fixed costs get distributed across production runs in ways that make break-even analysis tricky.
Service businesses face different headaches. Labor costs vary wildly based on skill levels and project complexity. Utilization rates matter more than material costs. Your calculator needs to understand these service-specific variables or you’re flying blind.
Break-even analysis gets sophisticated when you factor in multiple product lines, varying profit margins, and fixed cost allocations. The best traditional calculators show you exactly which products or services actually drive profitability.
Digital Business Models Need Different Math
Digital businesses operate on completely different financial principles, and this is where traditional calculators fall apart completely.
Customer acquisition costs (CAC) and lifetime value (LTV) ratios become more important than traditional profit margins. I worked with a SaaS company where understanding these metrics literally meant the difference between growth and bankruptcy. They were spending $200 to acquire customers worth $150. The math doesn’t work.
Recurring revenue calculations require sophisticated modeling of subscription behaviors. Monthly churn rates, annual prepayment discounts, upgrade and downgrade patterns – all of this affects revenue projections in ways that traditional calculators can’t handle.
Just as businesses need comprehensive market sizing analysis to understand their total addressable market, digital revenue calculators must incorporate market penetration rates and competitive positioning to provide accurate growth projections.
Freemium conversion modeling is its own special nightmare. What percentage of free users convert to paid plans? How long does conversion typically take? Which features drive conversion most effectively? These questions require calculators designed specifically for freemium models.
Customer acquisition cost relationships get complex when you consider multiple acquisition channels, varying conversion rates, and different customer segments. Digital calculators must track CAC by channel and customer type to provide actionable insights.
Implementation Strategy and Best Practices
User Experience That Actually Gets Used
I’ve seen powerful calculation engines sit unused because the interface was too confusing. The best calculators feel intuitive even when they’re doing sophisticated math behind the scenes.
Clear input fields with helpful labels make a huge difference. Instead of a generic “Price” field, use “Unit Price (excluding tax)” with a sample value like “$29.99”. These small details dramatically improve data quality and reduce user errors.
Instant feedback keeps users engaged and catches errors immediately. When someone enters a price that seems unusually high, the calculator should flag it right away, not wait for final submission.
Visual results matter way more than most people realize. Charts, graphs, and color-coded outputs help users understand implications quickly. Numbers alone don’t tell the story – people need visual representation to make insights actionable.
Progressive disclosure handles complexity gracefully. Start with basic inputs and reveal advanced options as needed. This approach serves both novice and expert users without overwhelming either group.
Implementation Checklist:
-
Design intuitive input forms with clear labels and examples
-
Implement real-time validation and error checking
-
Create visual result displays with charts and graphs
-
Test interface with actual users before deployment
-
Provide help documentation and tutorials
-
Establish user feedback collection system
-
Plan regular UI updates based on user behavior

Integration and Automation Capabilities
Integration capabilities determine whether your calculator becomes central to your business or just another isolated tool gathering digital dust.
CRM integration pulls customer data, purchase history, and segmentation information directly into calculations. This means your revenue projections reflect actual customer behavior instead of generic assumptions.
Accounting software connections provide real-time cost data and profit margins. When your calculator knows your actual costs, projections become much more accurate and actionable.
Analytics platform integration enables sophisticated reporting and trend analysis. Raw calculation results become part of broader business intelligence systems that drive strategic decisions.
Automated reporting saves time and ensures consistency. Instead of manually generating revenue reports, integrated calculators can produce scheduled reports that stakeholders receive automatically.
Maintenance and Calibration Protocols
Calculator maintenance isn’t optional – it’s essential for long-term accuracy. I’ve seen calculators become dangerously wrong because nobody bothered to maintain them.
Algorithm updates should happen quarterly at minimum. Compare your calculator predictions against actual results to identify drift or systematic errors. Market conditions change faster than most businesses realize.
Market data updates keep external factors current. Competitor pricing, industry benchmarks, and economic indicators all affect revenue calculations. Stale data leads to poor decisions.
Business rule adjustments reflect operational changes. New product lines, pricing strategies, or cost structures require calculator updates. Document these changes to maintain calculation transparency.
Accuracy verification compares calculator predictions with actual results. This feedback loop identifies systematic errors and improvement opportunities. The best calculators get more accurate over time through this calibration process.
Amazon FBA Revenue Calculator Specialization
Amazon FBA calculators operate in their own special universe where normal e-commerce rules don’t apply. I’ve worked with hundreds of FBA sellers, and the successful ones understand that generic revenue calculators are useless in Amazon’s ecosystem.
Amazon’s marketplace creates calculation challenges that don’t exist anywhere else. Fee structures change constantly, competition is cutthroat, and one mistake in your calculations can wipe out months of profits.
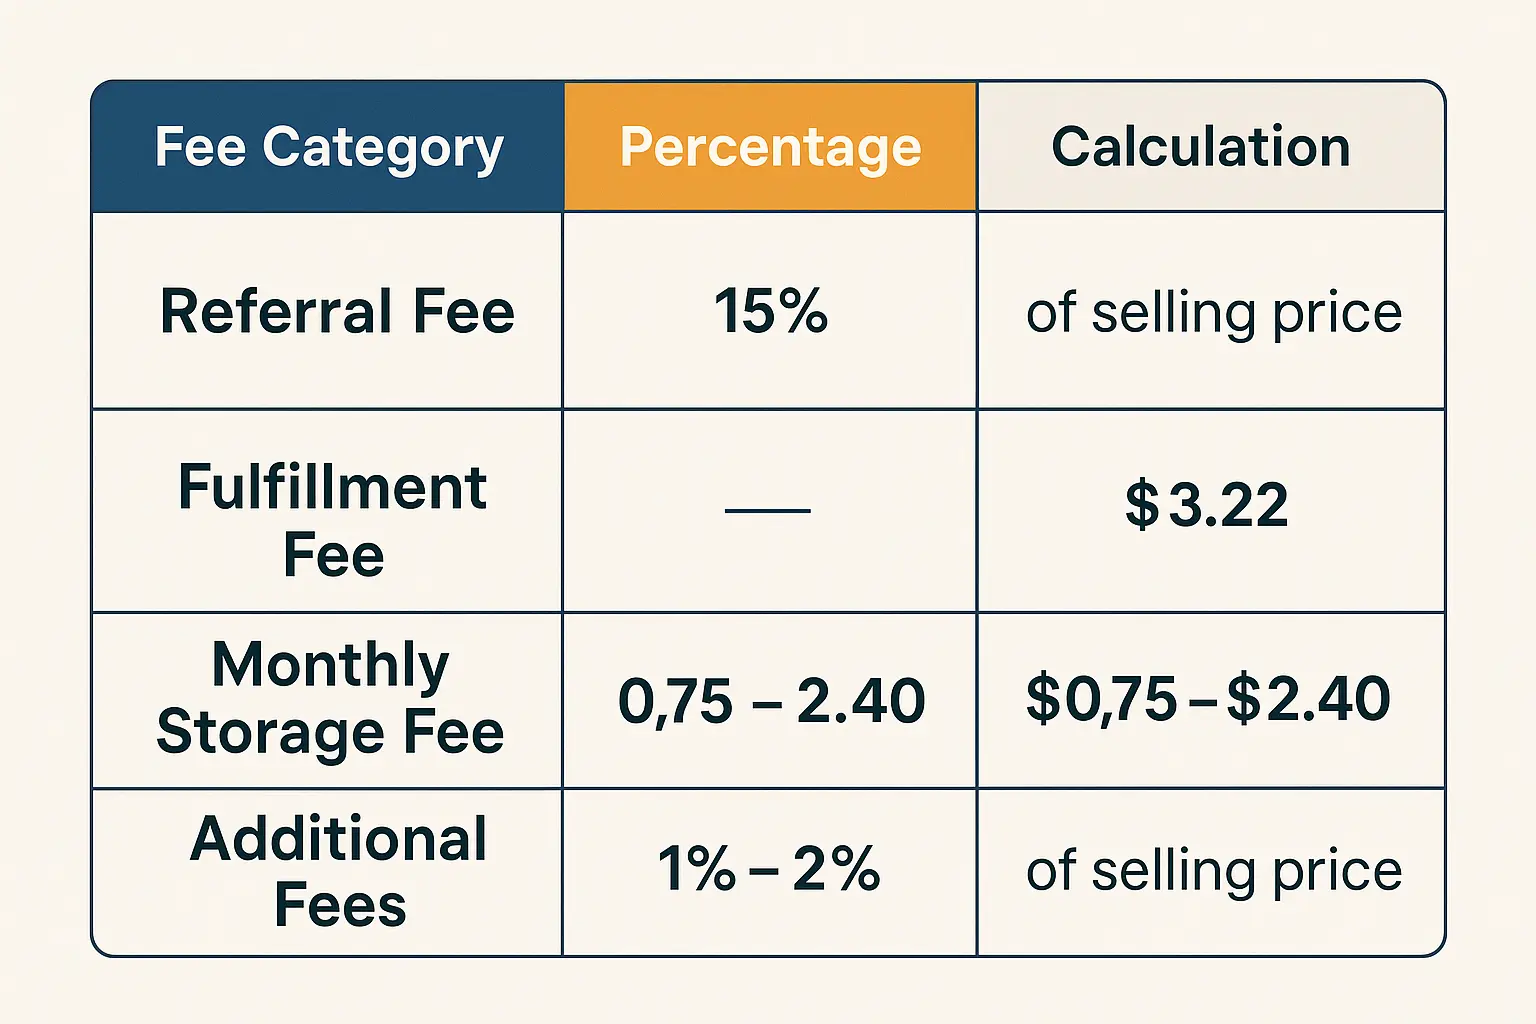
Decoding Amazon’s Complex Fee Structure
Amazon’s fee structure feels deliberately designed to confuse people, and honestly, it probably is. Referral fees vary by category, fulfillment fees depend on size and weight classifications, and storage fees change seasonally. Your fba revenue calculator needs to handle all these variables accurately or you’re going to lose money.
Category-Specific Fees That Make or Break Profitability
Referral fees range from 6% to 45% depending on your product category. Electronics might charge 8%, while jewelry hits 20%. These differences dramatically affect profitability, especially if you’re selling across multiple categories.
I had a seller compare two $25 products recently. The electronics accessory had 8% referral fees ($2.00), while the jewelry item had 20% referral fees ($5.00). That $3.00 difference per unit can mean the difference between profit and loss, especially when you factor in fulfillment costs.
Category-specific fee structures go way beyond simple percentages. Some categories have minimum fees, others have tiered structures based on price points. Books under $10 are calculated differently than books over $10. Your calculator must understand these nuances.
Professional selling plans add another layer of complexity. The $39.99 monthly fee gets distributed across your product sales, but the per-unit impact varies dramatically based on sales volume. Low-volume sellers face higher effective fees per unit.
Closing fees apply to media categories and vary by format. DVDs, CDs, and books each have different closing fee structures. These fees might seem small individually, but they add up quickly for high-volume sellers.
FBA Fulfillment and Storage: The Hidden Profit Killers
FBA fulfillment fees depend on size tiers that Amazon defines very specifically. Small standard, large standard, small oversize, medium oversize, large oversize, and special oversize – each has different fee structures. Get the classification wrong and your entire profit calculation is worthless.
Weight calculations affect fees more than most sellers realize. Amazon rounds up to the next pound for shipping weight, and dimensional weight can exceed actual weight for bulky items. Your f ba revenue calculator needs to handle both scenarios accurately.
Storage fees are where sellers get murdered. They vary dramatically by season – Q4 storage fees can triple your costs. I’ve watched sellers get completely blindsided by storage fee spikes that eliminated their holiday profits.
Long-term storage fees kick in after 365 days, but seasonal adjustments during Q4 can destroy your margins if you’re not prepared. Advanced calculators factor these performance-based costs into profitability projections.
Inventory performance metrics affect storage fees through the Inventory Performance Index (IPI). Poor IPI scores can result in storage limits or additional fees. You need calculators that understand these performance relationships.
Product Profitability Assessment Beyond Basic Math
Product profitability on Amazon involves factors that traditional retail never considers. Competition intensity, search ranking difficulty, seasonal demand patterns – all of this affects long-term viability. The most successful FBA sellers use calculators that account for these marketplace-specific variables.
Competitive Analysis Integration
Competitive pricing analysis becomes crucial when 20+ sellers offer similar products. Your calculator needs to understand where your price fits in the competitive landscape and how that affects sales velocity. Being the cheapest doesn’t always mean being the most profitable.
Market share analysis helps predict realistic sales volumes. If you’re entering a category with established players, your initial market share will likely be small. Calculators that factor in competitive market share provide more realistic revenue projections.
Buy Box competition affects sales dramatically. Amazon’s algorithm considers price, fulfillment method, seller metrics, and inventory levels when awarding the Buy Box. Your calculator should estimate Buy Box win rates based on competitive positioning.
Review velocity and rating analysis impact long-term competitiveness. Products with higher review rates and better ratings typically command premium pricing and higher sales volumes. Advanced calculators factor these quality metrics into revenue projections.
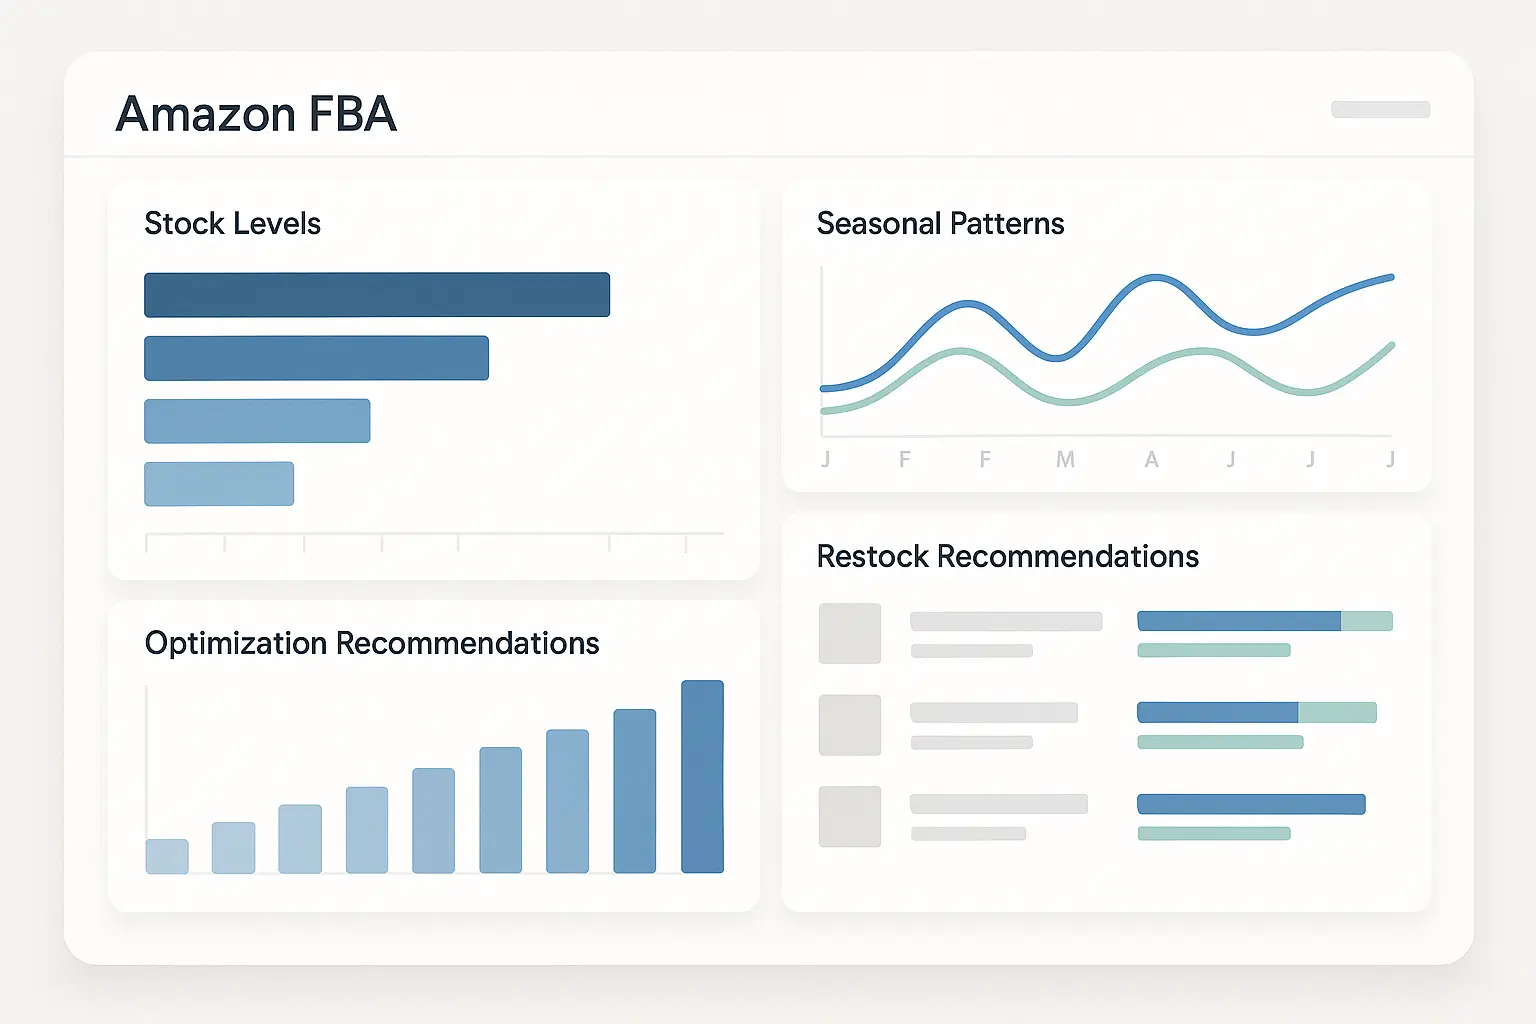
Inventory Management Optimization
Inventory optimization on Amazon requires balancing multiple competing factors. Too much inventory increases storage fees and ties up cash. Too little inventory results in stockouts and lost sales. Finding that sweet spot is crucial.
Seasonal demand patterns affect inventory planning significantly. Q4 sales might be 3x higher than Q1, but storage fees also increase during peak season. Optimal inventory levels change throughout the year based on these patterns. Lead times from suppliers affect reorder timing and safety stock requirements. International suppliers might require 60-90 day lead times, while domestic suppliers offer faster turnaround. Your calculator should factor these timing differences into inventory planning.
Cash flow considerations become critical for growing sellers. Inventory represents tied-up capital that could be invested in new products or marketing. Advanced calculators help balance growth opportunities against inventory investment requirements.
ROI and Break-Even Analysis for Long-Term Success
ROI calculations for FBA products must consider initial investment, ongoing advertising costs, and time to profitability. Product launch costs, photography, initial inventory, and PPC campaigns all affect your break-even timeline.
Advertising spend allocation requires sophisticated modeling. PPC costs vary by keyword competitiveness, and organic ranking improvements reduce advertising dependency over time. Your calculator should model this advertising cost curve.
Long-term profitability projections account for product lifecycle stages. New products require higher advertising spend, mature products face increased competition, and declining products need exit strategies. Each stage has different profitability characteristics.
Portfolio diversification analysis helps balance risk across multiple products. Some products provide steady cash flow while others offer high growth potential. Advanced calculators help optimize product mix for overall portfolio performance.
Advanced Revenue Optimization Strategies
This is where most businesses completely miss the boat. Advanced optimization strategies separate successful companies from those that struggle with reactive decision-making. I’ve implemented systems that don’t just calculate current revenue – they predict future scenarios and recommend strategic actions based on comprehensive data analysis.
Modern revenue calculators go way beyond basic math to provide strategic insights through scenario modeling, predictive analytics, and optimization recommendations that actually help you grow your business sustainably.
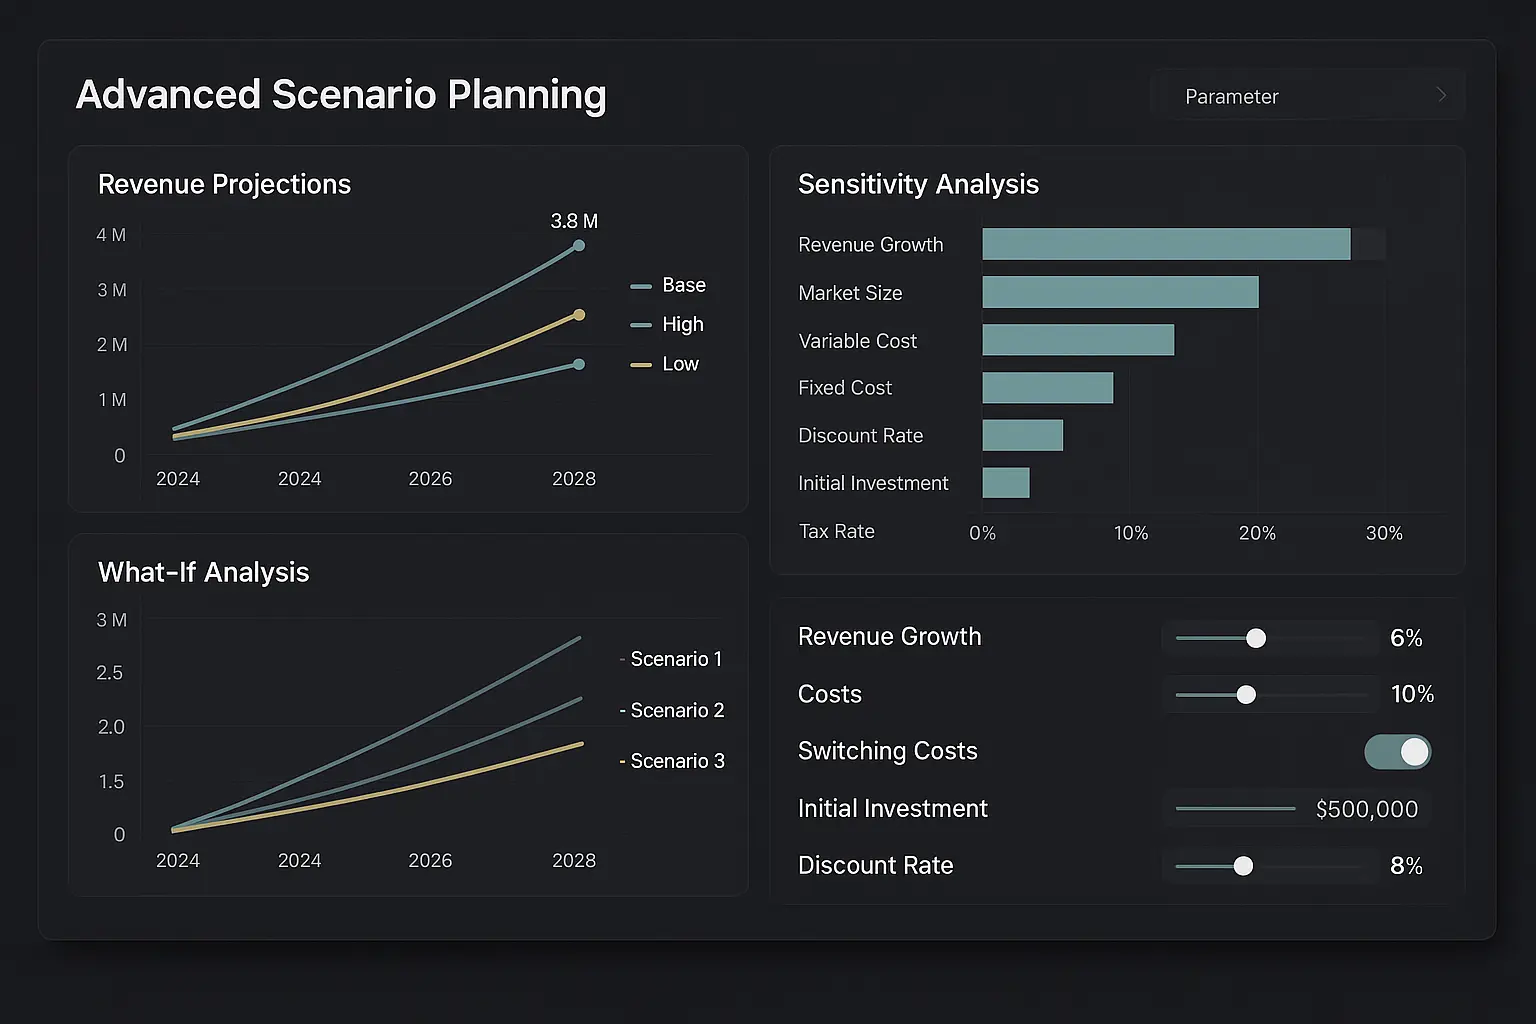
Scenario Planning and Sensitivity Analysis
Scenario planning transforms calculators from reporting tools into strategic planning platforms. What happens if your main competitor drops prices by 15%? How does a 20% increase in customer acquisition costs affect profitability? These questions require systems that can model multiple scenarios simultaneously.
High-growth companies like NVIDIA show the power of strategic revenue optimization, achieving remarkable revenue growth rates of 27.19% over five years, as reported by Omnicalculator’s revenue growth analysis. This shows how compound annual growth rate calculations can guide long-term strategic planning and investment decisions.
Market Condition Modeling
Economic downturns affect different business models differently. B2B companies might see delayed payment cycles, while consumer businesses face reduced discretionary spending. Your calculator should model these scenarios to help prepare contingency plans.
Seasonal pattern modeling goes beyond simple historical averages. Weather patterns, economic cycles, and cultural events all create seasonal variations that smart calculators can predict and incorporate into revenue projections.
Competitive scenario modeling helps prepare for market disruptions. New competitor entries, pricing wars, and technology shifts all affect revenue potential. Advanced calculators simulate these competitive scenarios to identify strategic responses.
Supply chain disruption scenarios have become increasingly important. Material shortages, shipping delays, and cost increases all impact revenue calculations. Modern calculators model these supply chain variables to provide realistic projections.
Price Elasticity Testing
Price elasticity analysis reveals how sensitive your customers are to price changes. Some products can handle 20% price increases with minimal volume loss, while others see dramatic demand drops with small price adjustments.
Customer segment analysis shows that price sensitivity varies dramatically across different buyer groups. Enterprise customers might be less price-sensitive than small businesses, while premium segments tolerate higher prices than value-conscious buyers.
Competitive price response modeling predicts how competitors will react to your pricing changes. Price wars can destroy profitability for entire categories, while strategic pricing can create sustainable competitive advantages.
Dynamic pricing optimization uses elasticity data to adjust prices automatically based on demand patterns, inventory levels, and competitive positioning. The most sophisticated calculators recommend optimal pricing strategies in real-time.
|
Business Scenario |
Revenue Impact |
Calculator Requirements |
|---|---|---|
|
Economic Recession |
-15% to -30% |
Economic indicator integration |
|
New Competitor Entry |
-10% to -25% |
Competitive analysis modeling |
|
Supply Chain Disruption |
-5% to -20% |
Cost variance calculations |
|
Seasonal Peak |
+25% to +200% |
Historical pattern analysis |
|
Price War |
-20% to -50% |
Elasticity modeling |
Predictive Analytics Integration
Predictive analytics represents the next evolution in revenue calculator technology. Instead of just processing current data, these systems learn from patterns to predict future outcomes with increasing accuracy.
Machine learning and AI capabilities transform traditional calculators into predictive tools that forecast trends, identify opportunities, and recommend strategic actions based on pattern recognition and data analysis that exceeds human analytical capabilities.
Trend Forecasting Algorithms
Machine learning algorithms identify trends that human analysts miss. Subtle patterns in customer behavior, seasonal variations, and market cycles become visible through sophisticated data analysis that processes thousands of variables simultaneously.
Leading indicator analysis helps predict revenue changes before they become obvious. Website traffic patterns, social media engagement, and search volume trends often precede sales changes by weeks or months.
Similar to how comprehensive analytics audits help businesses understand their data quality and tracking accuracy, revenue calculators require robust data foundations to provide reliable predictive insights.
Market cycle prediction uses economic indicators, industry data, and historical patterns to forecast business cycles. Understanding whether you’re entering a growth phase or approaching a downturn affects strategic planning significantly.
External factor integration incorporates weather data, economic indicators, and social trends into revenue forecasts. These external variables often explain revenue variations that internal data can’t account for.
Customer Behavior Prediction
Customer lifetime value prediction becomes more accurate when calculators analyze behavioral patterns rather than just historical averages. Purchase frequency, seasonal variations, and engagement levels all contribute to more precise LTV calculations.
Churn prediction models identify customers at risk of leaving before they actually churn. Early warning systems enable proactive retention efforts that cost less than acquiring new customers.
Purchase timing prediction helps optimize inventory and marketing campaigns. Knowing when customers are most likely to buy enables better resource allocation and improved conversion rates.
Cross-sell and upsell opportunity identification uses purchase history and behavioral data to predict which customers are most likely to buy additional products or upgrade to premium services.
Recent developments in tax policy, such as the UK’s consideration of partnership employer NICs reform, demonstrate how regulatory changes can impact revenue calculations, with potential tax increases of £6,000 for average GP partners earning £118,000, highlighting the importance of incorporating regulatory scenarios into advanced revenue modeling systems.
A subscription software company I work with uses predictive analytics to identify that customers who don’t engage with their platform within the first 14 days have an 85% churn probability. Their advanced calculator now factors this behavioral pattern into LTV calculations, reducing projected customer value by 40% for low-engagement signups and helping optimize onboarding investments for maximum retention.
Market Opportunity Identification
Market gap analysis identifies underserved customer segments or product categories where competition is limited but demand exists. These opportunities often provide the highest profit potential for expansion efforts.
Emerging trend identification uses social media data, search trends, and early adoption patterns to spot opportunities before they become mainstream. Early movers in emerging markets often capture disproportionate market share.
Geographic expansion analysis evaluates new market opportunities based on demographic data, competitive intensity, and local market conditions. Not all markets are equally attractive for expansion.
Product development opportunities emerge from customer feedback analysis, support ticket patterns, and feature request data. Understanding what customers want but can’t find helps guide product development investments.
Technology Integration and Future Developments
Technology integration is transforming revenue calculators from static tools into dynamic business intelligence platforms. The calculators I’m implementing today would have been science fiction just five years ago.
The evolution of revenue calculators involves integration with emerging technologies, real-time data processing, and artificial intelligence to provide increasingly sophisticated and accurate business insights that adapt to changing market conditions and business requirements.
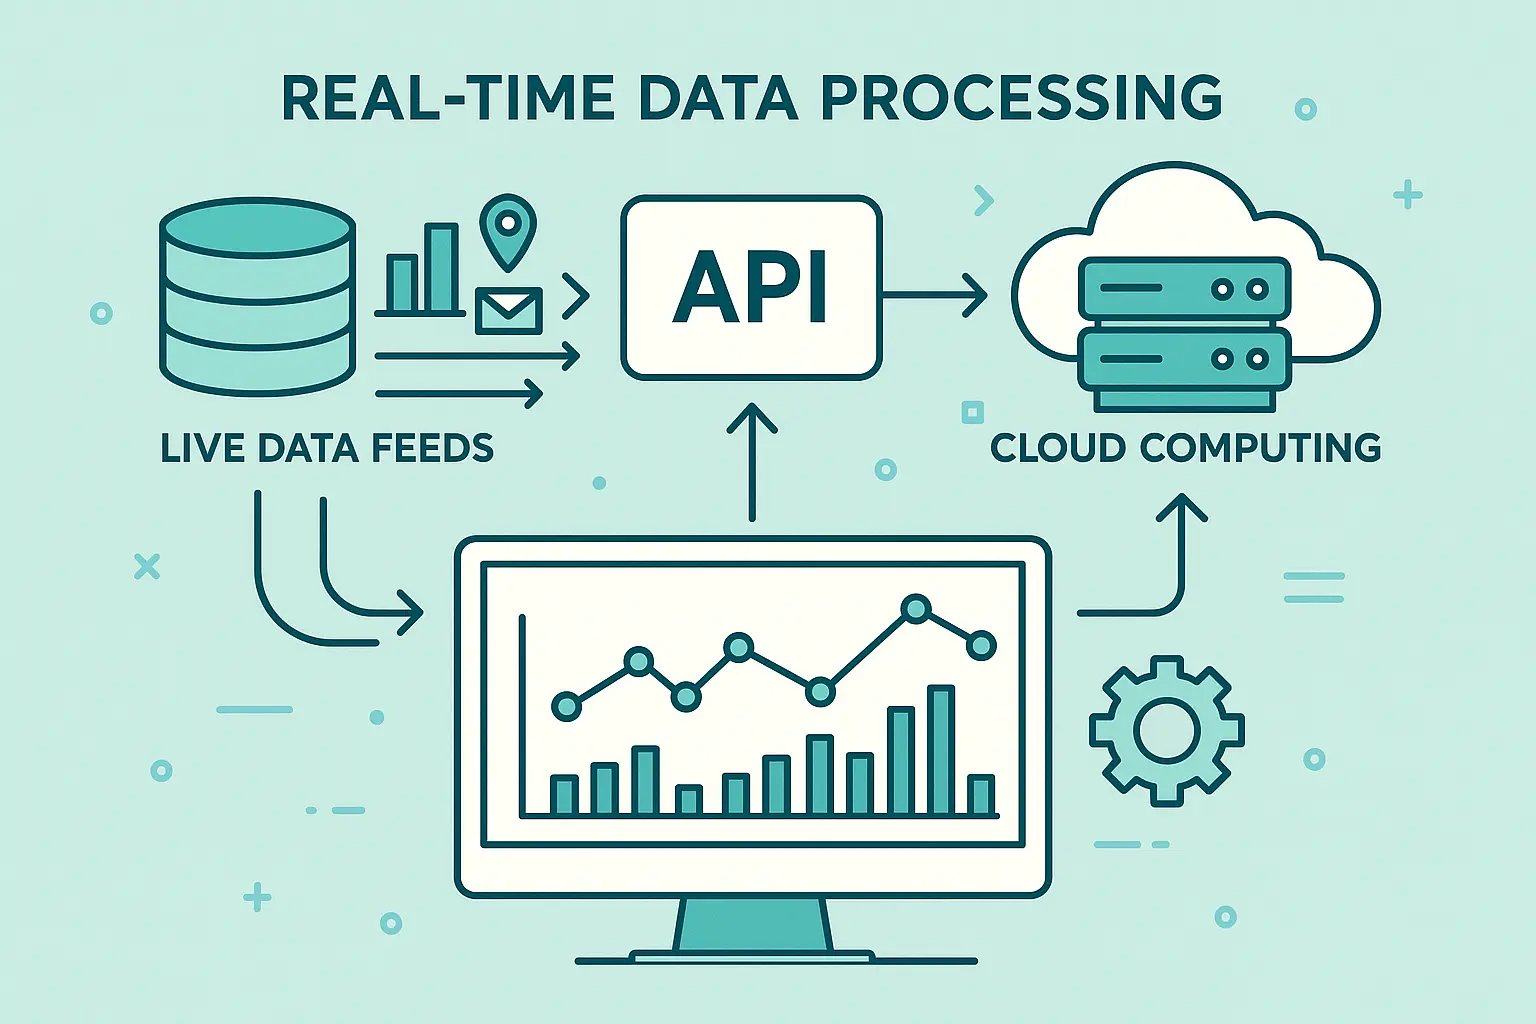
Real-Time Data Processing
Real-time data processing eliminates the lag time that makes traditional calculators less useful for fast-moving businesses. When market conditions change rapidly, outdated calculations can lead to costly strategic mistakes.
Modern calculators leverage live data feeds, API integrations, and cloud computing to provide up-to-the-minute accuracy and immediate strategic insights that reflect current market conditions rather than outdated historical information.
API Integration Capabilities
API integrations create seamless data flow between your calculator and existing business systems. Shopify, WooCommerce, Amazon Seller Central, and payment processors all provide APIs that enable automatic data synchronization.
Payment processor integration provides real-time transaction data, refund rates, and chargeback information that affects net revenue calculations. This data updates automatically without manual intervention.
Marketing platform integration pulls advertising spend, conversion rates, and campaign performance data directly into revenue calculations. Google Ads, Facebook Ads, and email marketing platforms all provide valuable data for revenue optimization.
Customer service integration incorporates support ticket data, satisfaction scores, and retention metrics into customer lifetime value calculations. These operational metrics significantly affect long-term revenue projections.
Cloud-Based Processing Power
Cloud computing enables calculations that would overwhelm traditional desktop applications. Processing millions of transactions, analyzing competitor data, and running complex scenarios requires computational power that scales with your needs.
Scalable performance means your calculator grows with your business. Whether you’re processing 100 transactions or 100,000, cloud-based systems maintain fast response times and reliable performance.
Global data processing enables real-time calculations across multiple time zones and currencies. International businesses need calculators that handle currency fluctuations, tax variations, and regional market differences.
Backup and disaster recovery ensure your calculation systems remain available even during technical failures. Cloud-based systems provide redundancy that protects against data loss and system downtime.
Artificial Intelligence Enhancement
Artificial intelligence is revolutionizing revenue calculator functionality by adding learning capabilities that improve over time. These systems don’t just process data – they understand patterns and make intelligent recommendations.
AI integration transforms calculators from static tools into intelligent advisors that learn from patterns, suggest optimizations, and continuously improve their accuracy through machine learning algorithms that adapt to changing business conditions.
Machine Learning Optimization
Machine learning algorithms continuously refine their calculations based on actual results. When predictions don’t match reality, the system learns from these discrepancies and adjusts future calculations accordingly.
Pattern recognition identifies relationships between variables that aren’t obvious to human analysts. Customer behavior patterns, seasonal variations, and market correlations become visible through machine learning analysis.
Just as continuously learning AI systems adapt and improve their performance over time, modern revenue calculators use machine learning to refine their accuracy and provide increasingly valuable business insights.
Anomaly detection flags unusual patterns that might indicate problems or opportunities. Sudden changes in conversion rates, unexpected demand spikes, or unusual cost variations all trigger alerts for investigation.
Predictive model improvement happens automatically as more data becomes available. The longer these systems run, the more accurate their predictions become through continuous learning and refinement.

Natural Language Processing
Natural language interfaces make advanced calculations accessible to non-technical users. Instead of learning complex formulas, users can ask questions like “What happens if we increase prices by 10%?” and get comprehensive answers.
Conversational analytics enable interactive exploration of revenue data. Users can ask follow-up questions, request different scenarios, and drill down into specific metrics through natural conversation.
Automated report generation creates narrative explanations of calculation results. Instead of just showing numbers, AI systems explain what the results mean and recommend specific actions based on the analysis.
Voice interface integration allows hands-free interaction with calculation systems. This capability is particularly valuable for mobile users and busy executives who need quick insights without typing.
The IRS Tax Withholding Estimator demonstrates how government agencies are implementing sophisticated calculators to help individuals optimize their tax strategies, as noted in the IRS guidance, showing how even regulatory tools are evolving to provide personalized financial calculations that adapt to individual circumstances and changing tax laws.
Similar to how businesses need advanced AI optimization tools to stay competitive in search rankings, revenue calculators increasingly rely on artificial intelligence to provide accurate predictions and strategic recommendations that human analysis alone cannot deliver.
Revenue Calculator Implementation Template:
Phase 1: Planning (Weeks 1-2)
-
Define business model requirements
-
Identify key revenue variables
-
Map existing data sources
-
Select integration platforms
-
Design user workflow
Phase 2: Development (Weeks 3-6)
-
Build calculation engine
-
Create user interface
-
Implement data validation
-
Establish API connections
-
Test accuracy against historical data
Phase 3: Deployment (Weeks 7-8)
-
Train user teams
-
Deploy to production
-
Monitor initial performance
-
Collect user feedback
-
Document maintenance procedures
Phase 4: Optimization (Ongoing)
-
Review calculation accuracy monthly
-
Update market data quarterly
-
Enhance features based on usage
-
Calibrate algorithms annually
-
Plan technology upgrades
How can The Marketing Agency help you implement these advanced revenue calculation strategies? Our data-driven approach to digital marketing aligns perfectly with sophisticated revenue optimization. We provide PPC management ($750-$5,000/month) that optimizes advertising spend based on calculated profit margins, and inbound marketing solutions ($500-$3,000/month) that improve conversion rates and customer lifetime value calculations. Our scientific methodology ensures your revenue calculators aren’t just implemented, but optimized for maximum strategic value through comprehensive market analysis and performance tracking.
Final Thoughts
Revenue calculators have evolved from simple mathematical tools into sophisticated business intelligence platforms that drive strategic decision-making across all business models. Success requires understanding not just the calculations themselves, but the strategic implementation, ongoing optimization, and technology integration that transforms these tools into competitive advantages.
I’ve watched companies transform their profitability by implementing sophisticated calculation systems that go far beyond basic math. The difference between businesses that thrive and those that struggle often comes down to the quality of their revenue insights.
The future belongs to businesses that can process complex data quickly and make strategic decisions based on accurate projections. Whether you’re running traditional retail, managing Amazon FBA, or scaling a SaaS platform, your revenue calculator should be central to your strategic planning process.
Technology will continue advancing these tools, but the fundamental principle remains constant: better data leads to better decisions. Invest in understanding your revenue mechanics, implement calculators that match your business model, and continuously optimize based on actual results. Your future profitability depends on getting these calculations right.
