


Here’s what’ll keep you up at night: according to Toolio’s retail math research, return rates in apparel can hit 20% to 30%, while online sales see about 25% return rates compared to just 3% for physical stores. This isn’t just some interesting statistic—it shows you exactly why mastering retail math isn’t just helpful, it’s absolutely critical if you want to stay in business.
Table of Contents
-
Understanding the Financial Foundation: Core Metrics That Matter
-
Mastering Markup and Margin Mathematics
-
Inventory Valuation Methods That Impact Your Bottom Line
-
Advanced Pricing Strategies for Maximum Profitability
-
Inventory Performance Analysis and Turnover Optimization
-
Sales Performance Metrics That Drive Growth
-
Digital Integration and Omnichannel Analytics
-
Building Essential Retail Math Skills
-
Why Retail Math Determines Business Success or Failure
-
Final Thoughts
TL;DR
-
Retail math isn’t just number-crunching—it’s literally the difference between keeping your doors open and going out of business
-
Getting markup vs. margin calculations wrong will cost you thousands in lost profits (trust me, I’ve been there)
-
Inventory turnover rates show you how fast your money converts to sales and back to cash flow
-
ABC analysis helps you focus on the 20% of products that drive 80% of your profits
-
Sales per square foot optimization squeezes revenue from every inch of retail space
-
Cross-channel attribution tracks customer journeys across digital and physical touchpoints
-
You need solid calculation skills in percentages and ratios—these are daily survival tools
-
Strategic retail math prevents cash flow disasters and keeps you competitive in brutal markets
Understanding the Financial Foundation: Core Metrics That Matter
The Numbers That Make or Break Your Business
Look, I’m going to be straight with you—you can’t run a store on gut feelings and crossed fingers. I learned this lesson the expensive way when I thought I could just “feel” my way through pricing decisions. Spoiler alert: feelings don’t pay the bills.
Here’s the thing that’ll blow your mind: a 50% markup doesn’t give you 50% profit. I know, I know—it sounds crazy, but this one misunderstanding has killed more businesses than I care to count. I’ve literally watched store owners celebrate what they thought were huge profits, only to discover months later they were barely scraping by.
When people ask me what retail math actually is, I tell them it’s basically using numbers to stop making stupid decisions with your money. Understanding what is retail math becomes crucial at this foundational level—it’s the systematic use of simple math to make smart decisions about pricing, inventory management, and profitability analysis across all aspects of retail operations.
Modern retail math increasingly relies on creating continuously learning systems that adapt pricing strategies based on real-time market data and customer behavior patterns. These systems help retailers stay competitive while maintaining healthy profit margins.
Why Most Retailers Get the Math Wrong
The brutal truth? Most retailers mess this up from day one because they confuse basic terms. When someone says they want “50% profit,” do they mean markup or margin? Trust me, the difference will cost you thousands if you get it wrong.
I’ve seen business owners throw parties because their sales went up 20%, while their actual profits tanked because they didn’t understand how everything connects. Your pricing affects your inventory turnover, which messes with your cash flow, which determines whether you can even afford to restock. It’s all connected, and that’s where things get interesting.
I’ve watched retailers celebrate increased sales volumes while their actual profits declined because they didn’t account for the relationship between price reductions and margin compression. The math doesn’t lie, but it’ll definitely humble you if you don’t respect it.
|
Metric |
Formula |
Why You Care |
|---|---|---|
|
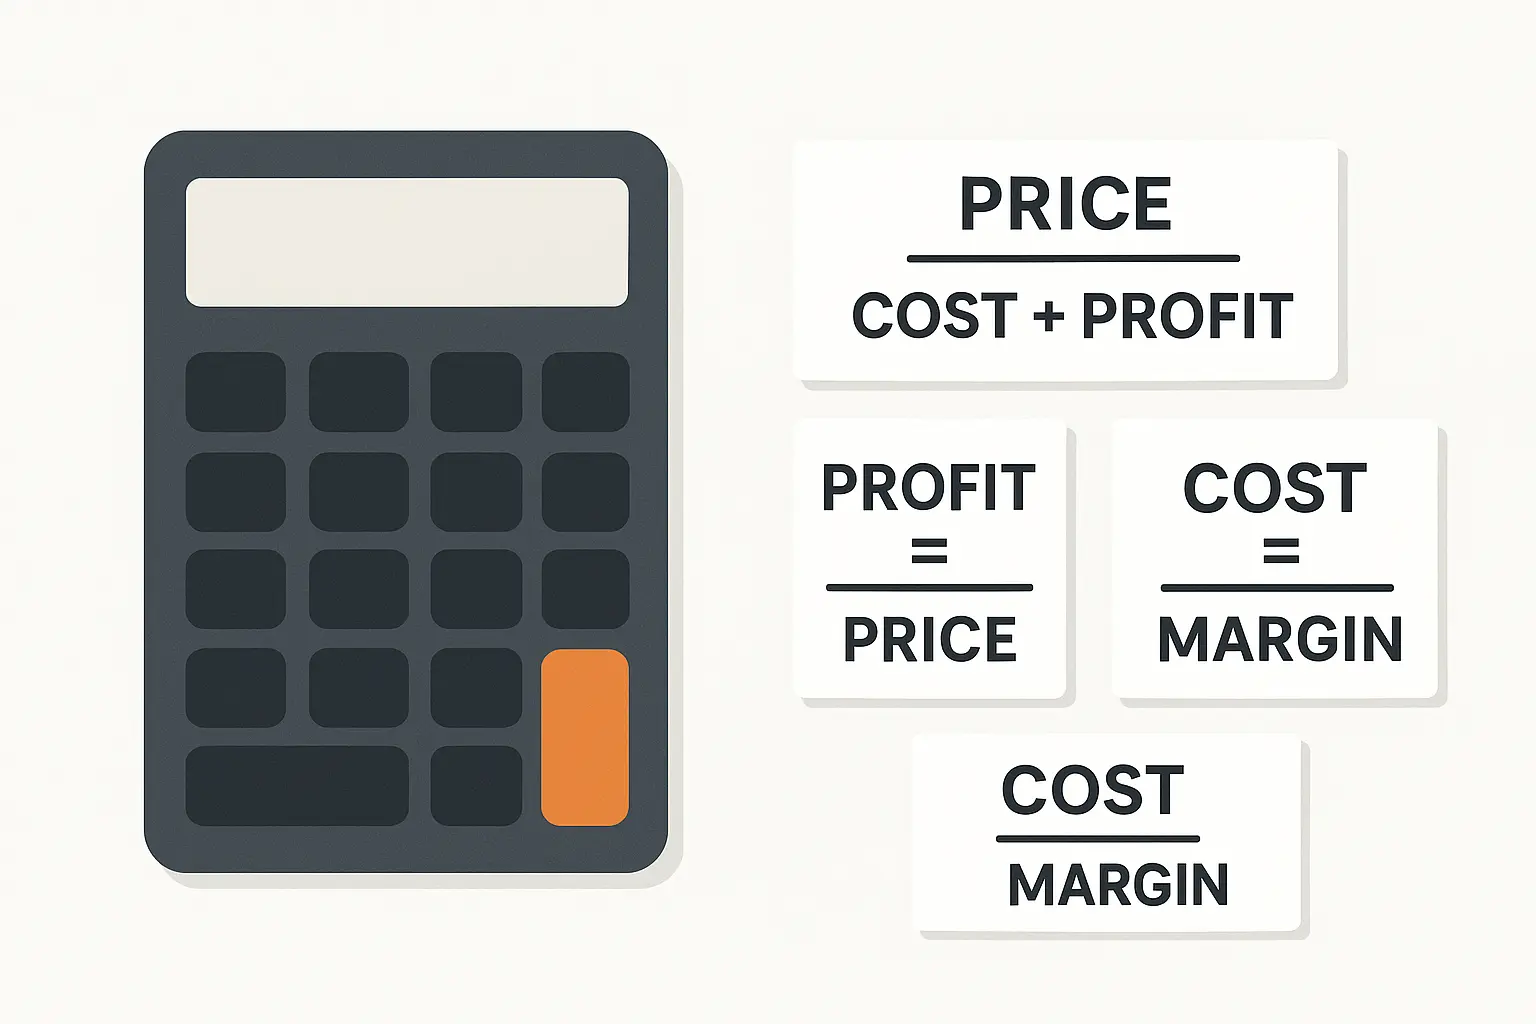
Markup % |
(Selling Price – Cost) ÷ Cost × 100 |
Shows how much you’re bumping up from cost |
|
Margin % |
(Selling Price – Cost) ÷ Selling Price × 100 |
Your actual profit slice of each sale |
|
Gross Margin |
(Net Sales – COGS) ÷ Net Sales × 100 |
The big picture of your profitability |
|
Break-even Point |
Fixed Costs ÷ (Selling Price – Variable Cost) |
How many units you need to sell to stop bleeding money |
Mastering Markup and Margin Mathematics
Cost-Based Pricing That Actually Works
Okay, this is where most people’s brains start smoking, but stick with me because getting this wrong will absolutely destroy your business.
Here’s the deal: markup and margin are NOT the same thing, even though everyone uses them like they are. I made this mistake for months before someone finally set me straight, and it cost me big time.
Let’s say you buy something for $10 and want a 50% markup. Easy math, right? $10 × 1.5 = $15 selling price. But here’s the kicker—your actual profit margin on that $15 sale is only 33.3%. Yeah, you read that right. The margin formula is ($15 – $10) ÷ $15 = 33.3%.
This isn’t just math nerd stuff—this difference will make or break your cash flow projections. I’ve watched retailers plan for 50% margins and then wonder why they’re always short on cash. The math doesn’t lie, but it’ll definitely humble you.
The retail math formulas I use for cost-based pricing eliminate this confusion through a four-step process that actually works:
-
Figure out your TRUE wholesale cost (don’t forget shipping, duties, all that hidden stuff)
-
Decide on your target margin percentage (not markup—margin!)
-
Work backwards: Selling Price = Cost ÷ (1 – Margin %)
-
Double-check by calculating both markup and margin to make sure you didn’t mess up
This approach ensures you hit your profit targets consistently while maintaining pricing discipline across your entire product range.
Real Example That’ll Make This Click: I know a clothing retailer who buys jackets for $40 each (all costs included). She wants a 60% gross margin. Using the reverse formula: Selling Price = $40 ÷ (1 – 0.60) = $40 ÷ 0.40 = $100. That $100 price gives her exactly 60% margin: ($100 – $40) ÷ $100 = 60%. The markup? A whopping 150%: ($100 – $40) ÷ $40 = 150%.
Strategic Margin Optimization Techniques
Different products deserve different treatment—I learned this when I slapped the same markup on everything and watched my high-volume items become uncompetitive while my specialty stuff stayed underpriced. Not smart.
Category-based margin targeting recognizes that different product types serve different purposes in your business. Your high-traffic items might need thinner margins to get people in the door, while your unique products can command premium margins because nobody else has them.
Competitive margin analysis requires ongoing market research, but it’s worth the effort. You need to understand competitor pricing and their likely cost structures. This intelligence helps you identify opportunities where you can either undercut competition profitably or justify premium pricing through superior value.
Dynamic pricing adjustments respond to market conditions, inventory levels, and seasonal demand patterns. The math here gets complex, but the basic principle remains simple: optimize margins based on current market dynamics rather than static formulas that ignore reality.
Break-Even Analysis for Real-World Decisions
Break-even analysis answers the question that keeps you up at night: “How much do I need to sell before I stop losing money?”
The basic retail math formula looks simple—Fixed Costs ÷ (Selling Price – Variable Cost per Unit) = Break-Even Units. But real-world applications require more nuanced thinking about cost structures and market realities.
Here’s what I actually do: I list out every fixed cost (rent, insurance, base salaries—stuff that doesn’t change with sales), then figure out variable costs per unit (product cost, commissions, transaction fees). Then I can see exactly how many units I need to move to break even.
But here’s the real power move—I use this analysis before I change prices. If dropping prices 10% means I need 25% more sales to make the same profit, I can honestly assess whether that’s realistic given my customer base and marketing budget.
The analysis also reveals the impact of operational changes. Adding a part-time employee increases fixed costs, which raises your break-even point. But if that employee enables extended hours that generate additional sales, the math might justify the investment.
Retail Math Skills Checklist:
-
Calculate markup percentages accurately without a calculator
-
Convert between markup and margin percentages instantly
-
Perform break-even analysis for new products and promotions
-
Evaluate promotional pricing impact before implementing
-
Assess volume discount opportunities realistically
-
Compare pricing strategies across categories systematically
Inventory Valuation Methods That Impact Your Bottom Line
FIFO vs LIFO: More Than Accounting Jargon
Alright, this is where things get a bit technical, but bear with me because this stuff directly affects your tax bill and your reported profits.
FIFO versus LIFO isn’t just accounting mumbo-jumbo—it’s real money in your pocket or Uncle Sam’s. FIFO (First-In-First-Out) assumes you sell your oldest stuff first, which makes sense because that’s usually what you actually do. LIFO (Last-In-First-Out) assumes you sell your newest inventory first.
During inflation, FIFO makes your profits look higher because you’re matching current sales prices with older, cheaper costs. Sounds good until tax time, when you owe more because your profits look better on paper. LIFO does the opposite—higher costs matched against sales, lower reported profits, smaller tax bill.
I’ve seen retailers save serious cash by switching to LIFO during inflationary periods, but it’s not always the right move. You need to think about your specific situation and maybe talk to an accountant who actually understands retail.
Most retailers find FIFO more intuitive because it matches actual physical inventory flow. You typically do sell older products first to avoid spoilage or obsolescence. But the financial implications of each method require careful consideration based on your specific cost trends and tax situation.
The recent tariff volatility demonstrates why inventory valuation becomes critical during price fluctuations. As “Modern Retail” reported, brands scrambled to recalculate pricing after tariffs dropped from 145% to 30%, with companies reducing their tariff surcharge from $4 to $1. This type of rapid cost change makes inventory valuation method selection crucial for accurate financial reporting.
Weighted Average Cost: The Balanced Approach
Weighted average cost is like the Switzerland of inventory valuation—it splits the difference and keeps things steady. Every time new inventory comes in, it recalculates an average cost for everything.
If you have 100 units at $10 each and buy 50 more at $12 each, your new average is $10.67 per unit ((100 × $10 + 50 × $12) ÷ 150 units).
This method keeps your costs stable, which makes pricing decisions easier because you’re not dealing with wild swings every time costs change. The smoothing effect particularly benefits retailers with frequent price changes or multiple suppliers for the same products.
However, weighted average cost can hide important trends that should trigger pricing adjustments. The averaging effect might delay recognition of significant cost increases that should prompt immediate action.
Shrinkage and Loss: The Hidden Profit Killer
Here’s something that’ll make you sick to your stomach—shrinkage costs retailers over $60 billion annually. That’s inventory that just disappears without generating a single sale.
The math is simple but painful: (Book Inventory – Physical Inventory) ÷ Book Inventory × 100 = Shrinkage Percentage. But understanding where it comes from helps you fight back.
Employee theft usually tops the list, followed by shoplifting, then administrative errors (yeah, your own mistakes), and vendor fraud. Each one needs different prevention strategies and has different cost implications.
Don’t overlook administrative errors—receiving mistakes, pricing screw-ups, system glitches. I’ve seen “phantom inventory” inflate book values by thousands of dollars. Regular cycle counting catches this stuff before it compounds.
The real kick in the teeth? You’ve already paid for products that generate zero revenue. High shrinkage can turn profitable categories into losers. That’s why I build shrinkage assumptions right into my pricing to make sure I still hit my margin targets even after expected losses.
According to Toolio’s retail math analysis, markup percentages in apparel retail typically range from 100%-150% in wholesale relationships and can reach as high as 500% for vertically integrated retailers, demonstrating the significant variation in pricing strategies across different retail models and the importance of understanding your specific cost structure.
Advanced Pricing Strategies for Maximum Profitability
Price Elasticity: Understanding Customer Response
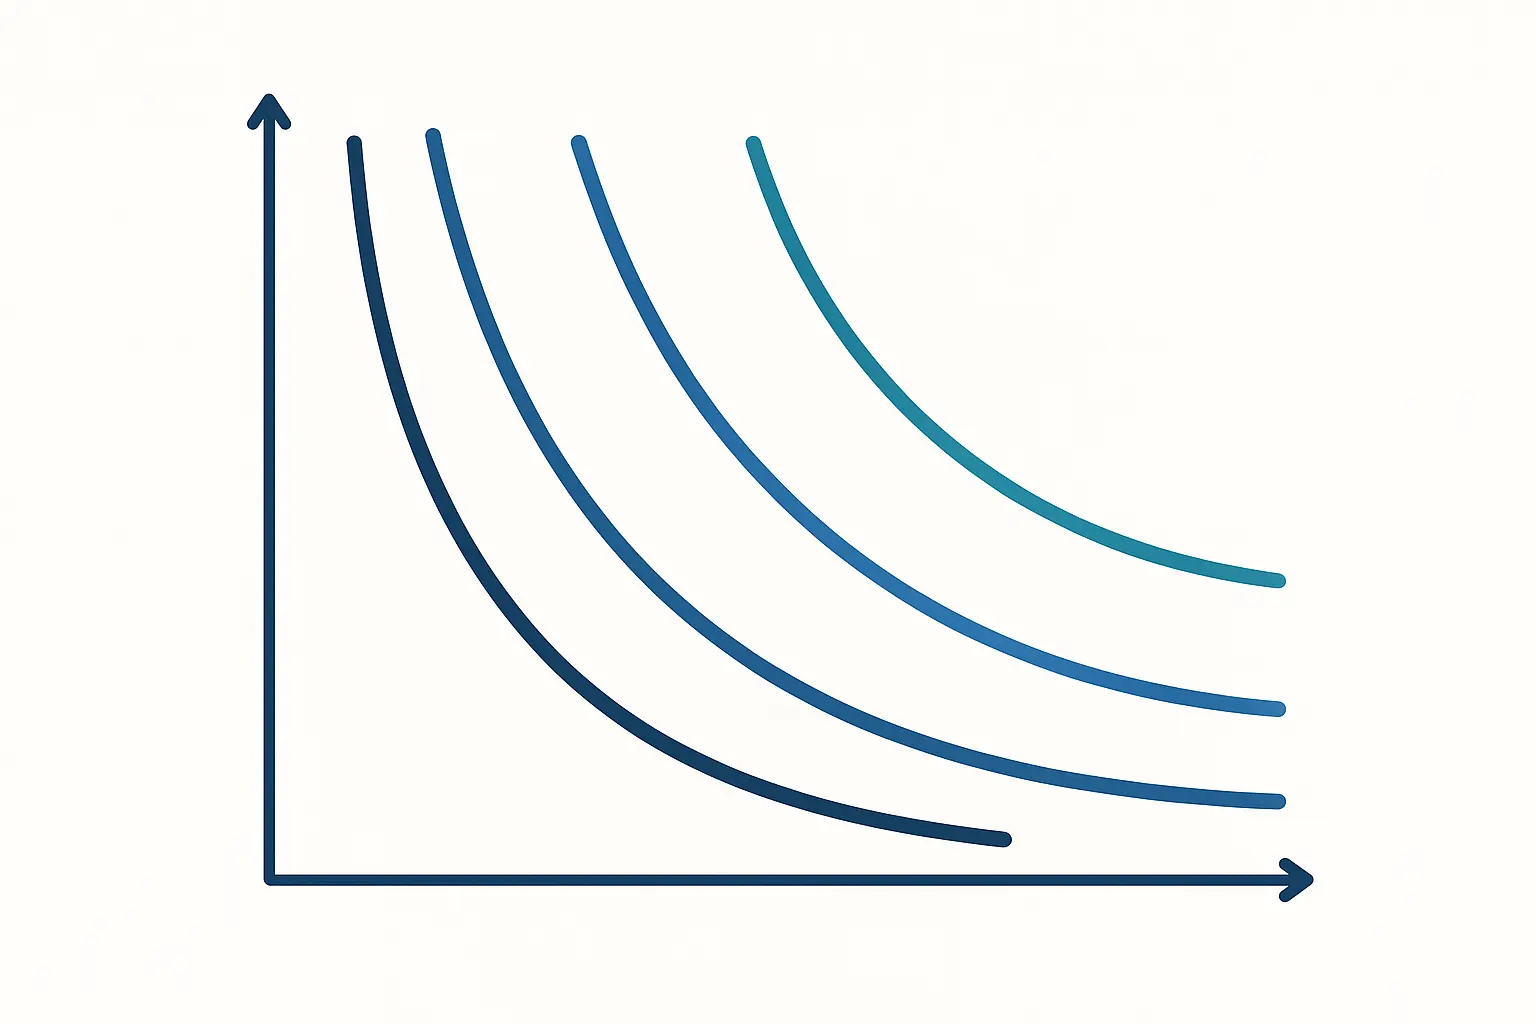
Price elasticity sounds fancy, but it’s really just measuring how much your customers freak out when you change prices. Some products can handle price increases without losing many customers (inelastic), while others see huge drops in sales with small price bumps (elastic).
Here’s the math: if a 10% price increase causes a 5% drop in sales, your elasticity is -0.5. If the same increase only drops sales by 2%, you’re at -0.2. Products between 0 and -1 (inelastic demand) can usually handle price increases because customers won’t reduce purchases proportionally.
Essential items, unique products, and convenience purchases often handle price increases well. Luxury items, discretionary stuff, and products with lots of alternatives usually don’t (elastic demand with coefficients less than -1).
I I test this carefully with small price adjustments on selected products while watching sales volume, customer complaints, and what competitors do. This gives me real data instead of guesses about how my customers will actually respond.
Understanding elasticity also helps with promotional pricing. If demand is highly elastic, temporary price reductions can generate significant volume increases that more than offset the margin reduction.
Competitive Positioning Through Mathematical Analysis
Competitive pricing isn’t about matching every price—it’s about knowing where you can compete on price and where you need to compete on value.
I map out competitors based on price and perceived value to find profitable gaps in the market. Premium positioning requires superior value delivery, while discount positioning demands operational efficiency that your competitors can’t match.
Mathematical models can predict competitive responses to your pricing changes. If you reduce prices by 15%, will competitors match immediately, gradually, or not at all? Historical data and market analysis help you anticipate these responses and plan accordingly.
You don’t need to be cheapest on everything. Focus competitive pricing on high-visibility, price-sensitive stuff while maintaining healthy margins on products where customers value convenience, service, or unique features over price.
Loss leaders—products priced at or below cost to drive traffic—need careful math. The lost margin must be recovered through sales of higher-margin items. I calculate the required attachment rates and average transaction values to make sure loss leaders actually improve overall profitability instead of just bleeding money.
Inventory Performance Analysis and Turnover Optimization
Turnover Rates: Your Cash Flow Indicator
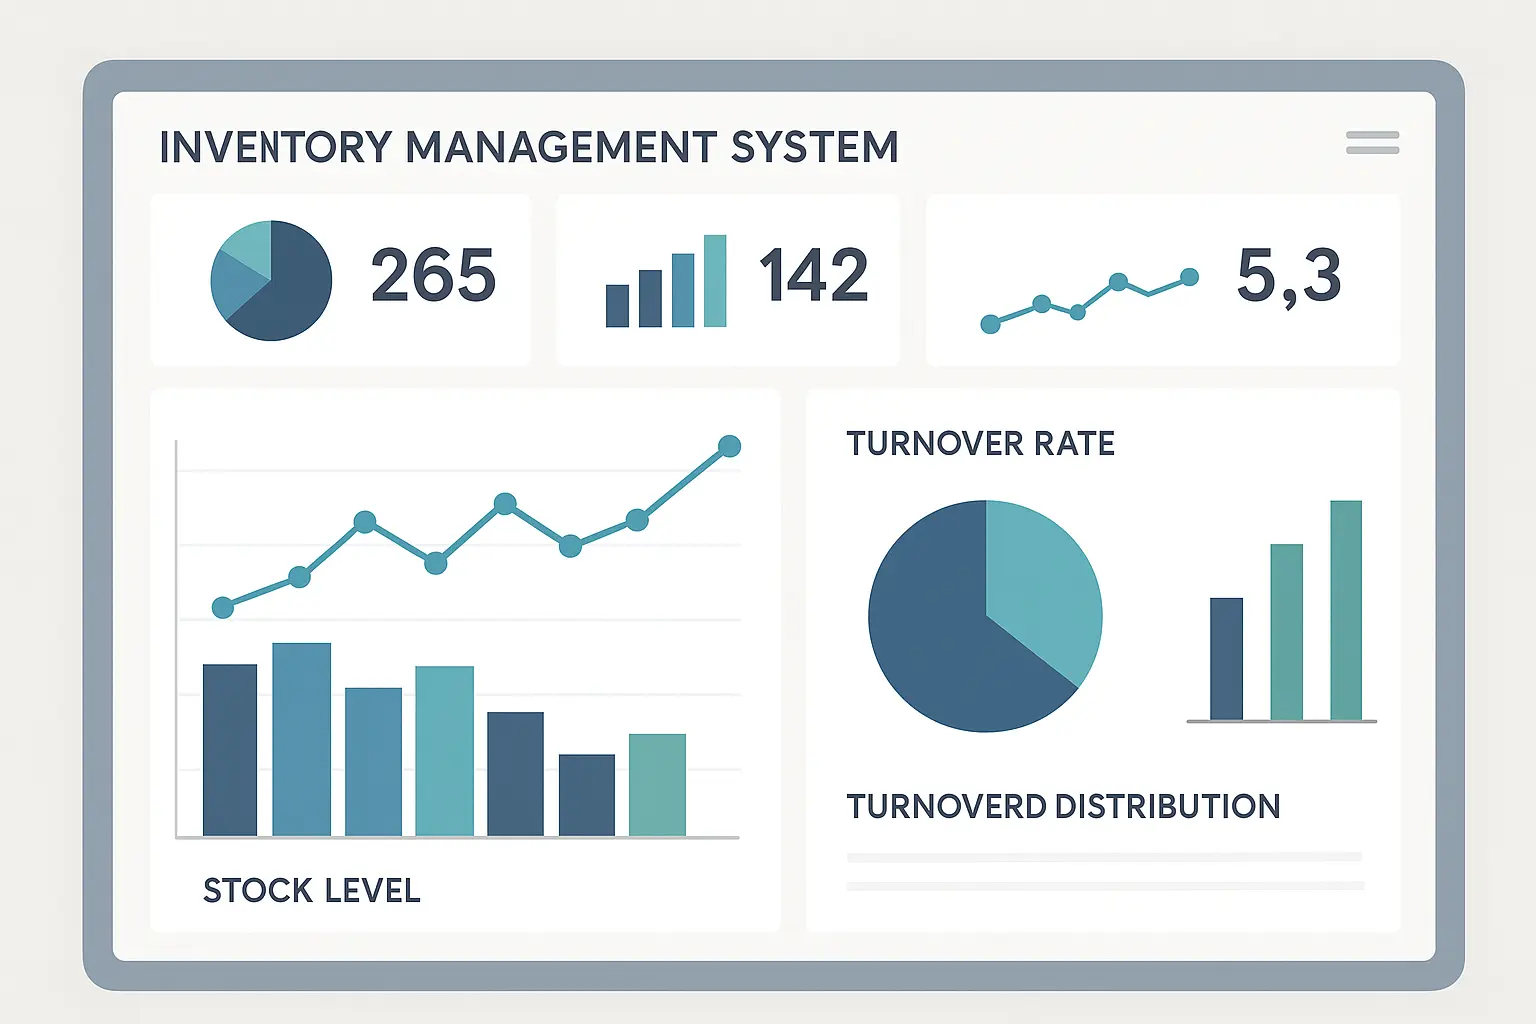
Inventory turnover tells you how fast your money converts to sales and back to cash. Low turnover means cash sitting around doing nothing, while high turnover means efficient management and healthy cash flow.
The calculation is straightforward: Annual COGS ÷ Average Inventory = Turnover Rate. If you sold $500,000 in products (at cost) with average inventory of $100,000, you’re turning 5 times per year—meaning you cycle through your entire inventory five times annually.
But here’s what matters—turnover rates vary wildly by category. Fashion might turn 8-12 times annually, furniture only 2-3 times. Understanding category-specific benchmarks helps you identify performance issues and opportunities before they become disasters.
I prefer rolling 12-month calculations to smooth out seasonal weirdness. Days sales in inventory gives another perspective: 365 ÷ Turnover Rate = Average Days to Sell Inventory. This helps with cash flow planning and reorder timing decisions.
The goal isn’t maximum turnover at any cost. Super high turnover might mean you’re running out of stock and losing sales. The optimal turnover rate balances inventory investment with service level requirements and profit margins.
Advanced retail math concepts benefit from AI-powered optimization tools that can predict optimal inventory levels based on historical sales patterns and market trends.
ABC Analysis: Focus Where It Matters Most
ABC analysis applies the 80/20 rule to inventory—roughly 20% of your products generate 80% of your sales or profits. This helps you focus attention where it’ll have the biggest impact instead of spreading yourself thin across everything.
Category A items (10-20% of SKUs generating 70-80% of sales value) deserve intensive management—weekly reviews, sophisticated forecasting, and immediate attention to any problems. Category B items (20-30% of SKUs, 15-20% of sales) get moderate attention with periodic reviews. Category C items (50-70% of SKUs, 5-10% of sales) need minimal management or elimination consideration.
I rank every product by contribution to total sales value, then draw lines between categories based on cumulative percentages that make sense for my business. A-items get weekly reviews and sophisticated demand forecasting. C-items get quarterly reviews with simple reorder points—or I consider dropping them entirely.
Resource allocation strategies flow naturally from ABC classifications. Why spend the same amount of management time on a product that generates $50 annually as one that generates $5,000? It doesn’t make business sense.
Real Example: A sporting goods store finds running shoes (5% of SKUs) generate 45% of revenue—clear A-items needing daily monitoring. Athletic apparel (25% of SKUs) produces 35% of revenue as B-items needing weekly reviews. Accessories like water bottles and socks (70% of SKUs) contribute only 20% of revenue as C-items managed with simple reorder points and monthly reviews.
Sales Performance Metrics That Drive Growth
Revenue Analysis That Reveals Hidden Opportunities
Sales per square foot measures how hard your space is working for you. Divide total sales by retail floor space—if your 2,000 square foot store generates $800,000 annually, you’re at $400 per square foot.
But raw numbers don’t tell the whole story. I analyze performance by store zones to find optimization opportunities. High-traffic areas near entrances might generate $600 per square foot while back corners produce only $200 per square foot.
My five-step optimization process: measure current performance, benchmark against industry standards for your retail category, identify underperforming areas through heat mapping and customer flow analysis, relocate high-margin products to prime locations or create compelling displays in dead zones, then monitor performance changes to validate improvements.
Customer transaction analysis reveals behavioral patterns that impact revenue generation. Average transaction value, items per transaction, and purchase frequency all contribute to total customer value, but they respond to different optimization strategies.
The math helps predict initiative impacts. If increasing average transaction value by 10% but purchase frequency drops 5%, what’s the net effect on customer lifetime value? You need to run these numbers before implementing changes, not after you’ve already committed resources.
Research from Bloomreach’s retail math analysis indicates that the ideal Customer Acquisition Cost (CAC) to Customer Lifetime Value (LTV) ratio ranges between 1:3 and 1:5, with ratios of 1:6 or higher indicating exceptionally optimized customer loyalty programs and retention strategies.
Conversion Rate Mathematics for Better Results
Conversion rates measure your ability to turn browsers into buyers, but you need clear definitions. Are you measuring unique visitors or total traffic? Browsers or serious prospects? The math only works if you’re consistent with your measurements.
If 1,000 people visit and 150 buy, you’re converting at 15%. But this needs context—weekday mornings might convert at 20% with serious shoppers, while weekend afternoons might only hit 8% with browsers who are just killing time.
Channel-specific performance comparisons help allocate marketing resources effectively. Online typically converts 2-4% while physical stores might convert 15-25% of visitors. Understanding these differences helps set realistic expectations and budgets for each channel instead of expecting miracles.
The math also reveals the relationship between traffic quality and conversion rates. Paid advertising might generate high traffic volumes with low conversion rates, while referral traffic converts at much higher rates despite lower volumes. This insight drives smarter marketing spend allocation.
Small improvements compound significantly—increasing conversion from 15% to 17% represents a 13% boost in sales from the same traffic levels. That’s why systematic testing and measurement matter so much.
|
Channel |
Typical Conversion Rate |
Traffic Quality |
Optimization Focus |
|---|---|---|---|
|
Physical Store |
15-25% |
High intent |
Layout & service |
|
Organic Search |
3-5% |
Medium intent |
SEO & content |
|
Paid Advertising |
1-3% |
Variable intent |
Targeting & landing pages |
|
Email Marketing |
15-25% |
High intent |
Personalization |
|
Social Media |
1-2% |
Low intent |
Engagement & retargeting |
Digital Integration and Omnichannel Analytics
Cross-Channel Attribution: Following the Customer Journey
Modern customers don’t follow neat, linear paths from awareness to purchase. They research online, visit stores, compare prices on mobile apps, read reviews, and might ultimately buy through a completely different channel than where they started.
Cross-channel attribution tries to assign credit for sales across all these touchpoints. The challenge is tracking individual customers across email campaigns, social media interactions, website visits, store visits, and purchase transactions. The math gets complex fast, but the insights justify the effort.
Customer journey mapping requires sophisticated data collection and analysis, but you can start simple. Track email opens, website visits, store visits, and purchases to see patterns in how your customers actually behave versus how you think they behave.
Attribution models range from simple to sophisticated. First-touch gives all credit to initial interaction, last-touch credits the final touchpoint before purchase. Linear distributes credit equally across all touchpoints, which sounds fair but probably isn’t accurate.
Advanced models use time-decay attribution (recent interactions get more credit) or position-based attribution (first and last touches get more weight than middle interactions). The choice depends on your customer behavior patterns and business model.
If a customer discovers your brand through social media, researches products on your website, visits your store for hands-on evaluation, then purchases online with an email coupon, which channel deserves credit for the sale? The mathematical framework helps optimize marketing spend based on actual contribution rather than misleading last-click assumptions.
Understanding cross-channel attribution requires knowledge graph optimization to connect customer touchpoints across different platforms and create comprehensive customer journey maps.
E-commerce Integration Metrics That Matter
Click-and-collect creates new metrics that traditional retail math doesn’t address. Conversion rates from online browsing to store pickup, average order values for pickup orders versus delivery orders, and operational efficiency measures like pickup time and accuracy rates all need tracking.
The math reveals interesting patterns that can drive strategy. Customers using click-and-collect often have higher average order values and make additional purchases during pickup visits. Measuring these incremental sales helps justify the operational costs of pickup services.
Digital influence on in-store sales represents one of retail’s toughest measurement problems. Research suggests 70-80% of in-store purchases involve some digital influence, but measuring this requires sophisticated tracking and customer surveys that most retailers can’t afford.
Customers who research online but purchase in-store to avoid shipping costs or get immediate gratification might appear as pure in-store transactions in simple reporting systems, but they actually represent successful digital marketing outcomes. Missing this connection leads to undervaluing digital marketing investments.
Integrated metrics provide a more accurate picture of marketing effectiveness and customer behavior than channel-specific measurements alone. The complexity is worth it because it prevents you from cutting marketing budgets that are actually driving profitable sales.
The complexity of omnichannel retail math is highlighted by current market conditions. As “Axios” reports, retailers face stark mathematical choices between hiking consumer prices or risking cash flow problems, with spreadsheets circulating in Congress illustrating the brutal tariff-era calculations that determine business survival.
Building Essential Retail Math Skills
Calculation Proficiencies Every Retailer Needs
Retail math skills aren’t nice-to-have—they’re survival requirements. The difference between understanding markup versus margin calculations can mean thousands of dollars in lost profits over time.
You need instant fluency with markup calculations, discount percentages, growth rates, and comparative ratios. These aren’t academic exercises—they’re daily decision-making tools that determine whether you make money or lose it.
The core calculations include markup percentage: (Selling Price – Cost) ÷ Cost × 100, and margin percentage: (Selling Price – Cost) ÷ Selling Price × 100. Discount calculations use: Original Price × (1 – Discount %) = Sale Price. Master these until you can do them without thinking.
But mechanical calculation ability isn’t enough. You need to understand what these numbers mean for your business and how they interconnect with other performance metrics. A great margin means nothing if your inventory turnover is terrible and your cash is tied up for months.
Financial statement interpretation through a retail lens requires understanding how inventory valuation methods affect reported profits, how seasonal patterns impact cash flow statements, and how margin changes flow through to bottom-line results.
Error prevention systems help avoid costly mistakes that can destroy your business. Double-check calculations, use multiple methods to verify results, build systematic review processes. Mathematical errors become business disasters fast in retail.

Essential Retail Math Skills Checklist:
-
Master percentage calculations (markup, margin, discount) without a calculator
-
Understand inventory turnover and days sales calculations inside and out
-
Calculate break-even points for products and promotions quickly
-
Interpret financial ratios and performance metrics accurately
-
Perform competitive pricing analysis systematically
-
Analyze customer lifetime value and acquisition costs realistically
-
Build error-checking systems for all calculations
-
Create standardized calculation templates that prevent mistakes
Integrating Retail Math Concepts for Strategic Decisions
Individual retail math concepts gain power when you understand their interconnections. Pricing decisions affect inventory turnover rates, which impact cash flow, which influences your ability to take advantage of volume purchase discounts. Everything connects.
A 10% price reduction might boost sales volume by 20%, but if it also extends inventory turnover periods and reduces cash flow, the net impact might be negative despite higher sales volumes. You need to see these relationships clearly.
My decision-making framework evaluates pricing changes against multiple criteria: impact on gross margins, effect on inventory turnover, competitive response likelihood, and customer perception changes. The mathematical models help predict outcomes before implementing changes instead of learning through expensive mistakes.
If you’re considering promotional pricing, you can calculate the required volume increases to maintain profitability, assess whether those increases are realistic given market conditions, and plan inventory levels accordingly. This prevents promotional disasters that hurt more than they help.
Error prevention becomes critical when dealing with interconnected systems. A mistake in inventory valuation affects cost of goods sold calculations, which impacts margin analysis, which influences pricing decisions. Small errors cascade into major problems fast.
Integrated Decision Analysis Example: An electronics retailer considers reducing TV prices by 15% during a slow period. The math reveals: 15% price cut requires 21% volume increase to maintain revenue. Current inventory turnover is 4x annually; faster sales would improve cash flow by 30 days. Competitor analysis shows similar promotions historically generate 25-30% volume lifts. The integrated analysis confirms the strategy makes mathematical sense across multiple metrics.

Why Retail Math Determines Business Success or Failure
Business Survival Through Mathematical Precision
Here’s what’ll keep you up at night: roughly 80% of retail businesses fail within their first five years, and most failures trace back to fundamental mathematical mistakes. I’m not talking about complex calculations—I mean basic stuff like not understanding when money comes in versus when it goes out.
Understanding why is retail math important becomes crystal clear when you examine these failure statistics. Retail math isn’t academic theory—it’s literally the difference between businesses that thrive and those that close their doors. Cash flow management represents the most critical application.
You need to predict when money comes in from sales and when it goes out for inventory, rent, and other expenses. The timing matters as much as the amounts because you can have great profit margins and still go under if you can’t pay rent during slow periods.
My Five-Step Cash Flow Survival Plan:
-
Calculate how long your money stays trapped in inventory (inventory turnover periods)
-
Figure out average collection times for credit sales and payment terms with suppliers
-
Plan payment schedules to optimize cash availability when you need it most
-
Forecast seasonal cash needs based on what actually happened last year, not what you hoped would happen
-
Maintain working capital ratios to handle the unexpected stuff that always comes up
Mathematical precision in these calculations prevents cash flow crises that kill otherwise profitable businesses. I’ve seen retailers with healthy profit margins fail because they couldn’t make payroll during a slow February—their profit calculations were right, but their timing was deadly wrong.
Research from Solink’s retail analytics shows that retailers using systematic retail math approaches achieve sales per employee ratios that are 25-40% higher than those relying on intuitive decision-making, demonstrating the concrete business impact of mathematical precision in retail operations.
Cash Flow Management Template:
-
Weekly Cash Inflow Calculation:
-
Credit card sales (immediate): ____%
-
Cash sales (same day): ____%
-
Net terms collections: ____%
-
-
Weekly Cash Outflow Planning:
-
Fixed costs (rent, utilities): $____
-
Variable costs (inventory, labor): $____
-
Seasonal adjustments: +/- ____%
-
-
Safety Margin Requirements:
-
Minimum cash reserve: $____
-
Emergency fund target: $____
-
Line of credit availability: $____
-
Strategic Importance in Data-Driven Markets
Today’s retail environment will eat you alive if you’re still guessing about prices while your competitors use real-time data to optimize everything. Customers compare prices across channels instantly, suppliers adjust pricing based on market conditions, and competitors use advanced analytics to stay ahead.
The strategic advantage goes to retailers who can make faster, more accurate decisions based on solid mathematical analysis. While competitors guess about optimal pricing or inventory levels, mathematically sophisticated retailers know their numbers and can respond quickly to market changes.
Data-driven decision making requires retail math skills as the foundation for interpreting analytics and business intelligence systems. The software provides the data, but you need mathematical understanding to interpret results and make strategic decisions that actually work.
The competitive landscape increasingly favors retailers who understand the mathematical relationships between customer acquisition costs, lifetime values, inventory turnover rates, and profitability metrics. These insights enable strategic investments in growth opportunities while maintaining operational efficiency.
Mathematical precision also enables better vendor negotiations, more accurate financial planning, and improved investor communications. When you can demonstrate clear understanding of your business metrics and their drivers, you gain credibility with all stakeholders who matter to your success.
For marketing agencies working with retail clients, understanding these mathematical foundations becomes essential for demonstrating ROI and creating campaigns that actually drive business results. The Marketing Agency’s high-impact content strategies align perfectly with retail math principles, enabling them to create marketing strategies that connect directly to their clients’ bottom-line performance metrics.

Final Thoughts
Look, retail math isn’t some academic exercise you can ignore—it’s the foundation that separates businesses that thrive from those that struggle and eventually close. Every concept we’ve covered, from basic markup calculations to sophisticated omnichannel attribution models, provides the analytical framework you need to make informed decisions instead of expensive guesses.
Here’s what I want you to understand: these mathematical concepts all connect. Your pricing decisions affect inventory turnover, which impacts cash flow, which influences your competitive positioning and growth opportunities. When you master one area, it enhances your understanding of everything else.
Most importantly, solid retail math skills give you confidence during uncertain times. When market conditions change rapidly or competitive pressures intensify, mathematical analysis helps you respond strategically rather than panic and make reactive decisions that hurt your business.
The investment in developing these mathematical competencies pays dividends throughout your retail career. Whether you’re optimizing pricing strategies, managing inventory investments, or evaluating new market opportunities, solid retail math skills provide the analytical foundation for sustainable success in an increasingly data-driven industry.
I’ve seen too many passionate, hardworking retailers fail not because they lacked dedication or customer service skills, but because they never learned these fundamental mathematical principles. Don’t let that be you. The math isn’t optional—it’s survival.
Every day you operate without understanding these concepts, you’re potentially leaving money on the table or making decisions that could hurt your business long-term. The good news? Once you get this stuff, it becomes second nature, and you’ll wonder how you ever operated without it.
Start with the basics—master markup versus margin calculations, understand your inventory turnover, and get serious about cash flow management. Build from there, but don’t wait. Your business depends on it, and your competitors are already using these tools to stay ahead.
As retail continues evolving with answer engine optimization and AI-driven customer interactions, the fundamental mathematical principles remain constant while their applications become increasingly sophisticated and automated.
The retailers who embrace mathematical precision while maintaining the human touch of great customer service will dominate their markets. Those who ignore the numbers will become cautionary tales. Which one do you want to be?
