


Table of Contents
-
Understanding What Marginal Revenue Actually Means for Your Business
-
The Math Behind the Money: Core Calculation Methods
-
Advanced Calculator Applications That Actually Work
-
Profit Margins and Revenue: The Connection You’re Missing
-
Real-World Implementation Across Different Industries
-
How The Marketing Agency Transforms Revenue Analysis
-
Final Thoughts
TL;DR
-
Here’s the thing about marginal revenue – it’s basically asking “how much extra cash do I make if I sell one more thing?” It’s the difference between guessing and actually knowing your pricing sweet spot
-
The basic formula (change in total revenue ÷ change in quantity) works fine for simple stuff, but if you’re running a real business, you need tools that can handle the complexity without giving you a headache
-
If you’re in a competitive market, marginal revenue stays pretty steady. But if you’ve got some pricing power? That’s where things get interesting (and complicated)
-
The fancy calculators that actually work plug into your existing systems and crunch numbers in real-time, so you’re not stuck making decisions based on last month’s data
-
Here’s what most people miss – revenue without profit is just expensive busy work. You need to look at both marginal revenue and profit margins to see what’s actually working
-
Every industry is different – what works for an online store won’t necessarily work for a manufacturing business or a consulting firm
Understanding What Marginal Revenue Actually Means for Your Business
Look, I’ve watched way too many business owners make pricing decisions based on gut feelings, checking out what competitors are doing, or just adding a markup to their costs and hoping for the best. They’re missing something huge that could completely change how much money they make.
Here’s the thing about marginal revenue – it’s basically asking “how much extra cash do I make if I sell one more thing?” Simple as that. But this one question drives pretty much every major decision you’ll make about pricing, how much to produce, and how to squeeze more profit out of your business.
According to Wall Street Prep, marginal revenue represents the incremental change – either positive or negative – in a company’s revenue from selling one more unit. The production and sale of an additional unit tend to continue to generate more revenue, but only until a certain level of production volume is reached, above which the benefits start to reverse course.
Without understanding marginal revenue, you’re basically flying blind when it comes to maximizing your business’s financial potential. Most business owners think they get revenue, but marginal revenue is different. It’s about the real value each additional sale brings to your bottom line. When you mess with prices – raise them, lower them, change how much you’re selling – a marginal revenue calculator tells you exactly what that decision is costing or gaining you.
This becomes crucial when you’re trying to figure out the best pricing strategy. Should you drop prices to sell more stuff? Jack them up to make more per sale? A solid marginal revenue calculator gives you the answer by showing the real financial impact of each choice.
We’ve all been there – staring at a spreadsheet at 11 PM, wondering if raising prices will help or hurt. Your gut says one thing, your accountant says another, and your competitor just dropped their prices again.
The Foundation: Core Concepts and Mathematical Relationships
Revenue functions aren’t just academic nonsense – they’re practical tools that show you how your income changes when you adjust different variables. When you understand these relationships, you can predict what’ll happen financially before you make decisions, much like how businesses use market sizing techniques to evaluate new opportunities.
The math behind marginal revenue, total revenue, and how much you’re selling forms the backbone of revenue analysis and smart business decisions. Understanding these relationships helps you make choices based on actual data instead of relying on hunches or what everyone else in your industry is doing.
Market structure plays a huge role in how you calculate marginal revenue. If you’re in a super competitive market, your calculations are pretty straightforward. But if you’ve got some control over pricing (which most businesses do), the math gets more complex and way more important for keeping your profit margins healthy. This complexity actually works in your favor because it means you’ve got more opportunities to optimize your profit margins through smart pricing decisions.
Picture this: a coffee shop sells 1,000 cups per month at $5 each, bringing in $5,000 in revenue. If they bump production to 1,100 cups and revenue rises to $5,450, their marginal revenue per additional cup is ($5,450 – $5,000) ÷ (1,100 – 1,000) = $4.50 per cup. This shows that while the base price is $5, each extra cup only generates $4.50 in marginal revenue. That’s telling them something important about market saturation or whether they need to adjust prices to move more inventory.
Breaking Down the Basic Marginal Revenue Formula
The basic formula MR = ΔTR/ΔQ (change in total revenue divided by change in quantity) is your starting point for all marginal revenue calculations. This simple equation becomes the foundation for more sophisticated analysis as your business grows and your pricing gets more complex.
Here’s how it works in real life: if selling 100 units brings in $10,000 and selling 101 units brings in $10,095, your marginal revenue for that 101st unit is $95. That’s the actual value of one more sale.
The formula looks simple, but it reveals some pretty powerful stuff. Sometimes that additional unit might only bring in $50, or $20, or even cost you money if you had to discount heavily to make the sale. Understanding these numbers helps you make smarter decisions about when to push for more sales and when to focus on other strategies.
|
Units Sold |
Total Revenue |
Change in Revenue |
Marginal Revenue |
|---|---|---|---|
|
100 |
$10,000 |
– |
– |
|
101 |
$10,095 |
$95 |
$95 |
|
102 |
$10,185 |
$90 |
$90 |
|
103 |
$10,270 |
$85 |
$85 |
|
104 |
$10,350 |
$80 |
$80 |
Revenue Function Derivatives for Continuous Analysis
When you’re dealing with continuous functions, marginal revenue equals the derivative of the total revenue function with respect to quantity. This enables precise calculations for complex pricing models. This calculus-based approach becomes essential for businesses with sophisticated pricing strategies or multiple product lines.
Okay, I know “derivatives” sounds scary – like something from your worst college math nightmare. But honestly? They’re just a fancy way to figure out exactly how much money you’ll make at any sales level. That’s it.
Instead of calculating between two specific quantities, you can find the marginal revenue for any sales level instantly using marginal revenue calculator calculus methods.
This becomes incredibly valuable when you’re dealing with prices that change constantly, seasonal ups and downs, or when you’re selling a bunch of different products. The derivative approach lets you optimize continuously rather than making separate calculations for specific scenarios.
How Market Structure Changes Everything
Perfect competition means constant marginal revenue equal to price, while markets where you have some control require more complex calculations involving demand elasticity. Understanding where you stand in the market determines which calculation methods you should use and how you interpret the results.
In perfect competition, you’re a price taker. Your marginal revenue equals the market price because you can sell as much as you want at that price. The calculation is simple, but your strategic options are pretty limited.
Most businesses operate somewhere between perfect competition and having total control over pricing. You have some pricing power, but you face competition and customers who’ll walk away if prices get too high. This middle ground requires more sophisticated marginal revenue analysis, but it also gives you more opportunities for optimization.
Practical Methods That Actually Work
There are multiple ways to calculate marginal revenue, from simple arithmetic to advanced calculus-based techniques, each suited for different business scenarios. Choosing the right method depends on how complex your business is, what data you have available, and what you’re trying to accomplish strategically.
Manual calculations work fine for simple scenarios, but they become a real pain as your business grows. You need systems that can handle multiple variables, real-time data, and complex pricing structures without requiring a math degree to operate.
The key is matching your calculation method to your business needs. A small business with straightforward pricing might need nothing more than a spreadsheet, while a large company with prices that change constantly needs automated systems with predictive capabilities.

Step-by-Step Manual Calculation Process
Start by collecting revenue data for different quantity levels, calculate the change in total revenue between consecutive points, then divide by the change in quantity to get your marginal revenue. This manual approach works well for small businesses or when you’re just learning the concepts.
Begin with your sales data. You need at least two data points – revenue at different quantity levels. The more data points you have, the more accurate your analysis becomes.
Calculate the differences: new revenue minus old revenue, new quantity minus old quantity. Divide the revenue difference by the quantity difference. That’s your marginal revenue for that range.
Track these calculations over time to spot patterns. Are you seeing diminishing marginal revenue as quantities increase? Are there sweet spots where marginal revenue peaks? These patterns inform your pricing and sales strategies.
Marginal Revenue Calculation Checklist:
-
☐ Collect revenue data for at least two different quantity levels
-
☐ Calculate change in total revenue (ΔTR = Revenue₂ – Revenue₁)
-
☐ Calculate change in quantity (ΔQ = Quantity₂ – Quantity₁)
-
☐ Apply the formula: MR = ΔTR ÷ ΔQ
-
☐ Double-check your math (seriously, it’s easy to mess up)
-
☐ Document results for trend analysis
-
☐ Compare results to previous periods
-
☐ Look for patterns or weird outliers
Digital Tools and Software Solutions
Modern marginal revenue calculators automate the complex stuff, handle multiple variables at once, and give you instant results for dynamic pricing scenarios. These tools eliminate calculation errors and free up your time for strategic thinking rather than number crunching.
Automated calculators do way more than just crunch numbers faster. They can plug into your sales systems, update calculations in real-time, and alert you to opportunities or problems as they develop.
The best tools don’t just calculate – they analyze. They spot trends, predict outcomes, and suggest optimizations based on your specific business data. This transforms marginal revenue calculator functionality from just reporting what happened to actually helping you plan what to do next.
Connecting Demand Curves and Price Elasticity
Marginal revenue calculations get more sophisticated when you factor in demand curve analysis and price elasticity measurements, giving you deeper insights into market behavior. This integration helps you understand what’s happening with your revenue, why it’s happening, and how to influence it.
Demand curves show you how the amount people want to buy changes as you adjust prices. Price elasticity measures how sensitive your customers are to price changes. Together with marginal revenue, these concepts create a complete picture of your market dynamics.
Understanding these relationships helps you predict customer behavior and optimize your pricing strategy. You’ll know when price increases will boost revenue and when they’ll hurt it, and you can adjust accordingly.
Analyzing Demand Curve Relationships
For linear demand curves, marginal revenue decreases twice as fast as price, creating a predictable relationship that makes calculations easier. This mathematical relationship provides a shortcut for businesses with relatively stable demand patterns.
The two-to-one relationship between price and marginal revenue isn’t just math geek stuff – it’s a practical tool. If you know your demand curve is roughly linear, you can estimate marginal revenue changes without complex calculations.
This relationship also explains why businesses often find that small price increases can dramatically impact profitability, while big price cuts might not generate proportional revenue increases.
Using Elasticity for Revenue Optimization
Price elasticity of demand directly influences marginal revenue calculations, with elastic demand requiring careful consideration of revenue losses from price increases. Understanding elasticity helps you avoid pricing mistakes that could seriously damage your revenue.
Elastic demand means customers are sensitive to price changes. Raise prices, and you lose a lot of customers. Lower prices, and you gain many customers. This sensitivity affects your marginal revenue calculations and optimal pricing strategies.
Inelastic demand gives you more pricing power. Customers will pay higher prices without dramatically cutting back on their purchases. This situation allows for different marginal revenue optimization strategies focused on maximizing profit per unit rather than total volume.
Market Positioning and Competitive Analysis
Understanding competitor pricing and where you stand in the market helps refine marginal revenue calculations by accounting for external factors that influence demand. Your marginal revenue doesn’t exist in a vacuum – it’s influenced by what competitors are doing and how customers perceive your value.
Competitive analysis reveals whether your marginal revenue calculations are realistic. If competitors are pricing way lower, your demand assumptions might be overly optimistic. If you’re priced below market, you might be leaving money on the table.
Market positioning affects how customers respond to your pricing changes. Premium brands can often maintain higher marginal revenue because customers expect to pay more. Value brands might see marginal revenue drop quickly with price increases because customers have tons of alternatives.
The Math Behind the Money: Advanced Calculator Applications
Modern businesses use sophisticated marginal revenue calculators that factor in multiple variables, real-time data, and predictive analytics to optimize revenue streams and strategic decision-making. These advanced applications go way beyond basic calculations to provide actionable insights that drive business growth.
Advanced calculators transform marginal revenue from a simple metric into a strategic weapon. They don’t just tell you what happened – they predict what will happen and suggest what you should do about it.
The sophistication of these tools matches the complexity of modern business. Multiple product lines, prices that change constantly, seasonal variations, and competitive pressures all factor into the calculations automatically, making a marginal revenue calculator essential for data-driven decision making.

Calculus-Based Revenue Optimization
Advanced calculus applications in marginal revenue calculations help businesses find optimal pricing points, production levels, and revenue maximization strategies through mathematical precision. This level of analysis becomes essential for businesses operating in complex, competitive markets.
Based on data from Omni Calculator, to maximize profits, you should always try to have your marginal revenue equal to your marginal cost. This fundamental principle of economic optimization requires precise calculations that calculus-based methods provide.
Okay, stick with me here – calculus isn’t as scary as it sounds. It’s basically just a way to get super precise about your pricing without having to test every single price point manually. Think of it like GPS for your pricing strategy.
The mathematical precision becomes crucial when small changes in pricing can have big impacts on profitability. A few percentage points in price optimization can translate to serious revenue improvements over time.
Derivative Applications in Revenue Functions
Using calculus, businesses can find exact marginal revenue at any point by taking the derivative of complex revenue functions, enabling precise optimization decisions. This approach works particularly well for businesses with continuous pricing flexibility and sophisticated demand modeling.
Derivatives give you the instantaneous rate of change – exactly what marginal revenue measures. Instead of approximating with discrete calculations, you get precise values for any scenario you want to analyze.
This precision becomes valuable when you’re optimizing across multiple variables at once. Price, advertising spend, product features, and distribution channels all affect revenue, and derivatives help you find the optimal combination.
Multi-Variable Revenue Analysis
Partial derivatives allow for marginal revenue calculations when multiple factors influence revenue simultaneously, such as price, advertising spend, and seasonal variations. This comprehensive approach reflects the reality of modern business where revenue depends on many interconnected factors.
Real businesses don’t operate with single variables. Your revenue depends on price, marketing spend, product quality, customer service, what competitors are doing, and dozens of other factors. Multi-variable analysis accounts for these complexities.
Partial derivatives show you how revenue changes when you adjust one factor while holding others constant. This helps you understand which variables have the biggest impact and where to focus your optimization efforts.
Take a SaaS company that discovers through multi-variable analysis that while increasing their monthly subscription price from $99 to $109 reduces customer acquisition by 15%, their marginal revenue actually increases by 8% due to higher per-customer value. But when they factor in advertising spend increases needed to maintain growth, the optimal price point shifts to $104, balancing customer acquisition costs with revenue optimization.
Technology Integration and Automation
Modern marginal revenue calculators integrate with business intelligence systems, CRM platforms, and real-time data feeds to provide dynamic, actionable insights for revenue optimization. This integration eliminates data silos and ensures your calculations reflect current business reality.
Integration transforms static calculations into dynamic business intelligence. Your marginal revenue analysis updates automatically as new data flows in from sales systems, marketing platforms, and customer interactions.
Automation doesn’t just save time – it improves accuracy and enables real-time decision making. You can respond to market changes immediately rather than waiting for monthly or quarterly analysis cycles.
Real-Time Data Processing
Automated systems continuously update marginal revenue calculations as new sales data becomes available, enabling immediate strategic adjustments and opportunity identification. This real-time capability becomes crucial in fast-moving markets where delays in decision-making can cost significant revenue.
Real-time processing means your marginal revenue calculations reflect what’s happening right now, not what happened last month. This accuracy becomes crucial when markets are volatile or when you’re testing new pricing strategies.
Immediate updates enable immediate responses. If marginal revenue starts tanking, you can investigate and fix it before the problem gets serious. If you spot an opportunity, you can jump on it while it’s still available.
Predictive Analytics Integration
Machine learning algorithms enhance marginal revenue calculators by predicting future revenue patterns based on historical data, market trends, and external economic factors. This predictive capability transforms marginal revenue analysis from just reporting what happened to actually helping you plan what’s next.
Predictive analytics don’t just show you what marginal revenue was or is – they show you what it’s likely to be under different scenarios. This forward-looking capability enables better strategic planning and risk management.
Machine learning algorithms spot patterns humans might miss. They can identify seasonal trends, customer behavior changes, and market shifts that affect marginal revenue, often before these changes become obvious through traditional analysis.
API Connectivity and Business System Integration
Modern calculators connect with existing business systems through APIs, automatically pulling data from sales platforms, inventory management systems, and financial software. This connectivity ensures your marginal revenue analysis incorporates all relevant business data without manual data entry or reconciliation headaches.
API integration eliminates data silos and manual errors. Your marginal revenue calculations automatically incorporate data from every relevant system, ensuring accuracy and completeness.
Seamless integration means you don’t need to change your existing workflows. The marginal revenue calculator works with your current systems, enhancing them rather than replacing them.
Profit Margins and Revenue: The Connection You’re Missing
Here’s the thing – revenue without profit is just expensive busy work. Marginal revenue analysis becomes truly valuable when you connect it to profit margin calculations to understand which sales actually contribute to your bottom line.
Understanding the relationship between marginal revenue and profit margins helps businesses make smart decisions about pricing, production, and market expansion while keeping profitability healthy. This connection reveals the difference between generating revenue and actually making money.
The relationship between marginal revenue and profit margins isn’t always obvious. Sometimes higher marginal revenue comes with terrible profit margins, and sometimes lower marginal revenue delivers higher profits. Understanding these dynamics helps you optimize for what actually matters – profitability.
According to Harvard Business Review, “if you want to understand how a specific product contributes to the company’s profit, you need to look at contribution margin” rather than just profit margin, which measures total revenue exceeding costs.
Gross Margin Calculator Integration
Combining marginal revenue calculations with gross margin analysis gives you a complete view of profitability, helping businesses understand both revenue generation and cost efficiency. This integrated approach ensures you’re optimizing for profit, not just revenue.
Gross margin shows you how much profit you make after covering the direct costs of producing your product or service. When combined with marginal revenue, you can see which additional sales are actually worth pursuing. Learning how to calculate profit margin alongside marginal revenue creates a complete financial picture.
Integration reveals the whole story. You might discover that your highest marginal revenue products have terrible margins, or that low marginal revenue products are actually your most profitable. These insights change your strategic priorities, similar to how retail math techniques help retailers optimize their pricing and inventory decisions.
A gross margin calculator combined with marginal revenue analysis helps identify the optimal balance between volume and profitability.
Cost-Revenue Relationship Analysis
Analyzing how marginal costs change relative to marginal revenue helps identify the optimal production level where profit margins are maximized. This analysis becomes crucial for businesses with significant variable costs or capacity constraints.
Marginal cost is the flip side of marginal revenue – it’s how much it costs to produce one more unit. The relationship between these two metrics determines your optimal production and sales levels while maintaining healthy profit margin levels.
When marginal revenue beats marginal cost, you should generally produce more. When marginal cost exceeds marginal revenue, you’re losing money on additional production. The intersection point shows your profit-maximizing quantity and optimal profit margin position.
According to Wall Street Prep, per economic theory, a company’s profits are maximized at the point on the graph at which its marginal revenue is equivalent to its marginal cost because the net marginal profit is zero. If plotted on an illustrative graph, the break-even point where “MR = MC” is the optimal production level.
Break-Even Point Identification
Marginal revenue calculations help pinpoint exact break-even quantities and pricing thresholds, enabling precise financial planning and risk assessment. Understanding these break-even points helps you set realistic sales targets and evaluate whether different business strategies actually make sense.
Break-even analysis using marginal revenue is more sophisticated than traditional approaches. Instead of just covering fixed costs, you can identify the exact point where additional sales start contributing to profit rather than just covering expenses.
Precise break-even identification helps with financial planning and risk management. You know exactly how much you need to sell to be profitable, and you can model different scenarios to understand your financial exposure.
Strategic Profit Margin Optimization
Advanced profit margin strategies use marginal revenue data to optimize pricing tiers, identify high-value customer segments, and develop targeted revenue enhancement initiatives. This strategic approach moves beyond simple cost-plus pricing to value-based optimization.
Strategic optimization considers the full customer lifecycle, not just individual transactions. Some customers might generate low marginal revenue initially but become highly profitable over time. Others might look attractive on a per-transaction profit margin basis but cost more to serve than they’re worth.
Optimization strategies need to balance short-term and long-term profitability. Sometimes accepting lower marginal revenue today builds customer relationships that generate higher profit margin returns tomorrow.
Dynamic Pricing Strategy Development
Real-time marginal revenue analysis enables businesses to implement dynamic pricing models that automatically adjust based on demand patterns and competitive positioning. This approach maximizes revenue by capturing the optimal price point for current market conditions rather than relying on static pricing strategies.
Dynamic pricing isn’t just for airlines and hotels anymore. Any business with pricing flexibility can benefit from adjusting prices based on real-time marginal revenue data. The key is having systems that can calculate and implement changes quickly enough to capture market opportunities.
Successful dynamic pricing requires understanding your customers’ price sensitivity and your competitors’ likely responses. Marginal revenue analysis provides the foundation for these decisions by showing you the financial impact of different pricing scenarios.
Just as businesses need comprehensive data analysis tools to track performance, dynamic pricing requires sophisticated systems to monitor and adjust pricing in real-time.
|
Pricing Strategy |
Marginal Revenue Impact |
Implementation Complexity |
Best Use Cases |
|---|---|---|---|
|
Static Pricing |
Predictable but limited |
Low |
Stable markets, simple products |
|
Dynamic Pricing |
High optimization potential |
High |
Volatile demand, digital products |
|
Tiered Pricing |
Moderate with segmentation |
Medium |
Multiple customer segments |
|
Value-Based Pricing |
Maximum when aligned |
Medium |
Differentiated products |
|
Penetration Pricing |
Initially low, grows over time |
Low |
New market entry |
Customer Segment Profitability Analysis
Calculating marginal revenue by customer segment reveals which groups generate the highest incremental value, informing targeted marketing and sales strategies. This segmentation approach helps you allocate resources to the most profitable opportunities while avoiding unprofitable customer acquisition.
Different customers aren’t created equal from a marginal revenue perspective. Some segments consistently generate high incremental value, while others might look attractive on paper but deliver disappointing profit margin results when you factor in acquisition and service costs.
Segment analysis helps you tailor your approach to different customer groups. High-value segments might justify premium pricing and personalized service, while price-sensitive segments might require volume-based strategies with streamlined service models.
Product Mix Optimization
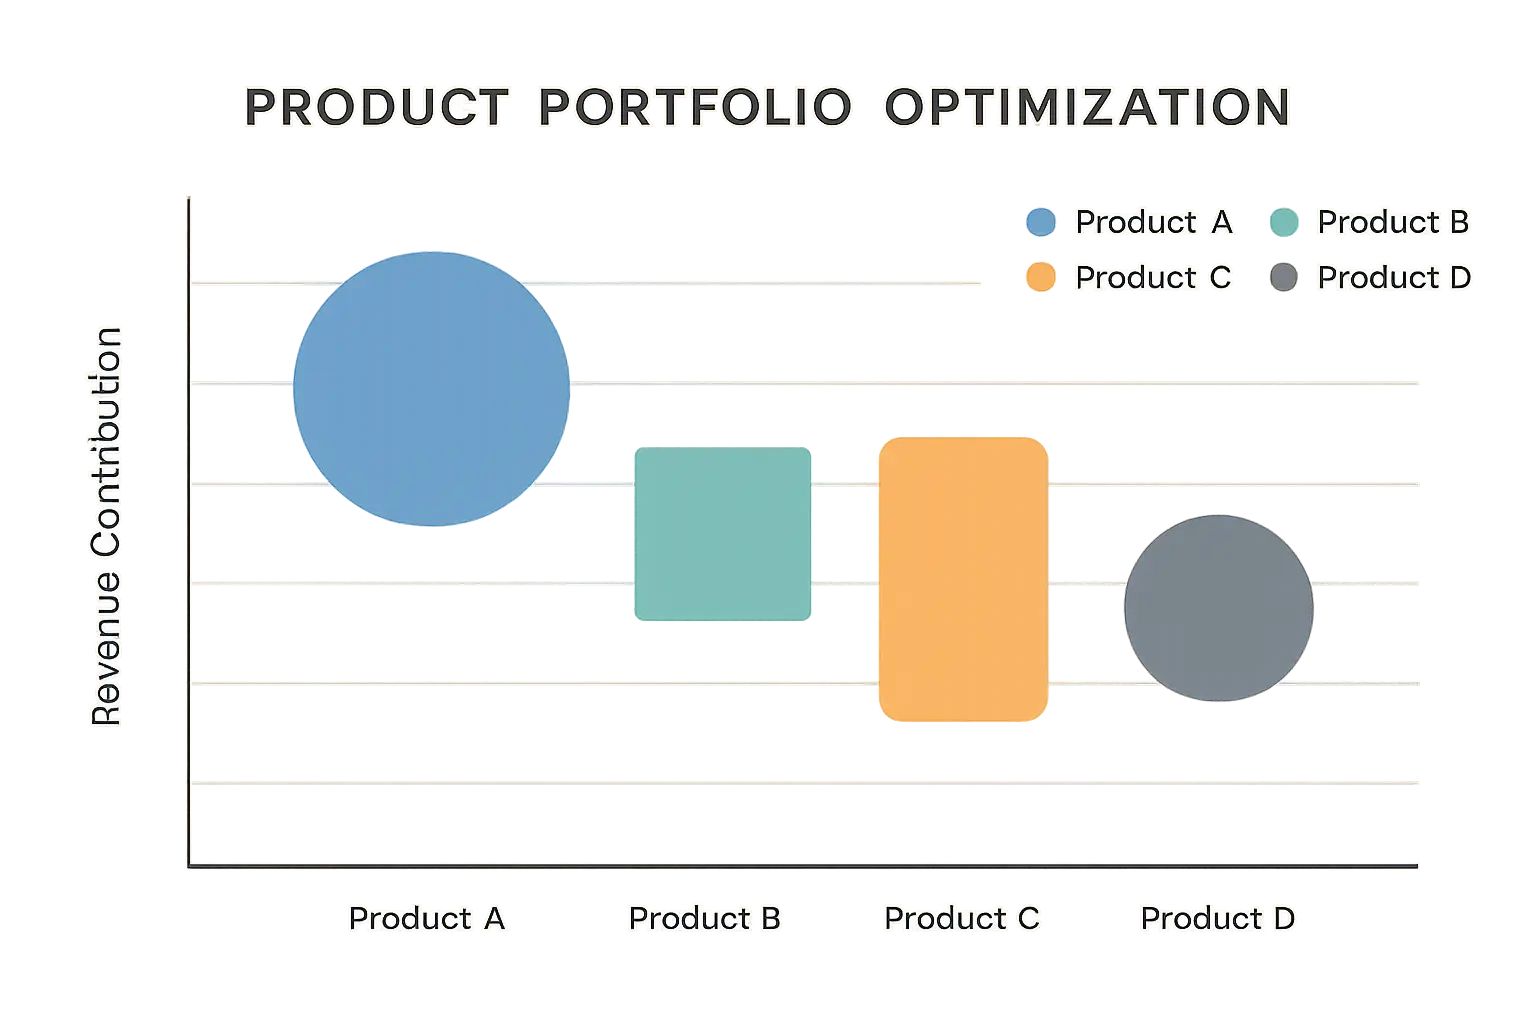
Marginal revenue analysis across different products helps businesses allocate resources to the most profitable offerings and phase out underperforming items. This optimization ensures your product portfolio generates maximum incremental value rather than just maximum volume.
Product mix decisions become clearer when you understand each product’s marginal revenue contribution. Some products might generate high total revenue but low marginal revenue, while others might have smaller revenue numbers but contribute more to incremental growth.
Resource allocation follows marginal revenue insights. Marketing budgets, sales team focus, and development resources should flow toward products and services that generate the highest marginal revenue, not necessarily the highest total revenue.
Real-World Implementation Across Different Industries
Successfully implementing marginal revenue calculators requires understanding various business contexts, from e-commerce platforms to service-based industries, each with unique calculation requirements and optimization opportunities. Industry-specific factors significantly influence how you calculate, interpret, and act on marginal revenue data.
Implementation isn’t one-size-fits-all. What works for a software company won’t necessarily work for a manufacturing business or a consulting firm. Each industry has unique cost structures, customer behaviors, and competitive dynamics that affect marginal revenue calculator implementation.
Success requires adapting general principles to specific industry realities. You need to understand your industry’s particular challenges and opportunities to implement marginal revenue analysis effectively.
Industry-Specific Applications
Different industries require tailored approaches to marginal revenue calculation, accounting for unique cost structures, revenue patterns, and market dynamics specific to each sector. Understanding these differences ensures your analysis reflects industry realities rather than generic business theory.
Industry characteristics fundamentally change how marginal revenue works. High fixed cost industries have different optimization points than variable cost businesses. Regulated industries face constraints that don’t apply to competitive markets.
Tailored approaches deliver better results because they account for industry-specific factors that generic calculations might miss. Your marginal revenue analysis should reflect your industry’s unique economics, not just general business principles.
E-commerce and Digital Products
Digital businesses benefit from simplified marginal revenue calculations due to low variable costs, enabling aggressive pricing strategies and rapid market expansion. The scalability of digital products creates unique opportunities for marginal revenue optimization that physical businesses can’t match.
Based on research from Captain Calculator, a coffee shop that sells 20,000 cups in the first month for $100,000 total revenue, then 22,000 cups in the second month for $115,000 total revenue, achieves a marginal revenue of $7.50 per additional cup ($15,000 ÷ 2,000 = $7.50), demonstrating how businesses can quantify the incremental value of expansion.
Digital products have near-zero marginal costs once developed. This means almost all marginal revenue flows directly to profit, creating powerful incentives for volume growth and market penetration strategies.
E-commerce businesses can test pricing strategies rapidly and measure results precisely. A/B testing different prices shows exactly how marginal revenue responds to pricing changes, enabling continuous optimization.
Subscription models add complexity but also opportunity. Customer lifetime value calculations become crucial for understanding true marginal revenue, since initial sales might be loss leaders that generate profits over time.
Take a subscription software company that discovers while their $29/month plan generates immediate marginal revenue,
Take a subscription software company that discovers while their $29/month plan generates immediate marginal revenue, customers who start with the $9/month plan and upgrade over time actually deliver 40% higher lifetime marginal revenue due to lower churn rates and higher upgrade rates. This insight leads them to restructure their pricing strategy to emphasize the lower-tier entry point while optimizing upgrade paths.
Manufacturing and Physical Goods
Manufacturing companies must account for variable production costs, capacity constraints, and inventory holding costs when calculating marginal revenue for optimal production planning. These physical constraints create different optimization challenges than digital businesses face.
Manufacturing marginal revenue calculations must consider production capacity limits. You can’t always produce more units even if marginal revenue exceeds marginal cost, because you might lack manufacturing capacity or raw materials.
Inventory costs complicate the analysis. Producing more units today might generate positive marginal revenue, but storing unsold inventory creates ongoing costs that reduce actual profitability.
Supply chain factors affect marginal revenue calculations. Raw material price fluctuations, shipping costs, and supplier reliability all influence the true cost and revenue of additional production.
Manufacturing Marginal Revenue Optimization Checklist:
-
☐ Calculate production capacity constraints
-
☐ Factor in raw material cost fluctuations
-
☐ Include inventory holding costs in analysis
-
☐ Account for seasonal demand variations
-
☐ Consider supplier lead times and reliability
-
☐ Evaluate shipping and logistics costs
-
☐ Assess quality control impacts on marginal costs
-
☐ Plan for equipment maintenance downtime
Service-Based Industries
Service businesses face unique challenges in marginal revenue calculation due to labor costs, capacity limitations, and the intangible nature of service delivery. These factors require different analytical approaches than product-based businesses use.
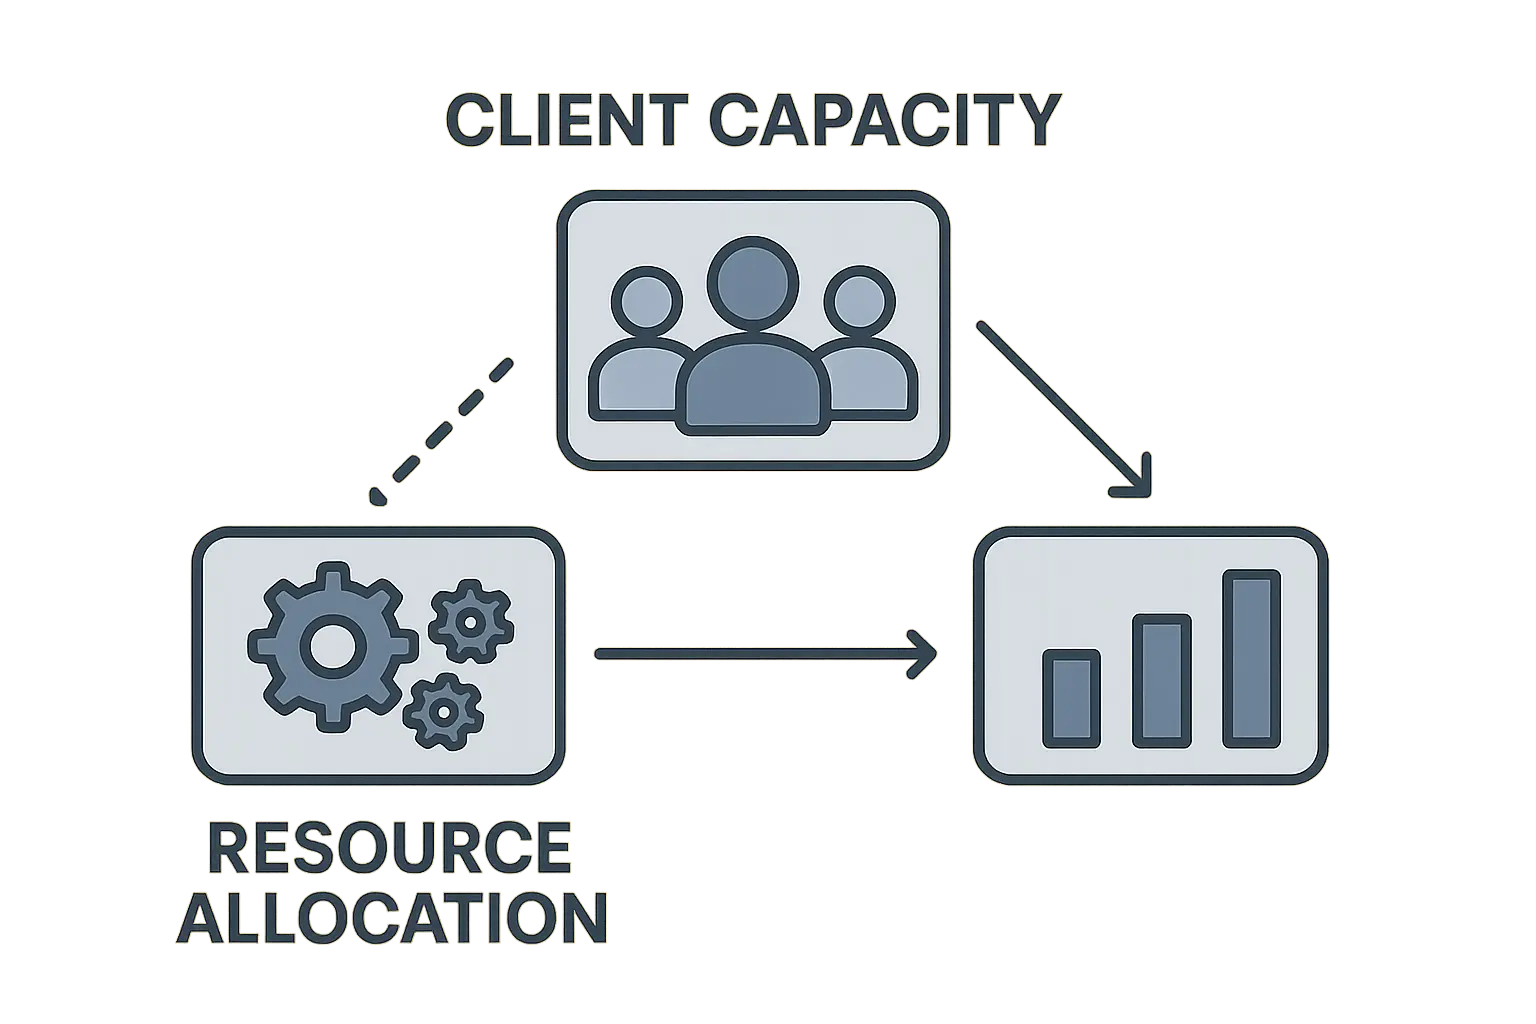
Service capacity is often people-dependent, creating different constraints than manufacturing businesses face. You can’t easily scale service delivery without hiring more people, which affects marginal cost calculations.
Service quality considerations complicate marginal revenue analysis. Taking on more clients might generate additional revenue, but if service quality suffers, you might lose existing clients or damage your reputation.
Professional services often have project-based revenue that doesn’t fit neatly into traditional marginal revenue models. You need to adapt calculations to account for project lifecycles and resource allocation across multiple clients.
According to Wall Street Prep, the gradual reduction in marginal revenue reflects the law of diminishing returns, wherein the marginal benefits decline as more units are produced. For service businesses, this often shows up when taking on additional clients begins to strain capacity and reduce service quality, ultimately decreasing the marginal revenue per client.
How The Marketing Agency Transforms Revenue Analysis
The Marketing Agency’s data-driven approach to digital marketing aligns perfectly with sophisticated marginal revenue analysis, helping clients optimize their marketing spend and maximize ROI through scientific, metrics-based strategies. Their proprietary systems perform continuous marginal revenue calculations for marketing investments, ensuring every dollar spent generates measurable incremental returns.
Here’s the thing about The Marketing Agency – they actually get that marketing isn’t just throwing money at Facebook ads and hoping something sticks. They treat every dollar like it needs to earn its keep, which is exactly how you should think about marginal revenue.
Their real-time campaign analysis essentially performs marginal revenue calculator functions for marketing spend. Each additional dollar invested in PPC, email marketing, or content creation generates measurable incremental revenue that can be tracked, analyzed, and optimized.
The agency’s focus on the 80/20 rule directly applies marginal revenue principles by identifying which marketing activities generate the highest incremental returns. They concentrate resources on high-impact strategies while eliminating or reducing spend on activities that don’t deliver proportional marginal revenue.
Their comprehensive reporting ensures clients understand “what’s working, what’s not, and where every dollar is going” – providing the transparency needed for effective marginal revenue analysis of marketing investments. This approach mirrors how businesses need high-impact content strategies to maximize their content marketing ROI.
For businesses seeking to implement marginal revenue calculators and optimization strategies, The Marketing Agency’s scientific approach can identify the gaps most agencies miss. They ensure revenue optimization efforts are based on solid data and proven methodologies rather than guesswork, helping you understand the true marginal revenue impact of your marketing investments.
Just as they help clients choose between marketing tools and platforms based on data-driven analysis, they apply the same rigorous approach to marginal revenue optimization.
Ready to transform your revenue analysis with data-driven marketing strategies? Contact The Marketing Agency to discover how their scientific approach can optimize your marginal revenue and maximize your marketing ROI.
Final Thoughts
The businesses winning in today’s competitive markets aren’t necessarily the ones with the best products or the lowest prices – they’re the ones making the smartest decisions about where to focus their resources. Marginal revenue calculator analysis gives you that intelligence while helping maintain optimal profit margin levels.
Marginal revenue calculators aren’t just mathematical tools – they’re strategic weapons that can transform how you make business decisions. The difference between businesses that thrive and those that struggle often comes down to understanding the incremental value of each decision, each sale, and each strategic move. When you master marginal revenue analysis, you stop guessing and start knowing what drives your profitability.
Implementation doesn’t have to be overwhelming. Start with basic calculations to understand your current situation, then gradually incorporate more sophisticated tools as your needs grow. The key is beginning the journey from gut-feeling decisions to data-driven optimization that improves your overall profit margin performance.
Look, I’m not gonna lie to you – if you’re running a one-person consulting business, you probably don’t need a PhD-level marginal revenue calculator. Sometimes “charge what you’re worth and see what happens” is a perfectly fine strategy.
But for most businesses, understanding marginal revenue is the difference between leaving money on the table and actually optimizing for what matters. Remember that marginal revenue analysis is most powerful when it’s integrated with your broader business strategy, much like how effective content creation requires understanding your audience and strategic goals rather than just producing content.
Fair warning: this stuff can get addictive. Once you start seeing the real numbers behind your business decisions, you might find yourself calculating marginal revenue for everything. (Yes, even your kid’s lemonade stand.)
Here’s what nobody tells you about these fancy revenue calculators – they’re only as good as the data you feed them. Garbage in, garbage out. I’ve seen businesses get obsessed with perfect calculations while their actual sales are tanking because they forgot to, you know, actually talk to their customers.
Bottom line? You don’t need to become a math wizard overnight. Start simple – figure out which products or services actually make you money, then get fancier from there. And if you need help making sense of it all, well, that’s what the pros are for.
Building a sustainable, profitable business that can adapt to changing market conditions and capitalize on new opportunities as they arise – that’s what marginal revenue analysis enables. It’s about making more money while building something that lasts.
