


Look, I’ll be straight with you – I screwed up badly when I first started selling on Amazon. I thought I could just eyeball my costs and figure out profits as I went. That cocky attitude cost me thousands in my first year alone. As of 2021, “SellerSprite maintains the largest Amazon Search Databases available” with over 330,000+ users growing by the thousands daily, which just shows how many of us learned this lesson the hard way.
I’ve been selling on Amazon for six years now, and here’s what nobody tells you upfront – understanding your true profit margins isn’t optional anymore. When I started, I thought I was some kind of business genius who could wing it. Amazon’s fee structure changes more often than most sellers realize, and what looks profitable today can become a money pit tomorrow if you’re not tracking the right numbers.
That wake-up call came when I thought I was killing it with 25% margins on my kitchen gadgets. Then I actually ran the numbers through a proper calculator and discovered my real margins were closer to 12%. I felt like an idiot, but that embarrassing moment changed everything about how I approach this business.
Table of Contents
-
Understanding FBA Calculator Fundamentals
-
Tool Selection and Implementation Strategies
-
Regional and Market-Specific Considerations
-
Advanced Analytics and Business Intelligence
TL;DR
-
FBA calculators are your profit compass – they decode Amazon’s complex fee structure so you don’t have to guess your margins
-
Free tools get you started, but premium calculators with automation features save hours and prevent costly mistakes
-
Different Amazon marketplaces have unique fee structures – what works in the US won’t necessarily work in the UK or EU
-
Modern calculators go beyond basic math – they’re smart tools that can predict trends and optimize inventory
-
Browser extensions make product research lightning-fast by showing profit calculations directly on Amazon pages
-
Storage fees and seasonal surcharges can kill your margins if you’re not factoring them into your calculations
Understanding FBA Calculator Fundamentals
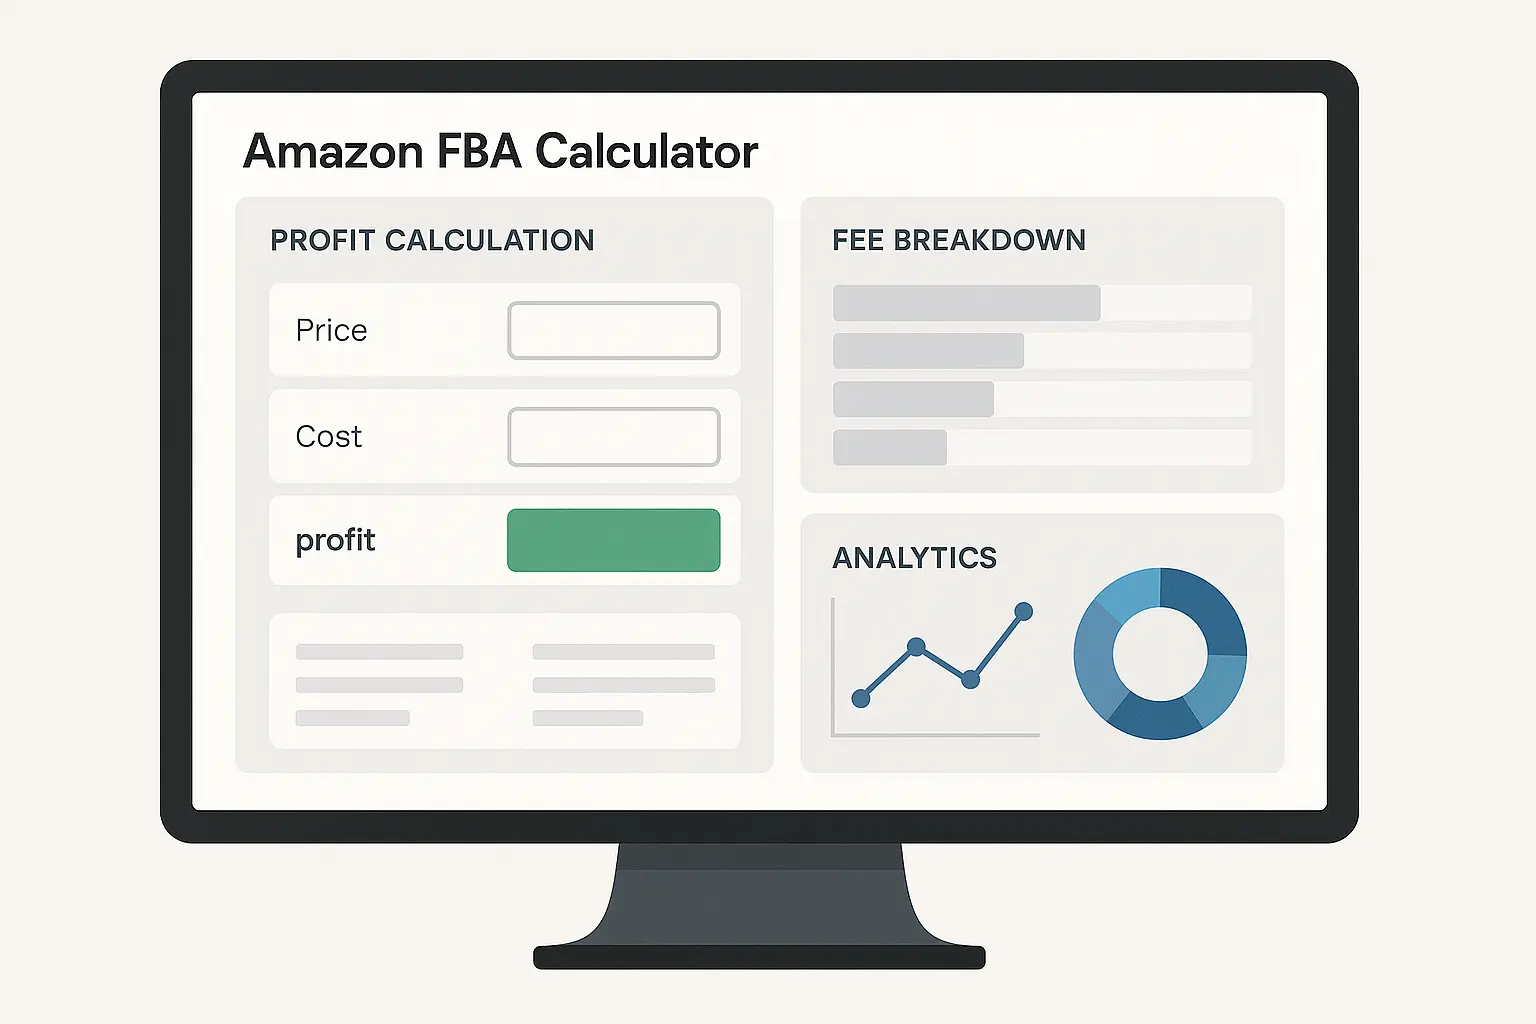
Okay, let’s talk about Amazon’s fees. They’re a nightmare. Seriously. I’m convinced they designed this system to confuse the hell out of sellers on purpose. These fba calculator tools don’t just crunch numbers – they’re your financial GPS for navigating Amazon’s marketplace without going broke.
When I first discovered how much money I was leaving on the table by not using proper amazon fba calculator tools, it was honestly embarrassing. I thought I was making 25% margins on those kitchen gadgets I mentioned, but after running the numbers through a real amazon profit calculator, I found out my actual margins were closer to 12%. That revelation was like getting punched in the gut, but it changed everything.
The Real Power Behind Modern FBA Calculators
Here’s the thing – today’s fba calculator platforms aren’t just simple math tools anymore. They’ve turned into these crazy smart machines that pull together dozens of variables to give you accurate profit forecasts. The best amazon fba calculator tools can make or break your Amazon strategy because they show you all those hidden costs that’ll destroy your margins if you’re not careful.
Amazon’s fee structure isn’t just complicated – it’s deliberately confusing. You’ve got referral fees that change depending on what you’re selling, FBA fees that shift based on size and weight, storage costs that go up and down with the seasons, and about a dozen other charges that can blindside you. I learned this the hard way when Amazon reclassified one of my products into a higher fee category without any warning. Overnight, my 18% margin became a 9% margin. Fun times.
Modern calculators solve this mess by pulling real-time data from multiple sources. They grab current fee schedules, factor in your product dimensions and weight, and even account for those seasonal adjustments that pop up out of nowhere. The best ones update automatically when Amazon changes their fee structure (which happens way more often than you’d think).
What really makes advanced calculators worth their weight in gold is their ability to run different scenarios. Want to see how a price change affects your margins? Done. Curious about switching from FBA to FBM? They’ll show you the numbers instantly. This scenario planning has saved me from making several expensive mistakes over the years.
When evaluating different calculation tools, applying the same analytical rigor used in retail math optimization ensures you’re making data-driven decisions that maximize profitability across all your business metrics.
What Data You Actually Need (And Why Most People Screw This Up)
Getting accurate calculations requires specific product data, but most sellers either give incomplete information or use outdated numbers. The garbage-in-garbage-out rule applies big time here – your amazon fba calculator results are only as good as what you put in.
Here’s what trips up most sellers: they focus on the obvious stuff (selling price, product cost) but ignore the details that can swing your margins by 20% or more. I made this mistake early on and it cost me dearly.
You need your ASIN (obviously), but also exact dimensions and weight. Amazon measures everything down to the inch, and being off by even a tiny bit can bump you into a higher fee tier. I’ve watched sellers lose $2-3 per unit because they guessed at dimensions instead of actually measuring. One of my products got bumped from standard-size to oversize because I was off by half an inch on the length. That little mistake cost me $1.20 per unit in extra fees. Do the math on a few hundred units and you’ll see why I was kicking myself for weeks.
Product category matters way more than most people realize. Amazon’s referral fees range from 6% to 45% depending on your category, and some have minimum fees that’ll absolutely destroy low-priced items. Your fba calculator needs to know exactly where Amazon puts your product. I once had this silicone phone case that Amazon moved from “Electronics Accessories” (8% referral fee) to “Cell Phones & Accessories” (15% referral fee). That reclassification cost me $700 monthly in additional fees. Nobody warned me that was coming.
Don’t forget about prep fees if you’re using Amazon’s prep services, removal fees for unsold inventory, and return processing fees. These “small” charges add up fast when you’re moving volume.
FBA Calculator Data Checklist:
-
☐ Exact product dimensions (length x width x height)
-
☐ Precise weight (including packaging)
-
☐ Current Amazon selling price
-
☐ Your product cost (including shipping to you)
-
☐ Amazon product category classification
-
☐ ASIN or product identifier
-
☐ Prep service requirements
-
☐ Expected return rate for your category
-
☐ Seasonal demand patterns
-
☐ Current inventory levels at Amazon
How Real-Time Fee Updates Save Your Margins
Amazon changes their fee structure regularly, and using old fee information can turn profitable products into money losers overnight. Smart fba calculator tools sync with Amazon’s current fee schedules to prevent these nasty surprises.
Here’s what’s messed up – Amazon doesn’t send you a memo when they adjust fees. They just update their fee pages and expect you to notice. I’ve watched sellers keep using old calculations for months, scratching their heads about why their profits were shrinking. This happened to me with storage fees – I didn’t realize Amazon had bumped up long-term storage fees until I got slammed with a massive bill that made me want to throw my laptop out the window.
The best calculators pull fee data directly from Amazon’s systems or update their databases within hours of changes. This isn’t just about referral fees – storage costs, FBA fees, and seasonal surcharges all shift throughout the year. Using an amazon fba fee calculator that stays current with these changes is essential for keeping your profit projections accurate.
Peak season is where this really bites you in the butt. Amazon adds holiday surcharges that can jack up your fulfillment costs by $0.35-$4.80 per unit during Q4. If your calculator isn’t factoring these in, you might think you’re profitable when you’re actually losing money on every sale. I learned this lesson during my second year selling when my Q4 “profits” turned into losses because I hadn’t accounted for peak season surcharges. That was a gut punch I wasn’t expecting.
Long-term storage fees are another gotcha that’ll sneak up on you. After 365 days, Amazon charges $6.90 per cubic foot (or $0.15 per unit, whichever is greater) monthly. Products sitting too long can rack up fees that exceed their actual value. I had some seasonal items that I thought were just slow sellers, but they were actually costing me money in storage fees. Talk about adding insult to injury.
Let me give you a real example – imagine you’re using an outdated calculator showing 15% profit margins on a $25 kitchen gadget. When Amazon increased FBA fees by $0.50 per unit in their latest update, your real margin dropped to 13%. Over 1,000 units sold monthly, that’s $500 in unexpected lost profit – enough to fund an entire month of PPC advertising that you didn’t budget for.
Beyond Basic Math: Profit Analysis That Actually Matters
Modern FBA calculators don’t just tell you if a product is profitable – they help you understand how profitable it should be and what you can do to make it better. This strategic stuff separates successful sellers from those just scraping by.
Break-even analysis shows you exactly how many units you need to sell to cover your costs. But here’s what’s more important – it reveals your risk tolerance. A product that needs 500 sales to break even is way riskier than one that breaks even at 50 units. I use this analysis to figure out how much inventory to order and how aggressive to be with my pricing when I launch.
ROI projections help you compare opportunities properly. A 30% margin sounds awesome until you realize it ties up your money for six months. A 20% margin product that turns inventory monthly might actually be the better choice. This perspective shift changed how I look at products – I focus on annual ROI now instead of just per-unit margins.
Margin sensitivity analysis is where things get really interesting. The best amazon profit calculator tools show you how small changes in costs or pricing mess with your bottom line. Sometimes a $0.50 price increase doubles your profit per unit – but only if demand stays stable. I’ve used this analysis to find products where I had pricing power and others where I was stuck at current prices.
According to “Helium 10’s Amazon FBA Calculator”, “A good profit margin for selling on Amazon would be in the 15-20% range. 20%+ would be considered phenomenal, while a profit margin below 5% would be unviable over the long-term.” This gives me a quick way to assess whether a product opportunity is worth my time.
The amazon fba profit calculator tools I use now also factor in advertising costs, which tons of sellers forget about. You might have great organic margins, but if you’re spending 15% of revenue on PPC to stay visible, your true profitability is way lower. Understanding your amazon profitability means looking at the whole picture, not just the obvious costs.
Revenue Calculation: The Full Picture Most Sellers Miss
Revenue calculations go way beyond simple price times quantity math. Smart sellers factor in multiple revenue streams, seasonal ups and downs, and the true cost of different fulfillment methods to get accurate profitability projections.
Most sellers think amazon revenue calculation is straightforward: selling price minus fees equals profit. That works for your first sale, but building a real business requires understanding revenue patterns, seasonal swings, and how different sales channels work together. I spent my first year thinking about individual transactions instead of understanding my business as a system. Big mistake.
Amazon’s revenue streams are trickier than they look. You’ve got regular sales, Lightning Deals, Subscribe & Save discounts, promotional pricing, and international sales if you’re using Global Selling. Each one has different fee structures and margin implications. When I started using an amazon revenue calculator that accounted for all these variables, I discovered that my Lightning Deal sales were actually unprofitable after factoring in the promotional fees and higher return rates.
The revenue calculator tools I use now help me understand which revenue streams actually make money and which ones I’m doing just for visibility or market share. This analysis has helped me make better decisions about which promotions to run and which ones to skip entirely.
Multi-Channel Revenue: Why FBA vs FBM Isn’t Black and White
The best profit strategies often mix fulfillment methods instead of picking just one. Understanding how FBA and FBM work together can unlock revenue opportunities that single-method sellers completely miss.
Here’s what most calculators won’t tell you: the best strategy often involves using both FBA and FBM strategically. FBA for your fast-movers and Prime eligibility, FBM for slow-movers and high-margin items where you can handle longer shipping times. I stumbled onto this approach when I was getting killed by storage fees on some seasonal products.
FBA gives you Prime eligibility and higher conversion rates, but those benefits come with storage costs and less control over your inventory. FBM saves on storage and gives you flexibility, but you’ll typically see lower conversion rates and lose some Buy Box opportunities. The fba revenue calculator tools I use help me model both scenarios for each product.
The math gets interesting when you factor in opportunity costs. That inventory sitting in Amazon’s warehouse could be generating cash flow through other channels. Some sellers use FBA for their core products and FBM for testing new items or clearing slow inventory. I’ve adopted this hybrid approach and it’s boosted my overall profitability significantly.
Multi-marketplace selling adds another layer that most people don’t think about. Your FBA inventory can serve Amazon.com, Amazon.ca, and Amazon.mx at the same time, spreading your storage costs across multiple revenue streams. Using a revenue calculator amazon tool that accounts for multi-marketplace dynamics has helped me optimize my North American strategy.
Understanding multi-channel revenue optimization requires the same strategic thinking used in market sizing analysis, where you evaluate total addressable market across different channels and fulfillment methods.
|
Fulfillment Method |
Prime Eligible |
Storage Control |
Conversion Rate |
Best For |
|---|---|---|---|---|
|
FBA |
✅ Yes |
❌ Limited |
High (Prime boost) |
Fast-moving, competitive products |
|
FBM |
❌ No* |
✅ Full |
Standard |
Slow-movers, high-margin items |
|
Hybrid Strategy |
✅ Partial |
✅ Flexible |
Optimized |
Diversified catalog management |
*Seller Fulfilled Prime available with qualification
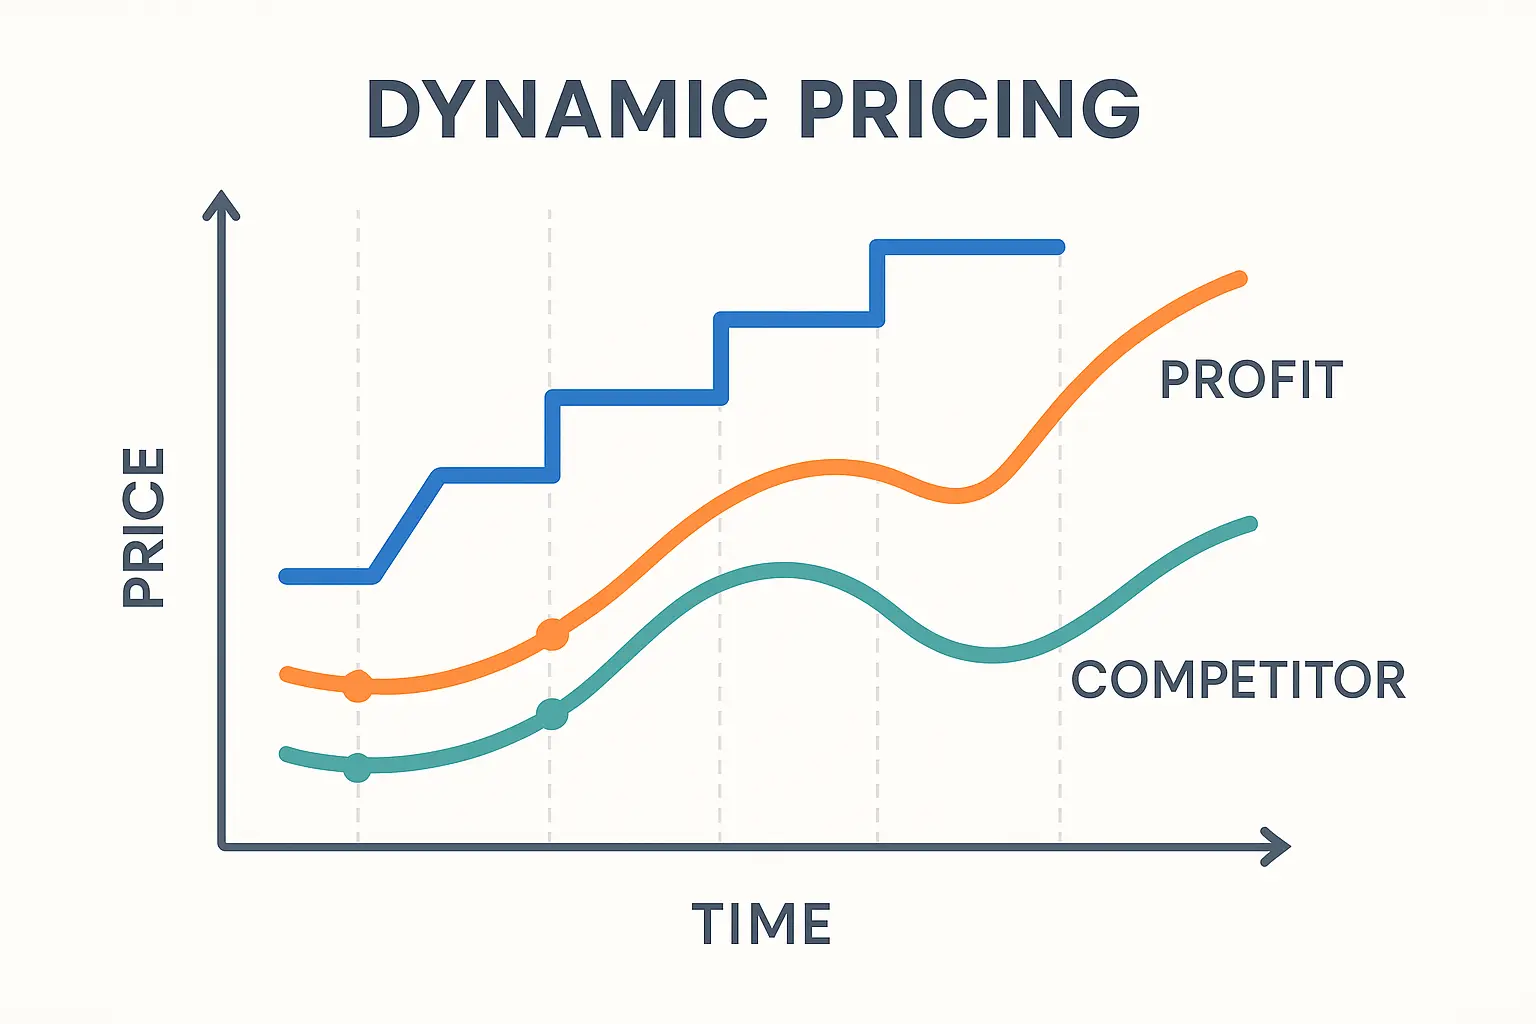
Dynamic Pricing: How Price Changes Mess With Everything
Price changes don’t just affect your per-unit profit – they impact demand, inventory speed, storage costs, and where you stand against competitors. Advanced calculators model these connected effects to show the real impact of pricing decisions.
Price elasticity isn’t just some economics textbook concept – it’s something you deal with every single day as an Amazon seller. Drop your price by 10%, and you might see demand jump by 30%. But that also means faster inventory turnover, lower storage costs, and potentially better organic ranking. I learned this when I dropped prices on a slow-moving product and actually increased my total monthly profit despite lower per-unit margins. Go figure.
The best amazon calculator tools simulate these scenarios for you. They’ll show you how a price cut affects total profit (not just per-unit profit) by factoring in increased velocity and reduced storage costs. Sometimes selling more units at lower margins generates higher total profits. This insight completely flipped how I think about pricing strategy.
Competitive pricing dynamics matter too. If you’re in a race-to-the-bottom category, your fba profit calculator should factor in how competitors might respond to your price changes. Being the low-price leader sounds great until everyone matches your price and margins disappear for everybody. I’ve been in several price wars where nobody won except Amazon (through increased sales volume).
Seasonal pricing strategies need sophisticated modeling. Raising prices during peak demand can boost margins, but you need to balance that against potentially losing market share to competitors who keep prices stable. I use dynamic pricing analysis to identify the optimal price points for different seasons and market conditions.
Decoding Amazon’s Fee Maze (So You Don’t Have To)
Amazon’s fee structure is intentionally complex, with category-specific rates, size tiers, weight breaks, and seasonal adjustments that can dramatically mess with your profitability. Understanding these details is crucial for accurate profit calculations and not making stupid decisions.
Amazon’s fee structure feels like it was designed by someone who hates sellers. You’ve got referral fees that change by category, FBA fees based on size and weight tiers, storage fees that shift monthly, and seasonal surcharges that appear without warning. After six years of selling, I still discover new fee types that I didn’t know existed. It’s ridiculous.
The complexity isn’t accidental. Amazon benefits when sellers don’t fully understand their costs – it reduces price sensitivity and keeps more sellers on the platform even when margins are razor-thin. Using a comprehensive fba fees calculator is essential for seeing through this mess and understanding your true costs.
I remember the first time I tried to manually calculate my fees for a new product launch. I spent hours going through Amazon’s fee pages, cross-referencing categories and size tiers, only to discover I’d missed several fees entirely. That’s when it clicked for me that I needed better tools to handle this complexity.
Category-Specific Fees: Why Your Product Classification Matters More Than You Think
Amazon’s referral fees range from 6% to 45% depending on product category, and getting misclassified can cost you thousands in unnecessary fees. Understanding category details and fee structures is essential for accurate profit calculations and smart product selection.
Category selection isn’t just about organization – it directly hits your bottom line. Toys have a 15% referral fee, while automotive parts are only 12%. That 3% difference on a $50 product costs you $1.50 per sale. When you’re selling hundreds of units monthly, these differences add up fast.
Some categories have minimum referral fees that’ll absolutely kill low-priced items. Books have a $1.80 minimum referral fee, which means selling a $5 book costs you 36% in referral fees alone. Your fba calculator needs to catch these minimums before you commit to inventory.
Certain categories have additional fees that most sellers don’t know about. Media products (books, music, video) have closing fees on top of referral fees. Jewelry over $250 requires additional authentication services. I discovered this when I tried expanding into higher-end accessories and got hit with unexpected authentication costs that nobody warned me about.
Here’s what’s really messed up – Amazon sometimes reclassifies products without notice. I’ve seen sellers wake up to find their products moved to higher-fee categories, instantly cutting their margins. Regular monitoring with an amazon seller calculator is essential for catching these changes before they wreck your bottom line.
Let me give you a real example – a seller had their silicone phone case moved from “Electronics Accessories” (8% referral fee) to “Cell Phones & Accessories” (15% referral fee) after Amazon reclassified it. On a $20 product selling 500 units monthly, this change cost them $700 in additional fees per month – equivalent to losing 35 units of profit. That’s brutal.
Storage Costs: The Hidden Profit Killer
Storage fees look small on a per-unit basis but can absolutely destroy profitability for slow-moving inventory or oversized products. Understanding monthly storage rates, long-term storage fees, and seasonal adjustments is crucial for keeping healthy margins.
Monthly storage fees look innocent – $0.87 per cubic foot for standard-size items during non-peak months. But that adds up crazy fast for large or slow-moving products. I learned this lesson with a bulky home goods item that seemed profitable until I factored in the storage costs. Then I wanted to kick myself.
Here’s the math that surprises sellers: a product that takes up 1 cubic foot and sells once per month costs $10.44 annually in storage fees alone. If your profit margin is $5 per unit, storage is eating 20% of your profits. This realization made me way more picky about the size and speed of products I choose to sell.
Long-term storage fees are the real killer. After 365 days, Amazon charges $6.90 per cubic foot monthly (or $0.15 per unit minimum). Products that don’t sell become expensive paperweights. I had some seasonal decorations that I thought were just waiting for the right season, but they were actually costing me more in storage than they were worth. Talk about a learning experience.
Oversized items face even worse costs. Storage fees for oversized products can be 2-3x higher than standard items, and the long-term storage fees are proportionally higher too. Using an fba cost calculator that accurately models these costs is essential for oversized product evaluation.
Peak season storage (October-December) costs nearly double the standard rates. That same cubic foot that costs $0.87 in January costs $2.40 in November. Your Q4 inventory planning needs to factor in these increased costs, or your holiday profits will disappear into storage fees.
Seasonal Surcharges: When Profitable Products Become Money Losers
Amazon’s peak season surcharges can add $0.35-$4.80 per unit to your fulfillment costs during Q4, turning profitable products into money losers if you’re not prepared. Understanding and planning for these seasonal adjustments is crucial for staying profitable during high-volume periods.
Peak season surcharges hit when you can least afford them – during your highest volume period. Amazon adds these fees from October 15 through January 14, right when most sellers are pushing their biggest inventory. I got blindsided by these surcharges during my second holiday season and watched my expected profits evaporate. Not fun.
The surcharges vary by size tier. Small standard items see an additional $0.35 per unit, while large bulky items get hit with an extra $4.80. For high-volume sellers, these fees can add thousands to monthly costs. My fba calculator now automatically factors in these seasonal adjustments when I’m planning Q4 inventory.
What makes this particularly painful is the timing. You’ve already committed to inventory levels and pricing strategies based on normal fulfillment costs. When surcharges kick in, you’re stuck with the higher costs unless you want to raise prices during peak selling season – which nobody wants to do.
Smart sellers factor these surcharges into their Q4 planning from day one. They either build the extra costs into their pricing or accept lower margins during peak season as the cost of accessing Amazon’s massive Q4 traffic. I’ve learned to view these surcharges as the price of admission to holiday sales rather than unexpected costs.
The surcharges also affect inventory strategy. Some sellers shift to FBM during peak season to avoid the extra fees, while others front-load inventory in September to minimize the impact. Understanding your amazon profit during different seasons requires accounting for these fee swings.
|
Product Size Tier |
Standard FBA Fee |
Peak Season Surcharge |
Total Peak Fee |
% Increase |
|---|---|---|---|---|
|
Small Standard |
$3.22 |
$0.35 |
$3.57 |
10.9% |
|
Large Standard |
$4.75 |
$1.25 |
$6.00 |
26.3% |
|
Small Oversize |
$9.73 |
$2.40 |
$12.13 |
24.7% |
|
Large Bulky |
$75.78 |
$4.80 |
$80.58 |
6.3% |
*Fees shown are examples and vary by specific dimensions and weight
Tool Selection and Implementation Strategies
Choosing the right FBA calculator can make the difference between profitable growth and expensive mistakes. The landscape ranges from basic free tools to sophisticated platforms, each serving different needs and business sizes. Your choice should match your current operation size and where you want to go.
I’ve used probably a dozen different amazon fba calculator tools over the years, from Amazon’s basic offering to premium platforms costing hundreds monthly. Each has its place, but understanding what you actually need versus what sounds cool can save you money and headaches.
The fba calculator market has exploded recently, with new tools launching all the time. Some offer real innovation, while others are just repackaged versions of existing solutions. I’ve learned to focus on functionality that directly impacts my decision-making rather than getting distracted by flashy features I’ll never use.
Free vs Premium: What You Actually Get for Your Money
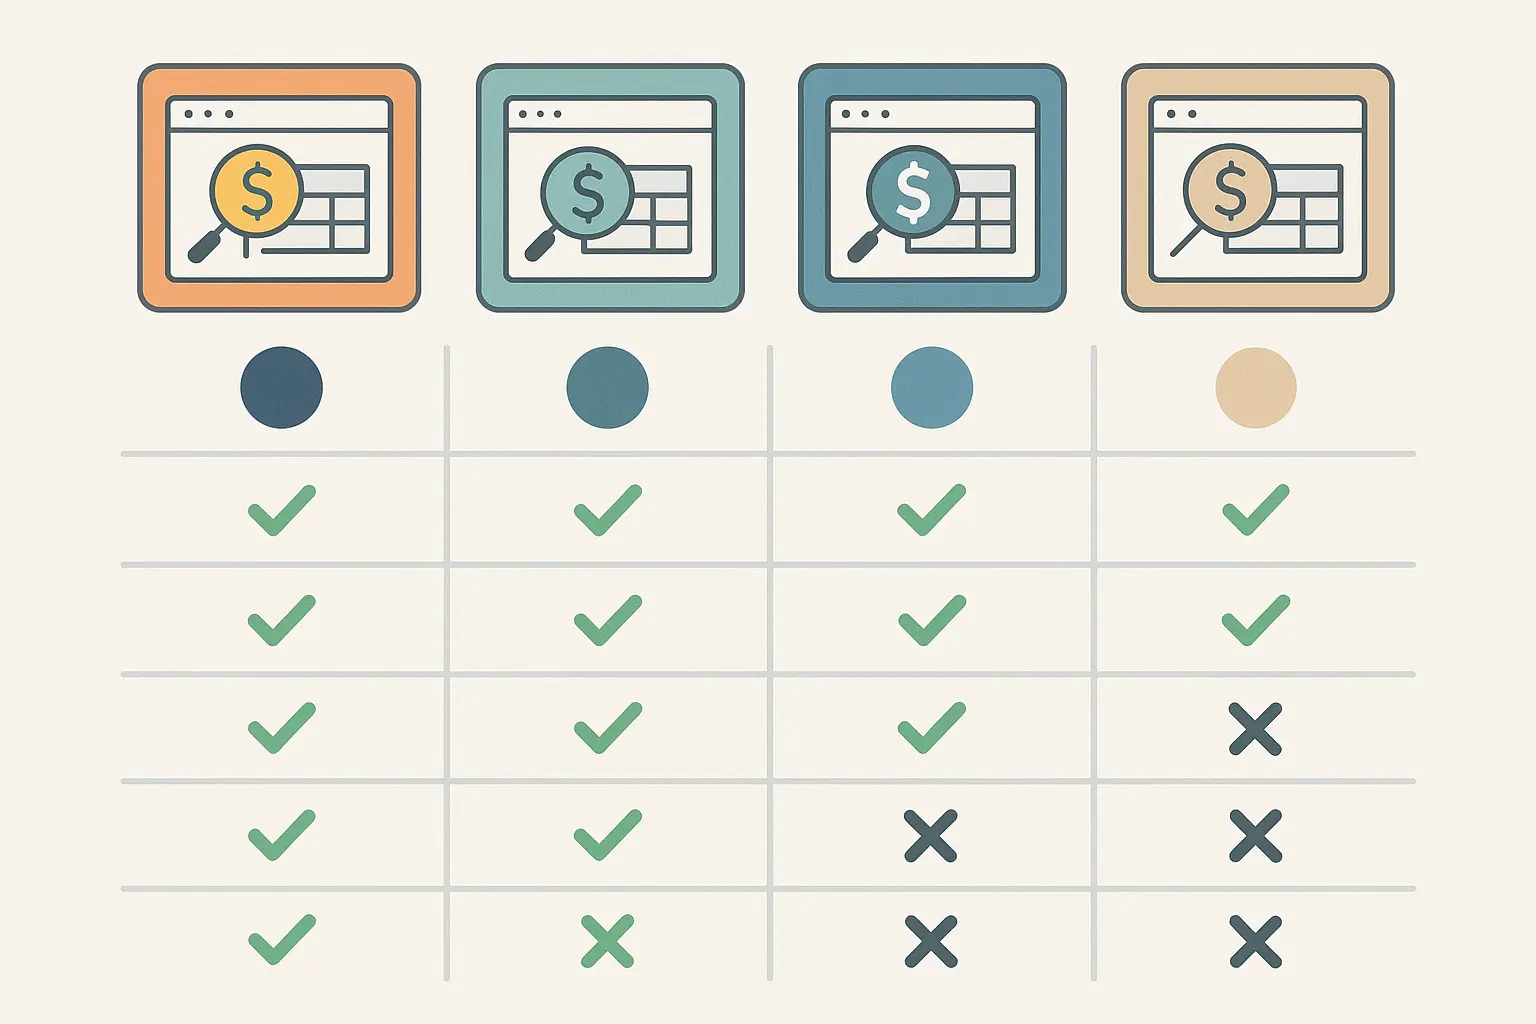
The calculator market spans from Amazon’s basic free tool to premium platforms costing hundreds monthly. Understanding what features justify the cost difference helps you choose tools that match your business needs without overpaying for stuff you won’t use.
The free vs premium debate isn’t just about budget – it’s about what level of sophistication your business actually needs. Amazon fba calculator free options handle basic profit calculations, but premium tools offer automation, bulk processing, and insights that can transform your operation.
Free fba calculator tools work fine if you’re analyzing a few products manually. But once you’re researching dozens of products weekly or managing a large catalog, the time savings from premium features become worth the investment. I made the switch to premium tools when I realized I was spending 10+ hours weekly on manual calculations. That’s when I knew something had to change.
Amazon’s Built-In Calculator: Good Enough or Just Getting Started?
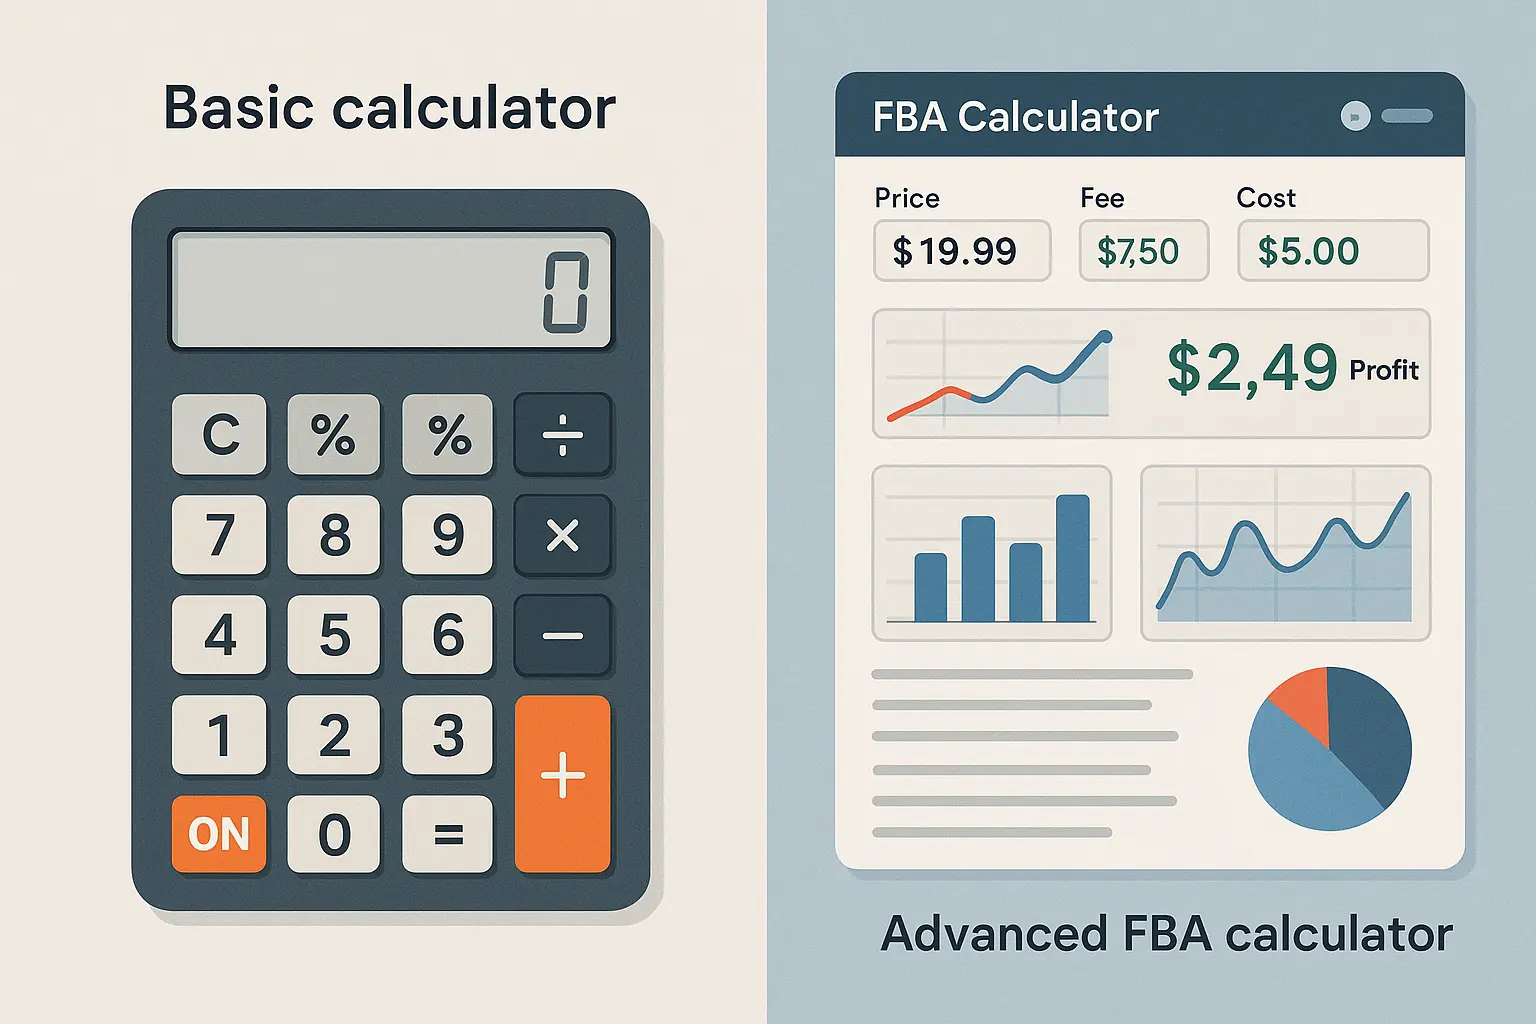
Amazon’s native FBA calculator provides basic profit calculations through Seller Central but lacks the advanced features and automation that serious sellers need. It’s a decent starting point but has significant limitations for growing businesses.
Amazon’s amazon calculator fba does the basics competently. You enter your product details, and it spits out estimated fees and profit margins. For sellers just starting out or analyzing a few products, it’s perfectly fine. I used it exclusively for my first six months selling.
The limitations become obvious pretty quickly though. No bulk processing means analyzing multiple products is tedious as hell. No historical data means you can’t track how fees or profitability have changed over time. No automation means you’re manually entering data for every single calculation.
The interface feels dated compared to modern tools. You’re copying and pasting ASINs, manually entering dimensions, and working through calculations one at a time. It’s functional but not efficient. After using more advanced tools, going back to Amazon’s calculator feels like using a flip phone after you’ve had a smartphone.
Where Amazon’s calculator really falls short is integration. It doesn’t connect with your inventory management system, pull data from your listings automatically, or sync with other business tools. You’re working in isolation, which becomes a real problem as your business grows.
For established sellers, Amazon’s amazon fba calculator becomes a bottleneck. You need something that scales with your business and provides the automation and insights that drive growth rather than just basic number crunching.
Premium Solutions: When the Investment Pays Off
Premium FBA calculators offer advanced features including bulk processing, historical analysis, and business intelligence that can justify their cost for serious sellers. The key is matching features to your actual business needs.
Premium calculators transform FBA analysis from a manual chore into an automated system that actually helps you make better decisions. They pull data automatically, process calculations in bulk, and provide insights that free fba calculator tools simply can’t match. The efficiency gains alone often justify the cost.
Sellerboard amazon fba profit calculator excels at profit analytics and connects directly with your Amazon account to pull real sales data. Instead of guessing, you’re working with actual performance metrics. The historical analysis shows how your profitability has changed over time and identifies trends that inform strategic decisions.
AMZScout focuses on product research and market analysis. Their fba calculator integrates with extensive product databases, showing you profitability plus market demand, competition levels, and opportunity scores. It’s particularly strong for finding new products to sell rather than just analyzing existing ones.
Bulk processing capabilities alone can justify the cost for active sellers. Instead of analyzing products one at a time, you can upload spreadsheets with hundreds of ASINs and get complete profitability analysis in minutes. This capability completely transformed how I evaluate potential product lines.
The reporting features provide insights that free tools can’t match. You can track profitability trends, identify your most and least profitable products, and spot opportunities for optimization across your entire catalog. These insights drive strategic decisions rather than just tactical ones.
When evaluating premium calculator features, consider applying the same systematic approach used in SEO tool evaluations to ensure you’re getting measurable ROI from your investment.
Premium Calculator Evaluation Checklist:
-
☐ Real-time Amazon data integration
-
☐ Bulk processing capabilities (minimum 50+ products)
-
☐ Historical trend analysis
-
☐ Competitive pricing intelligence
-
☐ Automated fee updates
-
☐ Export functionality for reporting
-
☐ API access for custom integrations
-
☐ Multi-marketplace support
-
☐ Customer support quality and response time
-
☐ Cost per calculation vs. expected usage volume
Browser Extensions: Your Secret Weapon for Product Research
Browser extensions bring FBA calculations directly to Amazon product pages, enabling instant profit analysis during product research. These tools eliminate the hassle of switching between tabs and manual data entry, making product evaluation seamless and efficient.
Browser extensions changed how I research products completely. Instead of copying ASINs and switching between tabs, I get instant profit calculations right on the Amazon page I’m viewing. The fba calculator chrome extension tools available today integrate seamlessly with your browsing workflow.
The speed advantage is enormous. You can evaluate dozens of products in the time it used to take to analyze a few. When you’re scanning through search results or checking competitor products, instant calculations keep your research momentum going. This efficiency has allowed me to expand my product research significantly.
Based on recent developments, “Amazon offers several pricing tools to help you stay competitive” through their Pricing Health dashboard, but browser extensions provide real-time competitive analysis that goes beyond Amazon’s built-in tools.
Real-Time Calculations While You Browse
Browser extensions provide instant FBA calculations directly on Amazon product pages, showing profit margins, fees, and ROI without leaving the page. This seamless integration dramatically speeds up product research and competitive analysis workflows.
The best fba calculator extension tools pull product data automatically from the Amazon page you’re viewing. Dimensions, weight, category, current price – everything gets populated automatically. You just need to enter your cost and target profit margin, and the calculations appear instantly.
Real-time fee calculations mean you’re always working with current Amazon fee structures. The extension updates automatically when Amazon changes their fees, so you’re never working with outdated information. This real-time accuracy has saved me from several bad product decisions.
What really makes extensions powerful is the context they provide. You can see profit calculations while reading reviews, checking competitor pricing, or analyzing sales rank. All the information you need for product decisions is right there on one screen instead of scattered across multiple tools.
Some extensions go beyond basic calculations. They show estimated sales volume, competition levels, and even seasonal trends. You get a complete product evaluation without leaving the Amazon page. The amazon fba price calculator functionality built into these extensions rivals standalone tools.
The visual integration is seamless. Profit data appears in overlays or sidebar panels that don’t mess with Amazon’s interface. You can browse normally while having instant access to profitability insights. This integration feels natural after you get used to it.

Automation Features That Actually Save Time
Advanced browser extensions offer automation features including bulk analysis, watchlist monitoring, and alert systems that transform product research from a manual process into an efficient, systematic operation. These features become essential as your product research scales up.
Bulk analysis features let you select multiple products from search results and calculate profitability for all of them at once. Instead of clicking through dozens of individual products, you get a spreadsheet with profit analysis for entire categories. This bulk capability has revolutionized how I evaluate new market opportunities.
Watchlist functionality monitors products you’re interested in and alerts you when profitability changes. Price drops, fee adjustments, or ranking changes that affect your calculations trigger notifications so you don’t miss opportunities. I’ve caught several profitable opportunities through these automated alerts.
Historical tracking shows how product profitability has changed over time. You can spot seasonal patterns, identify trending products, or see when competitors have adjusted their pricing strategies. This historical context helps inform timing decisions for product launches and inventory planning.
Export capabilities let you build databases of profitable products with all the calculation data included. You can sort by profit margin, ROI, or any other metric to prioritize your product selection decisions. My product research database has become one of my most valuable business assets.
Some extensions integrate with inventory management systems or sourcing platforms, creating automated workflows that streamline your entire product research and procurement process. The amzscout fba calculator extension, for example, connects with their broader product research ecosystem.
Here’s a real example – a seller using Helium 10’s browser extension discovered that a competitor’s kitchen gadget dropped from $29.99 to $24.99, improving the profit opportunity by 8%. The extension’s alert system notified them within hours, allowing them to source similar products before other sellers noticed the price change. This early detection resulted in securing inventory at better margins worth an additional $2,400 in quarterly profits.
Regional and Market-Specific Considerations
Amazon’s global marketplace means different fee structures, tax implications, and regulatory requirements across regions. What works profitably in the US market might lose money in the UK or EU due to different cost structures and market dynamics. Understanding these regional differences is crucial for international expansion.
I learned about regional differences the hard way when I tried to replicate my US success in the UK market. The fba calculator usa tools I was using didn’t account for VAT, different fee structures, and Brexit-related complications. What looked like a 20% margin product in my US calculations became an 8% margin product in the UK reality. That was a wake-up call.
Currency fluctuations add another layer of complexity to international selling. Your costs might be in USD while your revenue comes in GBP or EUR, creating exchange rate risk that can swing your profitability significantly. I’ve seen quarterly profits disappear due to unfavorable currency movements that I hadn’t hedged against.
US Market: The Big Leagues with Big Complexities
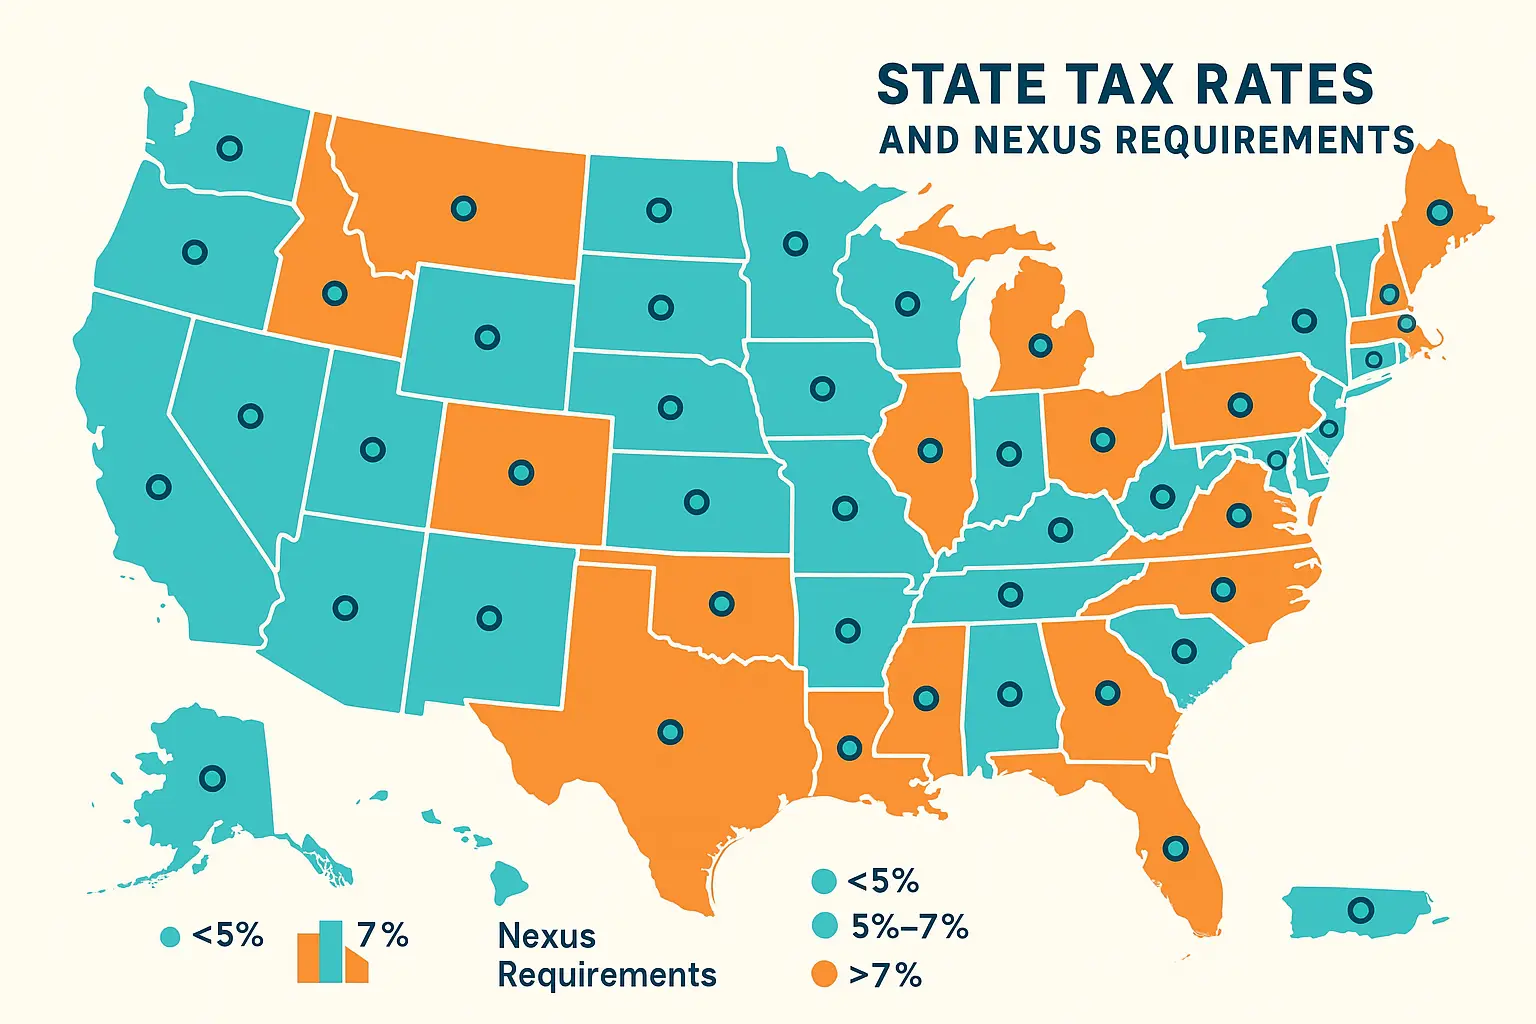
The US market offers the largest opportunity but comes with unique challenges including state-specific sales tax requirements, competitive pricing pressure, and complex fee structures that vary significantly from international markets. Success requires understanding these US-specific nuances.
The US market is where most sellers want to be – it’s the largest, most liquid Amazon marketplace with the highest customer spending power. But success here requires understanding complexities that don’t exist in smaller markets. The fba calculator us tools need to account for these unique American challenges.
Competition is absolutely fierce. With millions of sellers fighting for visibility, pricing pressure is constant. Your amazon fba calculator usa needs to account for the reality that margins get compressed quickly when competitors can easily match your prices. I’ve been in categories where profitable products became break-even within months due to competitive pressure.
Sales tax compliance adds another layer of complexity that’ll drive you crazy. You’re potentially liable for collecting sales tax in states where you have nexus, and those obligations change as your business grows. Some calculators now include sales tax estimates, but most sellers need separate tax compliance tools to handle this properly.
US Fee Structures: What Makes America Different
US Amazon fees include unique category structures, size tiers, and minimum fees that differ from international markets. Understanding these US-specific fee calculations is essential for accurate profitability analysis and competitive pricing strategies.
Fba calculator us tools need to handle some unique quirks compared to international markets. Certain categories have different fee structures, and minimum fees can be higher or lower depending on the product type. I discovered this when expanding into grocery products, which have completely different fee calculations that caught me off guard.
FBA fee tiers in the US are more granular than some international markets. The size and weight breaks that determine your fulfillment costs are specific to the US fulfillment network and don’t translate directly to other regions. I made the mistake of assuming European size tiers would be similar and miscalculated my costs significantly.
Return processing fees in the US market can be higher due to customer expectations around free returns. Your fba profit calculator should factor in higher return rates and associated costs compared to markets where return policies are less generous. American customers return products at nearly double the rate I see in other markets.
The US also has unique programs that affect fee calculations. Subscribe & Save offers customer discounts but also changes your fee structure and requires different profitability analysis. These program-specific fees can impact your margins in ways that standard calculators don’t capture.
Sales Tax: The Profit Killer Nobody Talks About
US sales tax obligations can reduce net profits by 6-10% depending on your nexus states and customer locations. Many FBA calculators don’t include sales tax in their profit calculations, leading to overestimated margins and cash flow surprises.
Sales tax is the hidden cost that catches many sellers completely off guard. You might calculate a 25% profit margin, but after sales tax obligations, you’re looking at 15-18% actual profit. This gap between calculated and actual profitability has tripped up countless sellers I know.
Economic nexus laws mean you’re potentially liable for sales tax in any state where you exceed certain sales thresholds – typically $100,000 in sales or 200 transactions annually. As your business grows, you’ll trigger nexus in more states, increasing your compliance burden and reducing your net margins.
Amazon collects sales tax for you in most states, but they deduct it from your payouts. That $100 sale becomes $92-94 after sales tax, depending on the customer’s location. Your profitability calculations need to account for this reduction, or you’ll consistently overestimate your cash flow.
Some states have marketplace facilitator laws that shift tax collection responsibility to Amazon, while others still require you to handle it directly. The complexity varies by state and changes regularly as tax laws evolve. Staying compliant requires ongoing attention and often professional help.
The cash flow impact is significant. Amazon deducts sales tax from your payouts, but you might not remit those taxes to states for weeks or months. You need to track and reserve these funds properly to avoid cash flow problems when tax payments come due.
International Markets: Different Rules, Different Opportunities
International Amazon markets offer growth opportunities but require understanding region-specific fee structures, VAT requirements, and regulatory compliance. Each market has unique characteristics that affect profitability calculations and business strategies.
International expansion sounds appealing until you dive into the details. Each Amazon marketplace has different fee structures, tax requirements, and competitive dynamics that can make or break your profitability. The uk fba calculator tools I use handle completely different variables than their US counterparts.
Currency fluctuations add another variable to international calculations. Your costs might be in USD while your revenue is in GBP or EUR, creating exchange rate risk that affects your actual profits. I’ve learned to hedge currency exposure on larger inventory purchases to protect my margins.
UK and EU: Brexit, VAT, and Everything In Between
UK and EU markets involve complex VAT calculations, Brexit-related changes to cross-border selling, and different fee structures that require specialized calculation approaches. These markets offer opportunities but demand careful financial planning and compliance management.
Brexit fundamentally changed how UK and EU selling works. What used to be one integrated market is now two separate regions with different VAT requirements, customs procedures, and inventory management challenges. My uk fba calculator now needs to account for these post-Brexit realities.
VAT calculations are way more complex than US sales tax. You’re dealing with different VAT rates by country and product category, plus potential import VAT on inventory shipments. Your calculator needs to handle these multi-layered tax obligations, or you’ll underestimate your true costs significantly.
UK VAT registration becomes mandatory once you exceed £85,000 in sales, but EU VAT thresholds vary by country and can be as low as €35,000. You might need VAT registrations in multiple countries as your business grows, each with different rates and filing requirements.
Cross-border inventory management got complicated post-Brexit. Inventory in UK fulfillment centers can’t serve EU customers as easily, and vice versa. This affects your storage costs and inventory planning strategies in ways that pre-Brexit calculators didn’t anticipate.
Currency hedging becomes important when you’re dealing with GBP and EUR revenue streams. Exchange rate movements can swing your profitability by 10-15% or more, making financial planning more challenging. I now factor currency risk into all my international expansion decisions.
The fee structures in UK and EU markets differ from the US in subtle but important ways. Referral fees might be similar, but FBA fees, storage costs, and return processing fees can vary significantly. Using region-specific fba calculator tools is essential for accurate projections.
International expansion requires comprehensive analytics tracking to monitor performance across different regions and currencies, ensuring your profitability calculations remain accurate as you scale globally.
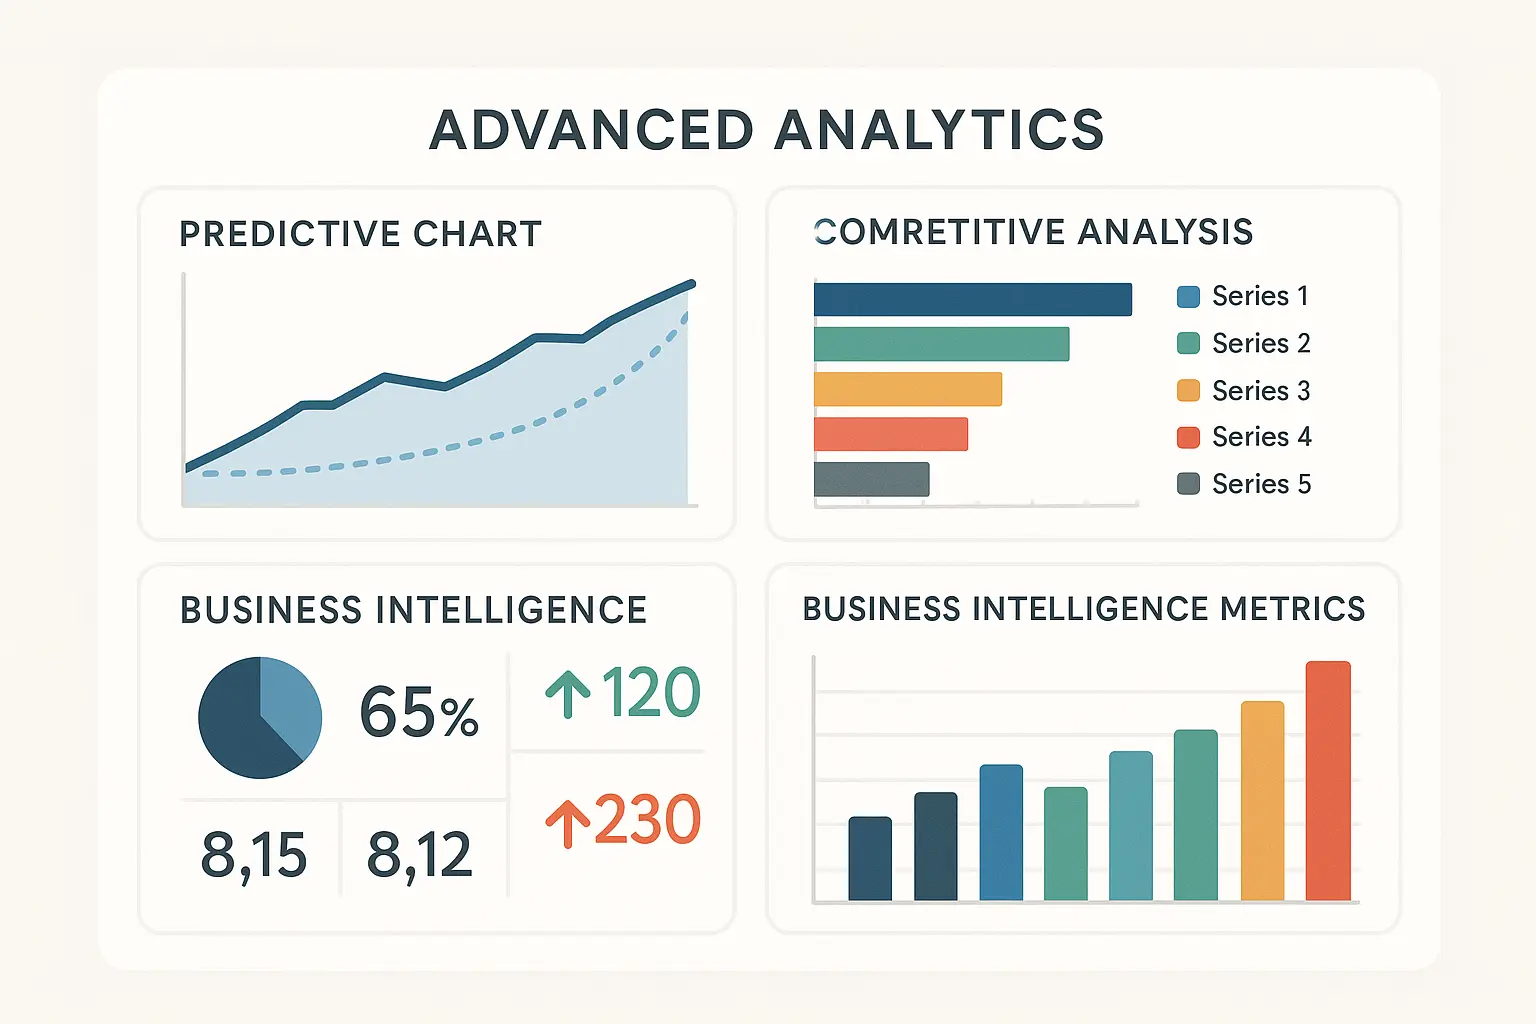
Advanced Analytics and Business Intelligence
Modern FBA calculators have evolved into comprehensive platforms that provide predictive analytics, competitive insights, and strategic planning tools. These advanced features separate successful sellers from those just breaking even by enabling data-driven decision making at scale.
The evolution from basic fba calculator tools to sophisticated business intelligence platforms has been remarkable. What started as simple fee calculators now offer predictive modeling, competitive analysis, and strategic planning capabilities that rival enterprise-level tools.
I’ve watched this transformation firsthand over the past few years. The sellerboard amazon fba profit calculator I use today provides insights that would have required a team of analysts just a few years ago. The democratization of these advanced analytics tools has leveled the playing field for smaller sellers.
The fba revenue calculator amazon platforms now integrate machine learning algorithms that can predict market trends, identify optimization opportunities, and even suggest strategic pivots based on your performance data. This intelligence transforms how you approach business planning and competitive strategy.
Profit Optimization: Beyond Basic Calculations
Advanced profit optimization involves strategic analysis of pricing, inventory levels, and market positioning rather than just calculating current margins. Smart sellers use sophisticated tools to identify optimization opportunities and predict the impact of strategic changes before implementing them.
Profit optimization is where advanced fba calculator tools really shine. Instead of just telling you what your current margins are, they help you understand what they could be with strategic adjustments. This forward-looking approach has completely transformed how I make business decisions.
The best tools simulate different scenarios automatically. What happens if you raise prices by 5%? How does inventory velocity change if you lower prices by 10%? These what-if analyses help you make strategic decisions based on data rather than gut feelings. I use scenario modeling for every major pricing or inventory decision now.
Market positioning analysis shows you where your products sit relative to competitors. Are you the premium option, the value play, or stuck in the middle? Understanding your position helps you optimize pricing and positioning strategies. This analysis revealed that several of my products were underpriced relative to their market position.
Competitive Analysis: Know Your Enemy (And Their Margins)
Advanced calculators integrate competitive pricing data and market analysis to help sellers understand their competitive position and identify opportunities for differentiation. This intelligence enables strategic pricing decisions that go beyond simple cost-plus calculations.
Competitive analysis transforms your amazon fba profit calculator from a cost tool into a strategic weapon. The best platforms pull competitor pricing data and estimate their margins based on similar cost structures. This intelligence has helped me identify vulnerable competitors and market opportunities.
Price tracking shows you how competitors adjust their pricing over time. You can spot patterns, identify price wars before they start, and time your own pricing changes for maximum impact. I’ve avoided several unprofitable price wars by recognizing the patterns early.
Market share analysis helps you understand the competitive landscape. Are you fighting for scraps in an oversaturated market, or is there room for growth? This intelligence guides your product selection and investment decisions. I’ve exited several categories after competitive analysis showed limited growth potential.
Some tools estimate competitor inventory levels and sales velocity, giving you insights into their business performance. You can identify struggling competitors who might be vulnerable to aggressive pricing or successful ones worth emulating. This competitive intelligence has informed several successful product launches.
Review analysis integration shows you what customers value most about competing products. This qualitative data helps you understand why certain products command premium pricing and how you might differentiate your offerings. Customer sentiment analysis has guided several product improvement initiatives.
Based on the latest insights, “SmartScout releases The Voice of the Amazon Seller 2025 Report” highlighting how data-driven competitive intelligence has become essential for modern Amazon sellers navigating increasingly complex marketplaces.
Inventory Optimization: The Cash Flow Connection
Advanced inventory optimization balances storage costs, cash flow requirements, and deman d forecasting to minimize carrying costs while avoiding stockouts. Smart calculators provide recommendations that optimize total profitability rather than just per-unit margins.
Inventory optimization is where many sellers leave serious money on the table. They focus on per-unit profits while ignoring the cash flow and storage cost implications of their inventory decisions. Advanced fba calculator tools help you optimize the entire inventory equation.
Demand forecasting helps you right-size your inventory orders. Overordering ties up cash and increases storage costs, while underordering leads to stockouts and lost sales. Advanced calculators use historical data and seasonal patterns to optimize order quantities. This forecasting has reduced my inventory carrying costs by 30%.
Cash flow modeling shows you how inventory decisions affect your working capital. That bulk order might save you money per unit, but it could also strain your cash flow for months. The best tools help you balance unit economics with cash flow requirements.
Storage cost optimization identifies products that are costing more to store than they’re worth. Long-term storage fees can turn profitable products into money losers if they sit too long in Amazon’s warehouses. I now use automated alerts to identify slow-moving inventory before it becomes a liability.
Seasonal planning tools help you prepare for demand fluctuations and peak season surcharges. You can model different inventory strategies and see their impact on total profitability throughout the year. This seasonal modeling has improved my Q4 performance significantly.
Market Opportunity Identification: Finding Your Next Winner
Advanced calculators analyze market gaps and profit opportunities by combining profitability data with market research, helping sellers identify high-potential product categories and niches before they become oversaturated with competition.
Market opportunity identification is where advanced analytics really pay off. Instead of reacting to market changes, you can identify opportunities before your competitors do. The fba calculator widget tools I use now provide opportunity scoring that ranks potential products by profit potential and market dynamics.
Gap analysis shows you underserved market segments where demand exceeds supply. These gaps represent opportunities for new product launches or category expansion with less competitive pressure. I’ve launched three successful products based on gap analysis insights.
Trend analysis identifies emerging product categories or seasonal opportunities. You can spot growing markets early and position yourself before they become crowded with competitors. Early trend identification has been crucial for staying ahead of market saturation.
Profitability scoring combines multiple factors – margins, demand, competition, barriers to entry – into composite scores that help you prioritize opportunities. Instead of chasing every shiny object, you focus on the opportunities with the best risk-adjusted returns.
Market sizing tools estimate the total addressable market for different product categories. This helps you understand whether an opportunity is worth pursuing and how much you might invest in inventory and marketing. Market sizing analysis prevented me from entering several small, limited markets.
Keyword opportunity analysis shows you search terms with high commercial intent but low competition. These insights help you identify product opportunities that align with customer demand patterns. Keyword-driven product selection has improved my launch success rate considerably.
When identifying market opportunities, applying proven topic research methodologies can help you discover underserved niches and customer pain points that translate into profitable product opportunities.

Integration with Seller Analytics Platforms
Modern FBA calculators integrate with comprehensive seller analytics platforms, creating unified dashboards that combine profitability calculations with sales performance, advertising metrics, and inventory management. This integration provides holistic business intelligence for strategic decision making.
Platform integration is what separates advanced calculators from basic tools. Instead of working with isolated profit calculations, you get comprehensive business intelligence that connects profitability with all aspects of your Amazon business. The fba calculator platforms I use now serve as central command centers for my entire operation.
Data synchronization across platforms eliminates manual data entry and ensures consistency across your business tools. Your profitability calculations automatically update when sales data changes, inventory levels shift, or advertising costs fluctuate. This real-time synchronization has eliminated countless hours of manual reconciliation work.
Multi-Platform Data: The Complete Picture
Multi-platform data synchronization connects FBA calculators with Seller Central, advertising consoles, inventory management systems, and other business tools to provide comprehensive analytics that inform strategic decisions across all aspects of your Amazon business.
Multi-platform integration creates a single source of truth for your business data. Instead of juggling multiple tools with inconsistent information, you get unified reporting that shows the complete picture. This integration has transformed how I understand my business performance.
Seller Central integration pulls real sales data, inventory levels, and performance metrics directly into your profitability calculations. You’re working with actual performance rather than estimates, making your analysis more accurate and actionable. Real-time data integration has improved my decision-making speed significantly.
Advertising console integration shows you how PPC costs affect your true profitability. You might have great margins on paper, but if you’re spending 15% of revenue on advertising, your actual profits are much lower. Integrated advertising data revealed that several of my “profitable” products were actually break-even after ad spend.
Inventory management system integration helps you optimize purchasing decisions based on profitability analysis. You can prioritize reorders for your most profitable products and phase out underperformers systematically. This integration has streamlined my inventory planning process considerably.
Financial system integration connects your profitability analysis with cash flow management and tax planning. You get a complete view of how product decisions affect your overall business financial health. This holistic view has improved my strategic planning significantly.
Effective multi-platform integration requires the same systematic approach used in tool evaluation processes, ensuring each platform serves a specific purpose and integrates seamlessly with your overall business intelligence strategy.
Multi-Platform Integration Template:
Primary Calculator: [Tool Name]
├── Amazon Seller Central (Sales Data)
├── Amazon Advertising Console (PPC Costs)
├── Inventory Management System (Stock Levels)
├── Accounting Software (Financial Data)
├── Tax Compliance Tool (Tax Obligations)
└── Business Intelligence Dashboard (Reporting)

Data Sync Frequency: [Real-time/Hourly/Daily]
Key Metrics Tracked: [Profit Margins/ROI/Cash Flow/Inventory Turn]
Alert Triggers: [Margin Drops/Stock Outs/Fee Changes]
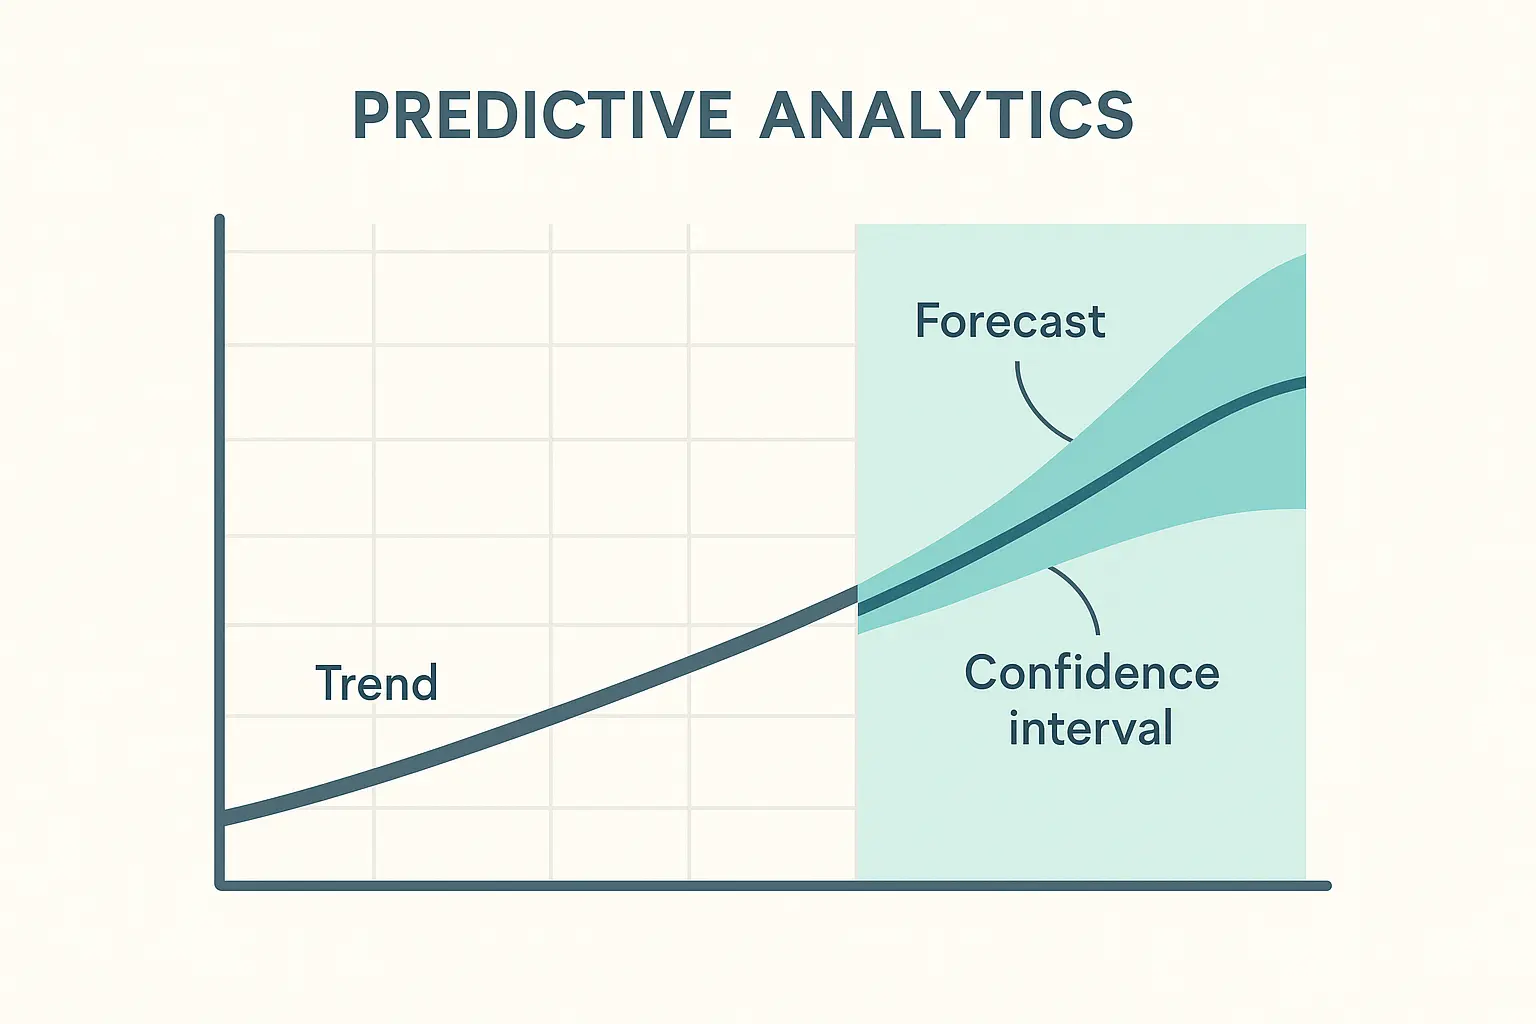
Predictive Analytics: Seeing Around Corners
AI-powered predictive analytics use historical data and market trends to forecast future profitability, seasonal patterns, and market changes. These insights enable proactive decision making rather than reactive responses to market conditions.
Predictive analytics transform your fba calculator from a reporting tool into a strategic planning platform. Instead of just showing you what happened, advanced tools predict what’s likely to happen next. This forward-looking capability has fundamentally changed how I approach business planning.
Seasonal forecasting helps you prepare for demand fluctuations and adjust your inventory and pricing strategies accordingly. You can identify peak periods, plan for storage cost increases, and optimize your product mix for different seasons. Predictive seasonal modeling has improved my inventory efficiency dramatically.
Market trend prediction identifies emerging opportunities and threats before they fully materialize. You might spot a category that’s gaining momentum or identify products that are losing market share to new alternatives. Early trend detection has helped me pivot away from declining categories before losses mounted.
Price elasticity modeling predicts how demand will respond to price changes. This helps you optimize pricing strategies and understand the trade-offs between volume and margin for different products. Elasticity modeling revealed that several of my products had much more pricing power than I realized.
Competitive response modeling predicts how competitors might react to your strategic moves. If you lower prices, will competitors follow? If you launch in a new category, how quickly will competition emerge? This competitive modeling has helped me time market entries more effectively.
Cash flow forecasting connects your profitability projections with working capital requirements, helping you plan financing needs and optimize your capital allocation across different opportunities. Predictive cash flow modeling has prevented several potential cash crunches.
The Marketing Agency’s data-driven approach to Amazon marketing aligns perfectly with the analytical precision required for FBA success. Their expertise in performance attribution and AI-driven market analysis can help you connect your FBA calculator insights with sophisticated marketing strategies that drive both profitability and growth.
By combining accurate profit calculations with advanced marketing intelligence, you can make informed decisions that optimize both your product economics and your marketing ROI. Whether you need help with SEO optimization for high-profit keywords or PPC campaign management that maximizes your calculated margins, The Marketing Agency’s scientific approach to marketing can amplify the insights you’re getting from your FBA analysis.
Final Thoughts
FBA calculators aren’t just number-crunching tools – they’re your strategic compass for navigating Amazon’s complex marketplace profitably. The difference between sellers who thrive and those who struggle often comes down to how well they understand and optimize their unit economics.
Starting with Amazon’s basic calculator is fine, but scaling your business requires tools that match your ambition. Premium calculators with automation, competitive analysis, and predictive features become essential as your operation grows. The time and money you invest in better tools pays dividends through improved decision making and avoided costly mistakes.
Don’t underestimate the regional complexities if you’re expanding internationally. What works in the US won’t necessarily work in the UK or EU, and the tax implications alone can swing your profitability significantly. Plan for these differences rather than discovering them after you’ve committed to inventory and pricing strategies.
The future belongs to sellers who treat FBA calculators as business intelligence platforms rather than simple profit checkers. Competitive analysis, inventory optimization, and predictive analytics separate successful sellers from those just breaking even. Your calculator should inform strategic decisions, not just validate them after the fact.
Trust me on this one – invest in the right tools early, understand your numbers deeply, and use that intelligence to make smarter decisions. Your future self will thank you when you’re scaling profitably instead of just hoping for the best.
