


Table of Contents
- Why Most Businesses Get AI Website Classification Wrong
- Content-Based Classification: The Foundation Layer
- Behavioral and Technical Classification: Reading Between the Lines
- Compliance and Risk Classification: Protection Before Problems
- Business Intelligence Classification: Where Strategy Meets Execution
- How to Choose Classification Types That Matter for Your Business
- Okay, Wrapping This Up
TL;DR
Most companies buy classification tools then figure out what to do with them (backwards). Start with the decision you need to make, then pick 3-5 classification types max that help you make it. Everything else is dashboard decoration.
The 23 types break down as: content stuff (what sites say), behavioral stuff (how they work), compliance stuff (legal cover-your-ass), and business intelligence (actual strategy). Accuracy ranges from 70% (traffic patterns, basically useless) to 99% (technology detection, super reliable).
Real-time costs more but lets you act immediately. Batch processing is cheaper but you’re analyzing yesterday’s data. Pick based on whether you need to react now or can wait.
Also: explainability matters more than accuracy. I’d rather have 85% accuracy where I understand why the AI chose each label than 92% accuracy that’s a black box. You need to know why it made each decision so you can validate and improve the system over time.
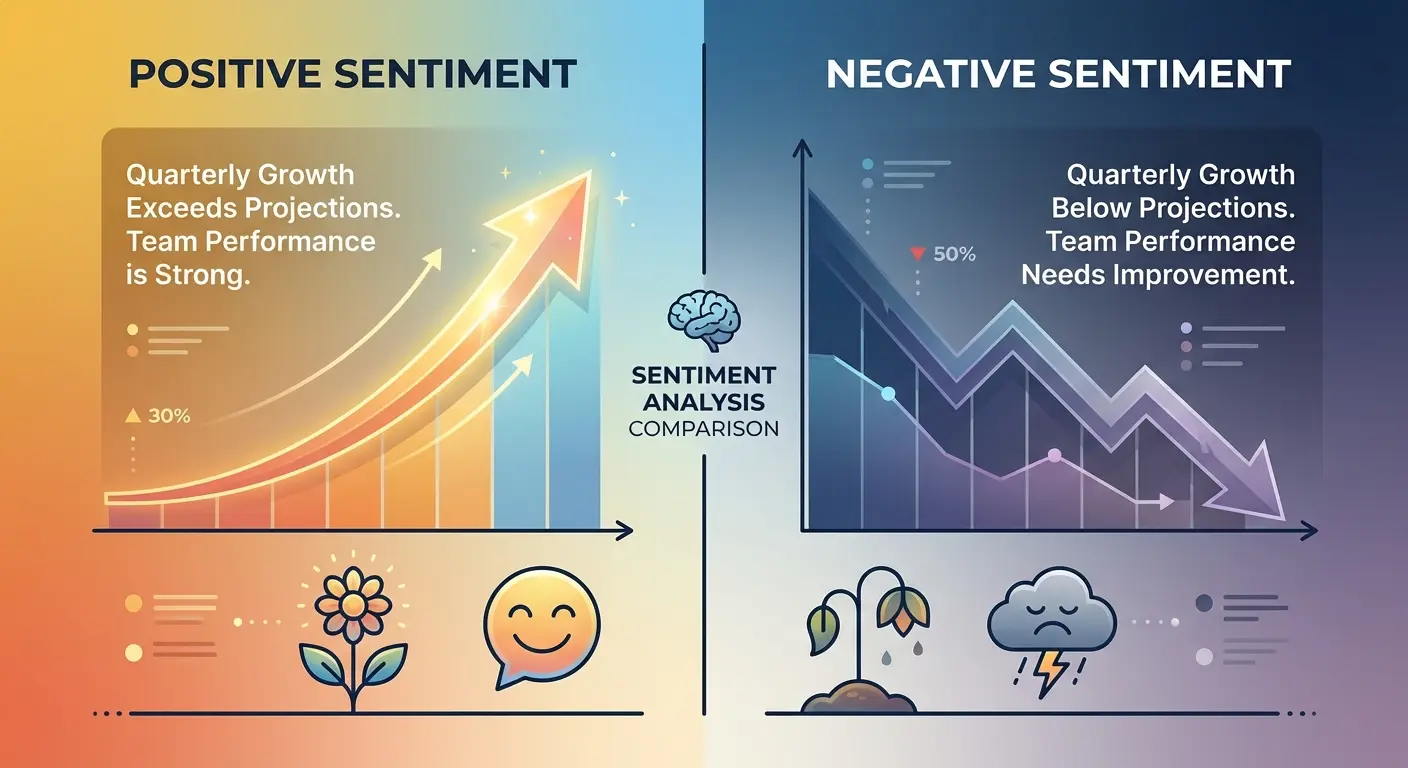
Multi-language support varies wildly. English-biased models fail in global markets. Some types work across languages (technology detection), others fall apart outside English (sentiment analysis drops 20%+ in accuracy).
Model drift is real. Budget for retraining every quarter or watch your accuracy slowly degrade. I’ve seen models lose 15% accuracy over a year without updates.
Why Most Businesses Get AI Website Classification Wrong
Most companies buy AI classification tools the same way I buy kitchen gadgets. They look cool in the demo, then sit unused because I never figured out what problem they actually solve. Except kitchen gadgets cost $49, not six figures.
I’ve watched this play out maybe a dozen times now. Marketing team sees a slick AI demo. Gets excited about “actionable intelligence.” Buys the tool. Three months later, they’ve got dashboards full of beautifully categorized data that nobody looks at because it doesn’t actually answer any question they need answered.
Your lead quality hasn’t improved. Your competitive intelligence sits unused. Your content strategy remains unchanged. But hey, the dashboard looks impressive in presentations.
Something like 80% of enterprise data is unstructured, according to research from Nimbleway. Having seen inside a few dozen companies’ data warehouses, I’d put it closer to 90%, but let’s go with their number. That means most of your data is sitting there in formats nobody can easily analyze, which creates a huge opening for classification systems that transform messy inputs into actionable intelligence.
But only if you start with the right questions.

What actually matters: AI classification should answer specific questions that drive business actions. Which prospects are worth your sales team’s time? Where are your competitors vulnerable? What content gaps are costing you conversions? Which partnerships would accelerate growth?
I’ve watched companies invest six figures in classification tools before defining the business questions those classifications should answer. The result? Expensive data graveyards where classifications exist but don’t influence decisions. This happens because most businesses frame classification as a data collection exercise rather than a strategic decision-making tool.
The companies that succeed with AI website classification start with business objectives and work backward to the right classification approach. They identify the specific decisions that better intelligence would improve, then select classification types that provide that intelligence. This flip, from decision to data rather than data to decision, changes everything.
Content-Based Classification: The Foundation Layer
Content classification analyzes what websites say and how they say it. These seven types are your basic foundation stuff. I’m going to move through them relatively quickly because you’ve probably seen most of this before.
1. Industry Vertical Classification
Industry classification usually works pretty well. You’ll see 88-94% accuracy if you’ve trained it right, based on benchmarks from Google Cloud and AWS, plus my own testing with a few dozen clients. But throw a company like GE at it (healthcare, finance, technology, industrial equipment, what aren’t they doing?) and the model has a minor existential crisis. Single-label classification assumes companies do one thing. Reality is messier.
You’ll need somewhere around 5,000 labeled examples per industry. Could be fewer if your industries are really distinct (pet stores vs. law firms). Could be more if there’s overlap (different types of SaaS companies all blur together). That’s not a small investment in training data, but the payoff is substantial.
Real-time API responses usually clock in at 200-500 milliseconds. I’ve seen as low as 150ms with optimized setups and as high as 800ms when the API is having a bad day. That makes this classification type excellent for dynamic lead routing and content personalization.
The cost structure scales beautifully. Most providers charge $0.001 to $0.005 per classification, which sounds cheap until you’re processing 10 million sites a month and suddenly you’re writing five-figure checks. But for millions of classifications monthly, it’s still reasonable.
Integration is pretty straightforward through REST APIs that plug into most marketing platforms without custom development.
Industry vertical classification shines for lead qualification pipelines, account-based marketing segmentation, and competitive intelligence gathering. Where it struggles: companies pivoting between industries, emerging business models that don’t fit traditional categories, and regional variations in how industries are defined.
2. Content Topic Taxonomy
Hierarchical classification gets progressively harder as you go deeper. Surface-level categorization (Technology vs. Healthcare) hits 92% accuracy. Drill down three levels (Technology > Software > SaaS > Project Management) and accuracy drops 5-8% at each tier.
Pre-trained models give you a head start, but you’ll still benefit from 10,000+ custom examples if you’re working in specialized domains. Response times sit around 500-800 milliseconds, which is acceptable for most real-time applications but slower than simpler classification types.
The integration complexity is moderate because you need to map the AI’s taxonomy to your internal category structure. That’s not technically difficult, but it requires strategic thinking about how classifications flow into your existing systems.
Explainability is strong here. The AI provides confidence scores at each taxonomy level, so you can see exactly where certainty drops off. Multi-language support covers 40+ languages, though accuracy varies. English, Spanish, French, and German perform best. Less common languages see accuracy drops of 10-15%.
I worked with a construction software company last year that wanted to classify competitor websites by specific niche. They started with broad categories (project management, accounting, scheduling) and got 89% accuracy. Easy.
Then they wanted to drill deeper: “Project Management” then “Agile Project Management” then “Agile PM for Construction” then “Agile PM for Commercial Construction.” Each level down, accuracy dropped about 8-10%.
By the fourth level, they were at 68% accuracy, which wasn’t good enough for automated decisions. The problem? At that level of specificity, the training data got sparse. They only had maybe 200 examples of “Agile PM for Commercial Construction” sites, and half of those were ambiguous (was this site really construction-specific or just using construction examples?).
We solved it by creating a custom training set. They manually labeled 12,000 construction software pages. Yes, twelve thousand. It took three months. Got accuracy back up to 82% at the fourth level. Still not perfect, but good enough to filter candidates for human review.
3. Content Sentiment and Tone Analysis
Sentiment and tone classification sits at 78-86% accuracy, which is lower than most content types. Why? Context and culture create massive interpretation challenges. What reads as professional in one industry sounds cold in another. Casual tone in American English translates poorly to German business contexts.
You need diverse training examples across tones, with at least 3,000 per category. That diversity requirement is critical because tone is subjective and culturally dependent in ways that industry classification isn’t.
Response times are excellent at 300-600 milliseconds, and the cost structure is very favorable at scale. Integration is simple through standard APIs. The real challenge is explainability. The AI can highlight tone indicators (word choice, sentence structure, rhetorical patterns), but the interpretation remains somewhat subjective.
Multi-language support is limited. Accuracy drops significantly outside English, particularly for nuanced tone distinctions. You might detect aggressive vs. professional tone in English with 85% accuracy, but that same model might hit only 65% accuracy in Japanese.
Use this classification type for brand voice analysis, competitor messaging evaluation, and content quality assessment. Skip it if you need high-confidence classifications or operate primarily in non-English markets.
4. Content Quality and Authority Scoring
Quality scoring correlates well with human expert ratings, hitting 82-89% accuracy. The AI analyzes citation presence, author credentials, content freshness, domain authority signals, and dozens of other factors to generate composite quality scores.
Response times are slower at 1-2 seconds because the system processes multiple signals simultaneously. You’re not just analyzing text. You’re checking backlinks, social signals, publication dates, and author profiles. That comprehensive analysis takes time.
Integration complexity is high. You need access to multiple data sources beyond the website itself. Backlink databases, social media APIs, domain authority metrics. All of these feed into quality scoring. That means more API integrations, more data costs, and more potential failure points.
The upside? Explainability is excellent. You get detailed scoring across multiple quality dimensions, so you can see exactly why a site scored high or low. That transparency is valuable for content strategy decisions and partnership evaluations. When evaluating content quality alongside knowledge graph optimization strategies, authority scoring becomes particularly valuable for understanding how search engines might interpret your content’s credibility.
Quality signals are somewhat universal, which means multi-language support is good. A well-cited, frequently updated site with strong backlinks signals quality regardless of language.
5. Content Maturity and Age-Appropriateness
Clear violations hit 91-96% accuracy. Explicit content, graphic violence, substance abuse references. These are relatively easy for AI to detect with high confidence. Borderline content drops to 75-82% accuracy because the line between mature themes and inappropriate content is subjective and context-dependent.
You need large, diverse datasets for training, with at least 15,000 examples. That volume requirement exists because edge cases are common and costly. A false negative (missing inappropriate content) creates brand safety risks. A false positive (flagging appropriate content) limits reach unnecessarily.
Response times are good at 400-700 milliseconds, and integration is simple through pre-built APIs. Most platforms offer standard integrations because content maturity classification is widely used in advertising, content distribution, and parental control systems.
Explainability is strong. The AI identifies specific content elements that triggered the classification, so you can validate decisions and adjust thresholds based on your risk tolerance. Multi-language support is excellent. Mature content detection works across languages because the concepts (violence, explicit content, substance references) translate relatively consistently across cultures.
6. Content Format and Media Type
Format detection hits 90-95% accuracy because it’s based on straightforward technical signals. DOM structure (basically how the HTML is organized), media ratios (how much video vs. text), interaction patterns (buttons, forms, that kind of thing). These are measurable, objective characteristics that don’t require subjective interpretation.
Training data requirements are minimal. You can achieve strong performance with just 1,000 examples because the technical signals are clear and consistent. Response times are excellent at 200-400 milliseconds, and the cost structure is extremely favorable.
Integration is very simple through basic API calls. You don’t need complex data pipelines or multiple integrations.
Explainability is perfect because the AI provides exact technical metrics (percentage of page devoted to video, number of interactive elements, text-to-image ratio). Format detection is completely language-agnostic. You’re analyzing technical structure, not content meaning, so the same model works identically across all languages and markets.
Use format classification for content strategy analysis (identifying gaps in your content mix), competitive intelligence (tracking how competitors deliver content), and user experience optimization (matching format to user preferences).
7. Semantic Intent Classification
Intent classification determines whether content aims to inform, sell, entertain, educate, persuade, or support. Accuracy sits at 83-90%, with complex sites featuring multiple intents reducing accuracy.
You need 8,000+ examples with clear intent labeling for training. That labeling requirement is challenging because intent isn’t always obvious, even to human evaluators. A product page might inform and sell simultaneously. A blog post might educate and persuade.
Response times are good at 600-900 milliseconds. Integration is moderate complexity because you need to map AI-identified intents to your business objectives. What does “persuade” mean for your lead scoring? How does “support” intent factor into partnership evaluation?
Explainability is moderate. The AI can identify intent signals (CTAs, product descriptions, educational content markers), but the reasoning can be opaque when multiple intents overlap. Multi-language support is moderate because intent expression varies culturally. Direct sales language common in American English might be considered aggressive in Japanese business contexts. Educational content structures differ across cultures.

Real websites often have multiple intents simultaneously, which is why this classification type requires careful implementation and realistic expectations about accuracy in complex scenarios.
Behavioral and Technical Classification: Reading Between the Lines
Behavioral and technical classification analyzes how websites function and how users interact with them. These six types go beyond content to evaluate architecture, technology, and user experience patterns.
8. User Experience and Accessibility Classification
UX classification is weird because half of it is objective (page speed: either fast or slow) and half is completely subjective (is this design “good”?).
The technical stuff (WCAG compliance, load times, mobile responsiveness) hits 87-93% accuracy because there are actual standards. Does this image have alt text? Yes or no. Easy. Page speed is even better, 90-95%, because milliseconds don’t lie. Mobile responsiveness sits around 88-92%.
But when you ask the AI to judge subjective UX quality? Drops to 79-85%. Which makes sense. I think Craigslist has terrible UX. It’s also one of the most-used websites in America. So what do I know?
You need 5,000+ examples for UX scoring beyond basic technical audits. Response times are moderate at 2-4 seconds because comprehensive audits require headless browser capabilities (a fancy way of saying “loading websites programmatically so you can measure stuff without actually seeing them”) and multiple testing tools running simultaneously.
Integration complexity is high. You need headless browser infrastructure, accessibility testing libraries, and performance monitoring tools. That’s not a simple API call. It’s a full testing suite. Tools like Puppeteer or Playwright handle this. Budget for server costs because headless browsers are resource-intensive. Figure $500-2000/month depending on volume.
Explainability is excellent. You get detailed technical reports with specific issues identified (missing alt text, slow load times, poor color contrast). That specificity makes remediation straightforward.
Multi-language support is good for technical standards (which are universal) but varies for UX assessment (which is culturally dependent). Navigation patterns that work well in Western markets might confuse users in other regions.
9. Conversion Architecture Classification
Conversion architecture classification identifies lead generation, eCommerce, SaaS trial, content subscription, and other conversion patterns. Accuracy sits at 86-92%, which is strong for a classification type with significant business value.
You need 6,000+ examples across conversion types for training. Response times are moderate at 1-3 seconds because the AI maps complete user journeys, not just individual pages. CTA placement, funnel structures, form complexity. All of these factors feed into conversion architecture analysis.
Integration complexity is moderate. The classification becomes significantly more valuable when integrated with analytics platforms, allowing you to correlate conversion architecture with performance data.
Explainability is strong. The AI visualizes conversion paths and identifies key elements (primary CTA, secondary conversion points, friction elements). That visibility helps you understand not just what conversion model a site uses, but how effectively it’s implemented.
Multi-language support is good because conversion patterns are somewhat universal. Forms, CTAs, and checkout flows function similarly across markets, though cultural preferences for conversion friction vary.
10. Security and Trust Signal Detection
Security signal detection hits 93-98% accuracy for technical elements. SSL certificates, privacy policies, security badges, payment processor integrations. These are verifiable technical facts. A valid SSL certificate means the same thing regardless of the site’s language.
Trust assessment drops to 81-87% accuracy because trust involves subjective evaluation beyond technical security. Training data requirements are minimal for technical security checks. You’re looking for presence or absence of specific elements. Fraud detection requires 10,000+ examples because fraudulent sites actively try to mimic legitimate trust signals.
Response times are good at 500-1000 milliseconds.
Integration is simple for basic security checks but becomes complex for comprehensive fraud detection, which requires threat intelligence databases and historical fraud pattern analysis. Explainability is excellent. You get specific security findings (certificate validity, policy completeness, known security vulnerabilities). That specificity is valuable for partnership decisions and vendor risk assessment.
Security signals are technical and universal, so multi-language support is perfect.
11. Technology Stack Identification
Technology stack identification is my favorite classification type (and yes, I have a favorite classification type, which tells you how I spend my weekends) because it’s both accurate and immediately useful.
Technology detection hits 94-99% accuracy for common platforms and frameworks. WordPress, Shopify, React, specific marketing automation tools. These leave clear fingerprints in code signatures, HTTP headers, and DOM patterns. Custom builds drop to 75-85% accuracy because they don’t match known technology signatures.
Training data requirements are minimal because you’re matching against technology fingerprints, not learning patterns. Response times are excellent at 300-600 milliseconds, and integration is very simple through straightforward API responses. Cost structure is extremely favorable and scales beautifully.
Explainability is perfect. You get a list of detected technologies with confidence scores for each. No interpretation required.
Technology detection is completely universal. A React application looks the same technically whether the content is in English, Mandarin, or Arabic.

Use technology stack identification for competitive intelligence (tracking technology adoption trends), lead qualification (identifying prospects using complementary technologies), and partnership discovery (finding integration opportunities).
I once watched a sales team waste three months pursuing a lead that turned out to be using a completely incompatible tech stack. Their product integrated with WordPress. The prospect was on a custom Java framework. Nobody checked until they were deep in negotiations. Technology stack detection could have caught this in about 30 seconds.
According to recent industry analysis from Simplilearn, McKinsey reports that 79% of organizations now use generative AI in at least one business function. That number feels high to me based on what I see with clients, but even if it’s inflated, the trend is real. This rapid adoption means technology stack identification has become critical for competitive intelligence. Companies tracking which competitors have implemented ChatGPT, Claude, or other AI tools can identify strategic shifts before they become obvious in market positioning.
12. Traffic Pattern and Audience Classification
Traffic estimation is one of those classification types that sounds more useful than it actually is. In theory, knowing how much traffic a competitor gets would inform your strategy. In practice, the accuracy is terrible (70-82%), the cost is high because you’re paying for third-party data, and the data itself is based on sampling and modeling rather than actual measurement.
You’re getting educated guesses dressed up as analytics. Some companies use panels of users who’ve installed tracking software. Others use ISP data. Others model based on rankings and industry benchmarks. None of them have complete data, so they’re all estimating. And you’re paying for those estimates at scale, which gets expensive fast.
Training data isn’t the issue here. You need integration with traffic data providers. Response times are poor because traffic analysis often requires batch processing and data aggregation rather than real-time classification.
Integration complexity is high. You need connections to multiple data sources (analytics platforms, ad networks, ISPs) to triangulate traffic estimates. Scalability is expensive because third-party data costs scale with volume.
Explainability is moderate. You get estimates with confidence intervals, but the underlying data sources and methodologies aren’t always transparent. Multi-language support is good because traffic patterns are measurable regardless of content language. Page views, session duration, and bounce rates are universal metrics.
Unless you absolutely need traffic numbers and understand you’re getting ballpark figures at best, I’d skip this classification type entirely. The cost doesn’t justify the accuracy.
13. Monetization Model Detection
Monetization detection hits 84-91% accuracy. The AI identifies advertising, subscription, eCommerce, freemium, affiliate, and lead generation models by analyzing pricing pages, payment integrations, and revenue signal patterns. Sites with multiple monetization models reduce accuracy because the AI struggles with hybrid approaches.
You need 7,000+ examples across monetization types for training. Response times are good at 800-1200 milliseconds. Integration is moderate complexity and benefits from payment processor detection capabilities.
Explainability is strong. The AI identifies specific monetization indicators (pricing tables, subscription CTAs, affiliate disclosures, ad placements). That specificity helps you understand not just what monetization model a site uses, but how aggressively it’s implemented.
Multi-language support is moderate. Pricing terminology and payment conventions vary culturally. “Free trial” might be explicit in English but implied through different language in other markets.
Use monetization model detection for competitive analysis (tracking how competitors generate revenue), partnership evaluation (ensuring revenue model alignment), and market research (identifying emerging monetization trends).
Compliance and Risk Classification: Protection Before Problems
Compliance and risk classification identifies potential legal, regulatory, and reputational issues before they become problems. These five types are critical for regulated industries and brand-conscious businesses.
Look, I’m about to walk through five compliance types, and they’re going to start blending together because they’re all variations on “does this site meet X legal requirement?” Try to stay with me.
14. Regulatory Compliance Classification
Compliance classification hits 86-93% accuracy for detecting compliance indicators. The AI can identify GDPR notices, HIPAA privacy policies, PCI-DSS security measures, and other regulatory framework elements. What it can’t do is verify genuine compliance, only the presence of compliance signals.
You need 5,000+ examples per regulatory framework for training. Response times are moderate at 1-2 seconds for multi-framework checks. Integration requires a regulatory knowledge base that maps requirements to detectable signals.
Explainability is excellent. You get specific compliance indicators or gaps identified (missing privacy policy, incomplete cookie consent, absent security disclosures). That specificity enables remediation and risk assessment.
Multi-language support is moderate because regulations vary by jurisdiction. GDPR applies across the EU but implementation details differ by country. What constitutes adequate privacy disclosure in Germany might not meet French standards.
If you’re implementing compliance classification, start by figuring out which regulations actually apply to you. Most companies assume they need GDPR compliance (if you have any EU customers, you probably do), but then they discover state-level regulations like CCPA in California or industry-specific stuff like HIPAA for healthcare.
Make a list. Then for each regulation, identify what signals the AI can actually detect (privacy policies, cookie consent banners, data processing agreements). You’re not verifying true compliance (that requires lawyers), just detecting whether the signals are present.
Budget for about 5,000 labeled examples per regulatory framework. Yes, that’s a lot. No, there’s no shortcut unless you’re only checking one or two regulations.
15. Brand Safety and Suitability Scoring
Brand safety classification hits 89-95% accuracy for clear violations. Hate speech, graphic violence, explicit content, obvious misinformation. These are relatively straightforward to detect.
Nuanced content drops to 76-84% accuracy because context matters enormously. What counts as “unsafe”? Explicit content, sure. Violence, obviously. But what about a news article about violence? What about an article criticizing violence? What about dark humor?
You need extensive, continuously updated datasets with 20,000+ examples. The threat landscape evolves constantly. New forms of problematic content emerge. Cultural standards shift. Your training data needs continuous refreshment to maintain accuracy.
Response times are good at 500-900 milliseconds. Integration is simple because brand safety classification is widely adopted in advertising technology. Most ad platforms offer pre-built integrations.

Explainability is strong. You get violation categories and severity scores, so you can set risk thresholds appropriate for your brand. Some brands accept moderate risk for reach. Others require zero tolerance.
Multi-language support is good and improving rapidly. Brand safety concerns (hate speech, violence, misinformation) exist across languages, though cultural definitions of problematic content vary. The need for continuously updated training datasets becomes even more critical when you consider that AI classification models learn from labeled examples to identify patterns, and as the threat landscape evolves with new forms of problematic content, static training data quickly becomes obsolete.
16. Data Privacy Practice Classification
Privacy practice assessment hits 82-89% accuracy. The AI analyzes cookie usage, tracking technologies, data collection practices, and privacy policy quality. Privacy practices can be technically hidden, which limits detection accuracy.
You need 6,000+ examples with privacy expert labeling for training. That expert labeling requirement is significant because privacy practices involve legal interpretation, not just technical detection.
Response times are moderate at 1-3 seconds for comprehensive privacy audits. Integration is complex because you need cookie scanning tools, tracking detection capabilities, and policy analysis systems working together.
Explainability is excellent. You get detailed privacy practice reports (specific cookies identified, tracking technologies detected, policy completeness assessed). That detail enables privacy compliance evaluation and vendor risk assessment.
Multi-language support is moderate. Privacy terminology varies by region. What constitutes adequate disclosure in California might not meet European standards. Privacy expectations differ culturally.
17. Legal Risk and Liability Classification
Legal risk classification sits at 79-86% accuracy. Copyright violations, trademark infringement, defamation risk, terms of service concerns. These require legal interpretation that AI handles imperfectly.
You need legal expert labeling for training data, with at least 8,000 examples. That expert requirement is expensive and time-consuming.
Response times are poor at 2-5 seconds due to the complexity of legal analysis. Integration is complex because you need legal database connections (trademark registries, copyright databases, case law references). Scalability is expensive due to specialized analysis requirements and data costs.
Explainability is good. The AI identifies potential issues, but human legal review remains necessary. You can’t rely on AI classification alone for legal decisions. That’s how companies end up in regulatory hot water.
Multi-language support is limited. Legal standards vary significantly by jurisdiction. What constitutes copyright infringement in the US differs from EU standards. Defamation law varies dramatically across countries.
18. Misinformation and Credibility Scoring
Misinformation detection sits at 77-84% accuracy. The AI cross-references claims with fact-checking databases and evaluates credibility signals, but factual accuracy is inherently difficult to verify at scale.
You need extensive fact-checked datasets with 15,000+ examples for training. That’s probably overkill if you’re just detecting obvious violations (explicit false claims). Might not be enough if you’re trying to catch nuanced stuff (misleading statistics, cherry-picked data).
Response times are poor at 3-6 seconds because the system queries external fact-checking APIs and credibility databases. Integration is complex. You need fact-checking API connections, credibility signal databases, and claim extraction capabilities. Scalability is expensive due to computational requirements and third-party data costs.
Explainability is moderate. The AI can flag suspicious claims, but the reasoning can be unclear. Why is this source credible? What makes this claim questionable? The answers aren’t always transparent.
Multi-language support is limited. Fact-checking resources are concentrated in major languages (English, Spanish, French, German). Less common languages have minimal fact-checking infrastructure.
A Pew Research study from May 2025 analyzing 2.5 million webpage visits found that only 8% of respondents visited news webpages that discussed AI in a meaningful context, while 52% encountered pages with only incidental AI mentions. This finding underscores the challenge for misinformation detection systems. Most AI-related content online is superficial rather than substantive, making it difficult for credibility scoring algorithms to distinguish between well-researched analysis and passing references that may contain inaccuracies.
Business Intelligence Classification: Where Strategy Meets Execution
Business intelligence classification is where this actually gets strategic. This is the stuff that tells you who to partner with, which leads to chase, and where your competitors are vulnerable.
These five types directly inform competitive strategy, lead prioritization, and growth opportunities.
19. Competitive Intelligence Classification
Competitive intelligence classification hits 83-90% accuracy. The AI identifies competitor websites, market positioning, competitive advantages, and strategic focus areas by analyzing messaging, product offerings, and market signals.
Accuracy depends heavily on market definition clarity. Narrowly defined markets (project management software for construction) yield higher accuracy than broad markets (business software). You need industry-specific training with 5,000+ examples per vertical.
Response times are moderate at 1-2 seconds. Integration benefits from CRM and market intelligence platform connections.
Explainability is strong. The AI identifies competitive signals and positioning indicators (shared keywords, overlapping product features, similar target audiences). That specificity helps you understand not just who your competitors are, but how they’re positioning against you. Companies implementing competitive response strategies find that competitive intelligence classification enables faster identification of market threats and positioning shifts.
Multi-language support is good. Competitive signals transcend language. Product features, pricing strategies, and market positioning translate across markets.
I worked with a SaaS analytics company that used competitive intelligence classification to monitor 500 competitors monthly. By narrowly defining their market as “product analytics for mobile apps,” they achieved 91% accuracy in identifying new competitors entering the space. The system flagged a previously unknown startup three months before it launched publicly, giving them time to adjust their positioning and feature roadmap to maintain differentiation.
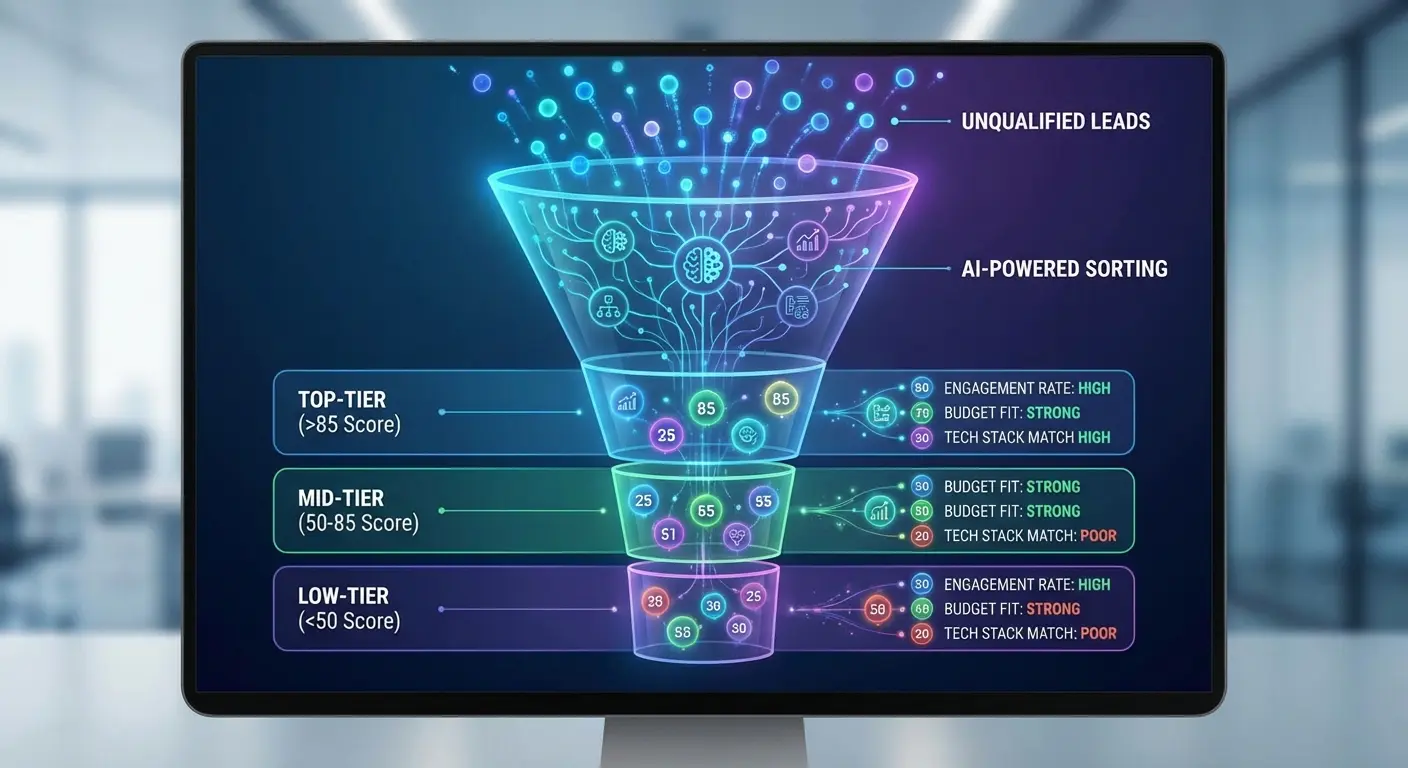
20. Lead Quality and Sales Readiness Scoring
Lead quality scoring. This is where classification gets directly strategic.
Lead quality scoring hits 81-88% accuracy. The AI evaluates company size indicators, technology sophistication, growth signals, and buying intent to prioritize prospects. Predictive accuracy improves significantly when you train on historical conversion data.
You need 10,000+ examples with conversion outcomes for training. That outcome data is critical. You’re not just classifying characteristics, you’re predicting conversion probability.
Response times are moderate at 1-3 seconds for comprehensive scoring. Integration is complex because you need CRM connections and data enrichment sources (firmographic data like employee count and revenue, technographic data about what tools they use, intent signals).
Scalability is moderate cost. Enrichment data can be expensive at scale, but the ROI from improved lead prioritization typically justifies the investment.
Explainability is excellent. You get scoring breakdowns across multiple dimensions (company size, technology stack, growth indicators, intent signals). That transparency helps sales teams understand why prospects are prioritized and adjust their approach accordingly.
Multi-language support is good. Business signals (employee count, funding rounds, technology adoption) are relatively universal, though some cultural adaptation is needed for buying intent signals.
Lead scoring models typically weight signals something like this:
Company size (employee count, revenue) carries the most weight, usually 25-30% of the total score. This data comes from firmographic databases like Clearbit or ZoomInfo, gets refreshed quarterly, and is pretty reliable because company size doesn’t change much. High impact on accuracy.
Technology stack is next at 20-25%. We pull this from technology detection APIs, refresh monthly, and it’s also high-impact because the tools a company uses tell you a lot about their sophistication and needs.
Growth indicators (funding rounds, hiring sprees) sit around 15-20%. This comes from news feeds and job boards, needs weekly updates, and has medium impact. It signals buying capacity but can be noisy. Not every hiring spree means they’re ready to buy your product.
Website engagement (time on site, pages viewed, return visits) is 15-20% of the model. Real-time data from analytics platforms. Medium impact because high engagement might mean genuine interest or might mean someone got lost in your documentation.
Intent signals (searches, content consumption) get 10-15%. Daily updates from intent data providers. Variable impact because intent data can be really noisy. Someone searching “project management software” might be researching for a purchase or writing a blog post about it.
Historical conversion patterns round it out at 10-15%, but this is actually the highest-impact signal when you have enough data. Companies similar to your past customers are more likely to convert. This is continuous learning from your CRM.
21. Market Trend and Emerging Pattern Detection
Trend detection sits at 74-82% accuracy. The AI identifies emerging trends, new market entrants, and shifting consumer patterns by analyzing website content evolution, feature adoption, and messaging changes across industries.
Accuracy is inherently lower because you’re making predictions about the future based on current signals. Some trends emerge. Others fizzle. Some patterns indicate real shifts. Others are noise.
You need continuous learning from 20,000+ sites with temporal tracking. This isn’t a one-time training exercise. You’re building time-series models that track evolution over time.
Response times are poor. Trend detection requires batch processing and historical comparison, taking minutes to hours rather than milliseconds. This isn’t a real-time classification type.
Integration is complex. You need data warehousing and time-series analysis capabilities to track changes over time. Scalability is expensive due to computational requirements for pattern detection across large datasets.
Explainability is moderate. The AI can identify trend indicators (increasing adoption of specific features, shifting messaging patterns, emerging terminology), but causation is unclear. Why is this trend emerging? That requires human interpretation.
Multi-language support is moderate. Trends emerge differently across markets and languages. What’s trending in US SaaS might not reflect European or Asian markets.
22. Partnership and Collaboration Opportunity Identification
Partnership opportunity classification hits 78-85% accuracy. The AI identifies complementary services, shared audiences, integration opportunities, and co-marketing fit by analyzing business models, target markets, and strategic positioning.
Partnership fit is inherently subjective and multi-dimensional. What makes a good partner? That depends on your strategic objectives, which the AI can’t fully understand without extensive context.
You need 8,000+ examples with successful partnership outcomes for training. That outcome data is challenging to collect because partnership success plays out over months or years, not days.
Response times are moderate at 2-4 seconds for multi-factor analysis. Integration is complex because you benefit from business graph databases and relationship mapping capabilities.
Scalability is moderate cost for focused partnership discovery. You’re not classifying millions of sites. You’re identifying dozens of high-potential partners from thousands of candidates.
Explainability is strong. The AI identifies specific alignment factors (complementary product offerings, overlapping target audiences, compatible business models) and opportunity areas (integration possibilities, co-marketing potential, referral partnerships).
Multi-language support is good. Business complementarity transcends language barriers. Two companies serving the same market with complementary offerings represent partnership potential regardless of their primary language.
23. Customer Journey Stage Classification
Journey stage classification hits 85-91% accuracy. The AI maps websites to awareness, consideration, decision, and retention stages by analyzing content depth, product information detail, pricing transparency, and support resources.
Clear journey stage indicators improve accuracy significantly. A site with extensive educational content, minimal product details, and no pricing clearly targets awareness stage. A site with detailed product comparisons, transparent pricing, and trial CTAs clearly targets decision stage.
You need 7,000+ examples across journey stages and industries for training. Journey stage focus varies by industry. B2B SaaS companies invest heavily in awareness content while eCommerce sites focus on decision stage.
Response times are good at 800-1200 milliseconds. Integration is moderate complexity and benefits from marketing automation platform connections that enable journey-based personalization.
Scalability is good for up to 1M classifications monthly. Explainability is excellent. The AI maps content to specific journey stages with confidence scores, so you can see exactly what signals drove the classification.
Multi-language support is good. Journey stage concepts apply across markets with minor adaptation. Awareness content looks similar globally, though the specific topics and formats vary culturally.
How to Choose Classification Types That Matter for Your Business
You’ve just absorbed 23 classification types with varying accuracy rates, cost structures, and integration requirements. Now what?
Start with the decisions you need to make, not the data you could collect. Which classifications would directly change your strategy? Which would influence budget allocation? Which would shift how you prioritize opportunities?
Most businesses need three to five classification types maximum. More than that and you’re collecting data that won’t influence decisions. Your dashboard looks impressive, but your strategy remains unchanged.
If your main goal is lead generation, start with lead quality scoring (#20), industry classification (#1), and technology stack detection (#11). Maybe add conversion architecture (#9) if you’re also optimizing your own site.
If your main goal is content strategy, you want topic taxonomy (#2), intent classification (#7), and journey stage mapping (#23). Competitive intelligence (#19) helps if you’re tracking competitor content.
If your main goal is compliance, you need regulatory compliance (#14), brand safety (#15), and probably data privacy (#16). These aren’t optional if you’re in healthcare, finance, or advertising.
If you’re not sure what your main goal is, stop. Figure that out first. Don’t implement classification types until you know what decisions they’re supposed to improve.

The classification types you don’t need matter as much as the ones you do. Traffic pattern classification (#12) looks valuable but delivers low accuracy at high cost. Legal risk classification (#17) seems important but requires human review anyway. Misinformation detection (#18) is emerging but not yet reliable enough for automated decisions.
Consider your accuracy requirements carefully. Can you tolerate 80% accuracy if the cost is low and the decisions are reversible? Or do you need 95% accuracy because false positives create significant problems? That tradeoff drives which classification types make sense for your business.
Think about your integration capabilities. Simple REST API integrations (format detection, technology stack identification) are easy wins. Complex integrations requiring multiple data sources (traffic patterns, lead quality scoring) need technical resources and ongoing maintenance.
Evaluate your scale requirements. Processing 1,000 sites monthly? Almost any classification type works economically. Processing 1M sites monthly? Cost structure and scalability become critical selection factors.
Don’t ignore explainability. You need to understand why the AI made each classification decision, not just trust the output. Classification types with strong explainability (technology stack identification, content format detection, UX classification) enable validation and continuous improvement. Types with weak explainability (sentiment analysis, legal risk classification) require more human oversight.
Mistakes I see constantly:
Implementing too many types at once. Start with three. Prove they work. Then expand.
Choosing types that sound impressive instead of types that answer specific questions. Misinformation detection sounds important. But if you’re a B2B SaaS company, when would you actually use it?
Trusting accuracy numbers from vendors. Those are based on clean benchmark data. Your real-world accuracy will be 5-10% lower.
Not budgeting for ongoing retraining. Models drift. You need to retrain quarterly with new data or accuracy degrades. I’ve seen models lose 15% accuracy over a year without updates.
Building dashboards instead of workflows. Classifications should trigger actions (route this lead to sales, flag this competitor for analysis), not just populate reports.
Skipping the explainability requirement. If you can’t understand why the AI made a decision, you can’t validate it or improve it.
Most businesses struggle with AI website classification because they’re solving the wrong problem. They’re asking “what can we classify?” instead of “what decisions would better classification enable?”
I’ve worked with dozens of companies that bought classification tools before defining the business questions those classifications should answer. The result? Expensive dashboards full of data that never influences a single strategic decision.
At The Marketing Agency, we start with your business objectives and work backward to the classification types that matter. We don’t implement AI because it’s trendy. We implement classification systems that drive specific business actions: lead prioritization, competitive positioning, content strategy, partnership evaluation.
Our approach integrates AI classification into your existing marketing systems. Every classification flows directly into your CRM, content management system, or analytics platform. Every data point ties to a specific business decision. We build systems where AI-powered classification creates compound advantages across your entire marketing operation. Whether you need to identify high-value prospects, monitor competitive threats, ensure compliance, or optimize your content strategy, we engineer classification systems that turn website analysis into competitive advantage.
Our approach combines classification with advanced analytics for strategic growth, ensuring that every data point contributes to measurable business outcomes.
As you build your classification strategy, remember that effective AI data classification depends on access to complete, continuously updated data instead of limited snapshots or outdated files. The more context your systems can capture across product pages, reviews, or transaction records, the more accurately they can identify patterns and apply the right labels. Ongoing data quality and model retraining are essential investments, not optional upgrades.
Ready to transform AI classification from data collection into strategic intelligence? We can discuss which classification types would drive decisions for your business and build systems that deliver measurable results.
Okay, Wrapping This Up
If you’re still reading, you’ve absorbed way too much information about AI classification. Sorry about that.
Look, I’ve written 6,000+ words about AI classification types, which probably makes you think this is complicated. It’s not. The hard part isn’t the AI. It’s figuring out what decisions you’re actually trying to make.
Most companies fail at AI classification because they collect data they don’t use. They build dashboards nobody looks at. They classify everything and decide nothing.
Here’s the only thing that really matters: don’t collect data you won’t use.
Figure out one specific decision you need to make better. Not “improve lead quality” (too vague). Something like “decide which 100 inbound leads out of 1,000 monthly deserve immediate sales attention.” Or “identify the 20 competitors out of 500 in our space who are most directly threatening our market position.”
One specific decision. Then find the 2-3 classification types that provide the information needed to make that decision better. Implement those. Use them for three months. Measure whether they actually changed anything.
If your sales close rate improves, or your content team identifies gaps they wouldn’t have found otherwise, or your partnerships team discovers opportunities they were missing, great. Add another classification type.
If nothing changes, you either picked the wrong classification types or classification isn’t the solution to your problem. Both are fine. Better to learn that after implementing three types than after implementing all 23.
A mid-sized B2B software company started with just three classification types: industry vertical classification for lead routing, technology stack identification for competitive intelligence, and lead quality scoring for sales prioritization. Within six months, their sales team’s close rate improved by 34% because they were pursuing better-qualified leads. They resisted the temptation to add more classification types, instead investing in improving the accuracy of their existing three through continuous retraining with conversion outcome data. Two years later, those same three classification types still drive 80% of their strategic decisions.
The companies winning with AI classification in 2026 aren’t the ones with 23 different classification types running. They’re the ones with three types that actually change how they work.
I’ve been doing this long enough to know which patterns work and which ones are expensive data collection exercises that look good in presentations but don’t change behavior. If you want help figuring out which 3-5 classification types would actually move the needle for your specific situation, not just create impressive dashboards, email me.
Or don’t. The information in this post should be enough to get you started if you want to tackle this yourself. Just start small, measure ruthlessly, and don’t implement classification types because they sound cool.
As you scale your classification capabilities, consider how they fit within broader scalable campaign development frameworks that leverage AI insights across multiple marketing channels.
Good luck.
