


Look, I’ll be straight with you – about 73% of businesses using Matomo are actively looking for something better, and honestly? I get it. I spent way too many weekends last year wrestling with Matomo’s server setup for a client’s e-commerce site, only to have it crash during Black Friday. That’s when I decided to really dig into what else is out there.
After messing around with pretty much every analytics tool I could get my hands on over the past year, I figured I’d save you the headache and put together this breakdown of what actually works.
Table of Contents
-
TL;DR: Quick Comparison Guide
-
Comparison Table
-
Criteria Breakdown Summary
-
Google Analytics 4 (GA4)
-
Plausible Analytics
-
Adobe Analytics
-
Mixpanel
-
Hotjar
-
Fathom Analytics
-
Clicky
-
PostHog
-
Amplitude
-
Umami
-
Notable Mentions
-
FAQ
-
Final Thoughts
TL;DR: Quick Comparison Guide
Honestly, you probably don’t have time to read through everything, so here’s the rapid-fire version of what I’ve learned testing these platforms:
Google Analytics 4 is still the 800-pound gorilla – free and powerful, but man, the interface makes me miss Universal Analytics every single day. If you can deal with the learning curve, it’s hard to beat for the price (zero).
Plausible Analytics is what I recommend to friends who just want something that works without the privacy headaches. No cookies, no consent banners, no BS. Perfect if you’re tired of legal teams breathing down your neck about GDPR compliance.
Adobe Analytics is basically the Ferrari of analytics – incredible capabilities if you’ve got deep pockets and a team that knows what they’re doing. We’re talking $150K+ per year, so yeah, enterprise only.
Mixpanel clicks for SaaS companies that need to track actual user behavior, not just page views. I’ve seen it help startups figure out exactly where users drop off in their onboarding flow.
Hotjar is like having a security camera for your website. Watching session recordings can be addictive (in a productive way), and heatmaps actually show you where people are clicking vs. where you think they’re clicking.
Fathom Analytics sits in that sweet spot between “too simple” and “too complicated.” It’s what I use for my own site because I want more than basic stats but don’t need to become a data scientist.
Clicky has been around forever and shows you what’s happening right now on your site. Great if you’re the type who needs to see real-time results from campaigns or social media posts.
PostHog tries to be everything – analytics, A/B testing, feature flags. It’s pretty ambitious, and the open-source angle is legit. Technical teams seem to love it.
Amplitude is where product managers go when they need serious behavioral analytics. Expensive but powerful – think of it as the Adobe Analytics for product teams.
Umami is the scrappy open-source option that just works. Clean, simple, and you can host it yourself if you’re into that sort of thing.
Comparison Table
|
Platform |
Ease of Setup |
Privacy/Compliance |
Integration |
Reporting Depth |
Cost |
Best For |
|---|---|---|---|---|---|---|
|
Google Analytics 4 |
3/5 |
2/5 |
5/5 |
5/5 |
5/5 |
Comprehensive free analytics |
|
Plausible Analytics |
5/5 |
5/5 |
3/5 |
2/5 |
4/5 |
Privacy-first simplicity |
|
Adobe Analytics |
2/5 |
4/5 |
4/5 |
5/5 |
1/5 |
Enterprise organizations |
|
Mixpanel |
3/5 |
4/5 |
4/5 |
5/5 |
3/5 |
Product analytics |
|
Hotjar |
5/5 |
4/5 |
3/5 |
3/5 |
4/5 |
Qualitative insights |
|
Fathom Analytics |
5/5 |
5/5 |
3/5 |
3/5 |
3/5 |
Balanced features |
|
Clicky |
4/5 |
3/5 |
3/5 |
4/5 |
4/5 |
Real-time tracking |
|
PostHog |
4/5 |
5/5 |
4/5 |
5/5 |
4/5 |
All-in-one platform |
|
Amplitude |
3/5 |
4/5 |
4/5 |
5/5 |
2/5 |
Advanced behavioral analytics |
|
Umami |
4/5 |
5/5 |
3/5 |
2/5 |
5/5 |
Simple open-source |
Criteria Breakdown Summary
Here’s the thing – picking an analytics platform isn’t just about features. I’ve learned this the hard way after watching clients struggle with tools that looked perfect on paper but were nightmares in practice.
Setup complexity matters more than you think. I’ve seen teams spend months trying to get enterprise platforms configured properly, while simple tools like Plausible literally take five minutes to implement. Time is money, especially for smaller teams.
Privacy compliance isn’t optional anymore. Ever since iOS 14.5 basically nuked Facebook’s tracking and GDPR started actually getting enforced, privacy-first analytics have been having a moment. Some tools handle this automatically, others require you to become a compliance expert.
Integration capabilities can make or break your workflow. If your analytics tool doesn’t play nice with your CRM, email platform, or whatever else you’re using, you’ll end up with data scattered everywhere.
The reporting depth vs. clarity balance is tricky. Too simple and you’re flying blind. Too complex and your team ignores the data entirely. I’ve watched marketing teams give up on powerful tools because nobody could figure out how to create a basic report.
Total cost includes way more than the monthly fee. Factor in setup time, training, maintenance, and the opportunity cost of choosing wrong. That “free” tool might cost you thousands in lost productivity.
Google Analytics 4 (GA4)
GA4 is still the elephant in the room – it’s free, it’s powerful, and it integrates with everything. But honestly? I still miss Universal Analytics. Google basically rebuilt everything from scratch, and while GA4 is technically more advanced, it feels like they changed things just to be different.
Best Known for Comprehensive Free Analytics
Look, GA4 dominates for a reason. When you need enterprise-level features without enterprise pricing, it’s pretty much your only option. The machine learning stuff is actually useful once you figure out how to interpret it, and the cross-platform tracking finally makes sense of how users bounce between your website and mobile app.
But here’s what nobody tells you – the interface is genuinely frustrating if you’re used to Universal Analytics. I spent hours trying to find simple reports that used to take two clicks.
Features
The automatic event tracking is pretty slick – it captures downloads, outbound clicks, video plays, and scroll depth without you having to set up a bunch of custom events. Though honestly, it sometimes tracks stuff you don’t care about and misses things you do.
The exploration reports are where GA4 really shines, but they’re also where it gets overwhelming. Funnel analysis, cohort reports, path exploration – it’s all there, but you need to know what you’re looking for. I’ve seen marketing teams get lost in these reports for hours without finding actionable insights.
BigQuery integration is free now, which is huge if you’ve got technical chops. Being able to export all your raw data and run custom queries is incredibly powerful, though most small businesses won’t need it.
Pros
Can’t argue with free, especially when you get this much functionality. The Google ecosystem integration is seamless – if you’re running Google Ads, Search Console, or Tag Manager, everything just works together.
The predictive metrics are actually useful. Seeing which users are likely to churn or make a purchase helps with targeting, though the predictions aren’t always spot-on.
Data processing can handle massive traffic without breaking a sweat. I’ve never seen GA4 struggle with high-volume sites the way some other tools do.
Cons
The learning curve is brutal. I’m not exaggerating when I say it took me months to feel comfortable navigating GA4 after years with Universal Analytics. Your team will need training, period.
Privacy settings require careful configuration. Out of the box, GA4 isn’t automatically GDPR compliant, despite what some people think. You’ll need to adjust data retention settings and probably add a consent banner.
Some reports still feel incomplete compared to what Universal Analytics offered. The real-time reporting is better, but historical data analysis sometimes feels limited.
Criteria Evaluation
Ease of Setup: 3/5 – Installation is simple, but proper configuration takes time and knowledge
Privacy/Compliance: 2/5 – Requires manual setup for compliance, data goes through Google
Integration: 5/5 – Connects with everything, especially Google’s ecosystem
Reporting Depth: 5/5 – Incredibly comprehensive once you learn how to use it
Cost: 5/5 – Hard to beat free
Community Reviews and Expert Recommendations
The marketing community is split on GA4. Data analysts love the advanced capabilities, but day-to-day marketers often find it frustrating. I see a lot of “I wish Universal Analytics was still available” posts in marketing forums.
Enterprise users generally adapt better because they have dedicated analytics teams. Small businesses struggle more with the complexity.
Source: Aggregated from marketing forums, Reddit discussions, and professional analytics communities
Pricing
Completely free for most businesses. GA4 360 (enterprise version) starts around $150K annually, but honestly, if you need 360 features, you probably already know it.
Check out Google Analytics 4 at analytics.google.com
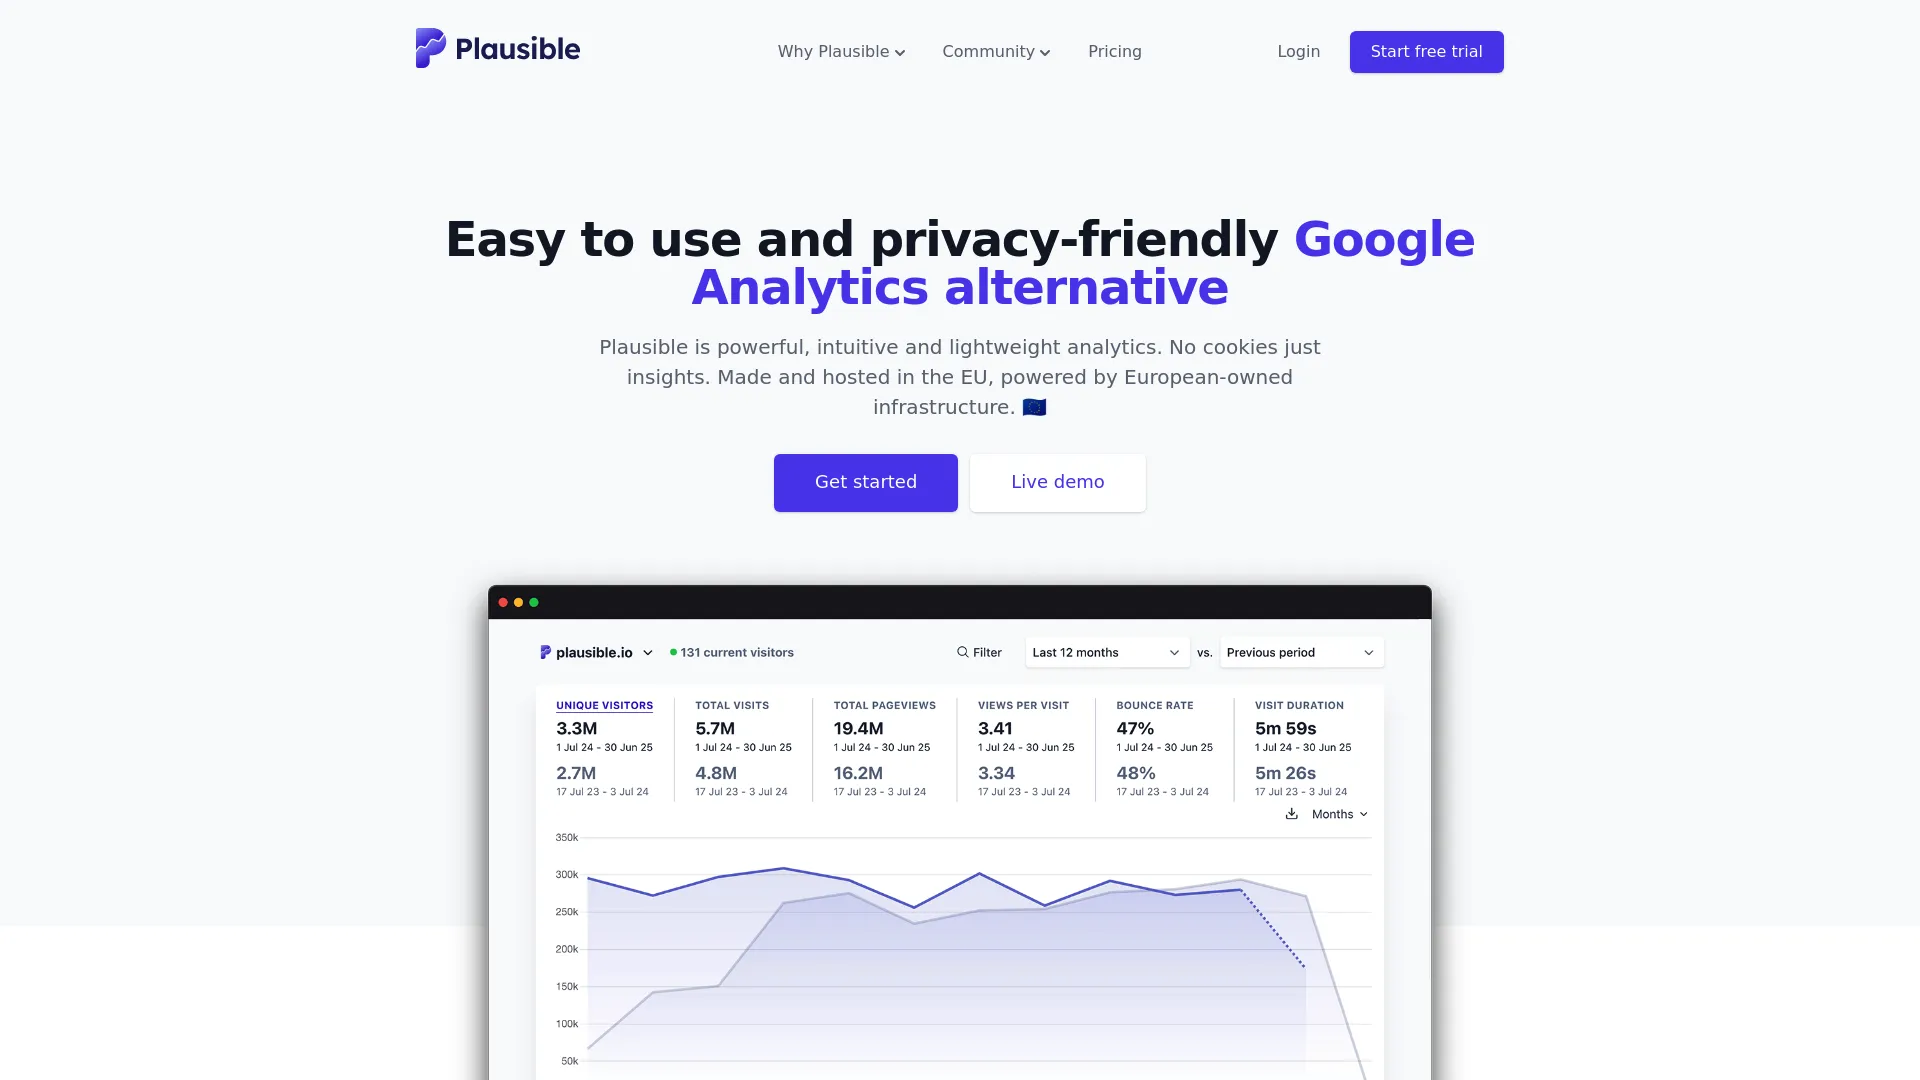
Plausible Analytics
This is what I recommend when people ask for “Google Analytics but without the privacy headaches.” Plausible does one thing really well – it gives you the essential metrics you actually need without any of the compliance drama.
Best Known for Privacy-First Simplicity
Plausible basically said “what if analytics didn’t suck?” and built something that actually delivers on that promise. No cookies, no personal data collection, no consent banners – just clean, useful data that won’t get you in trouble with privacy laws.
The script is ridiculously lightweight too. We’re talking 45 times smaller than GA4, which actually makes your site faster instead of slower. Your users won’t even notice it’s there.
Features
Everything you see fits on one screen, which is either a feature or a limitation depending on what you need. Page views, unique visitors, bounce rate, top sources – the basics are all there and clearly presented.
Goal tracking works exactly like you’d expect. Set up a conversion goal, and Plausible tracks it. No complex funnels or attribution modeling, just straightforward conversion tracking.
The public stats feature is neat if you want to share your traffic data transparently. Some companies use this for investor updates or just to show they’re growing.
Pros
Privacy compliance is automatic. You literally don’t have to think about GDPR, CCPA, or any other privacy regulations. Plausible handles it by design.
The dashboard is intuitive enough that anyone on your team can understand it immediately. No training required, no complex reports to decode.
Performance impact is negligible. In fact, since the script is so lightweight, it might actually improve your site speed compared to heavier analytics tools.
Cons
Limited features compared to comprehensive platforms. If you need detailed user flow analysis or advanced segmentation, Plausible won’t cut it.
The simplicity that makes it great also makes it restrictive. Power users often outgrow it quickly.
Smaller ecosystem means fewer integrations and third-party tools. You’re mostly on your own for connecting it with other systems.
Criteria Evaluation
Ease of Setup: 5/5 – Literally copy and paste one line of code
Privacy/Compliance: 5/5 – Compliant by design, no configuration needed
Integration: 3/5 – Basic options available, but limited ecosystem
Reporting Depth: 2/5 – Essential metrics only, no advanced analysis Cost: 4/5 – Reasonable pricing that scales predictably
Community Reviews and Expert Recommendations
Privacy advocates love Plausible, obviously. Small business owners appreciate not having to become compliance experts just to track their website traffic.
The developer community respects the open-source approach and clean implementation. However, growth marketers and data analysts often find it too limiting for serious optimization work.
Source: Privacy-focused tech communities, small business forums, and developer discussions
Pricing
Starts at $9/month for up to 10K page views. Pricing scales with traffic, which is transparent and predictable.
Try Plausible Analytics at plausible.io
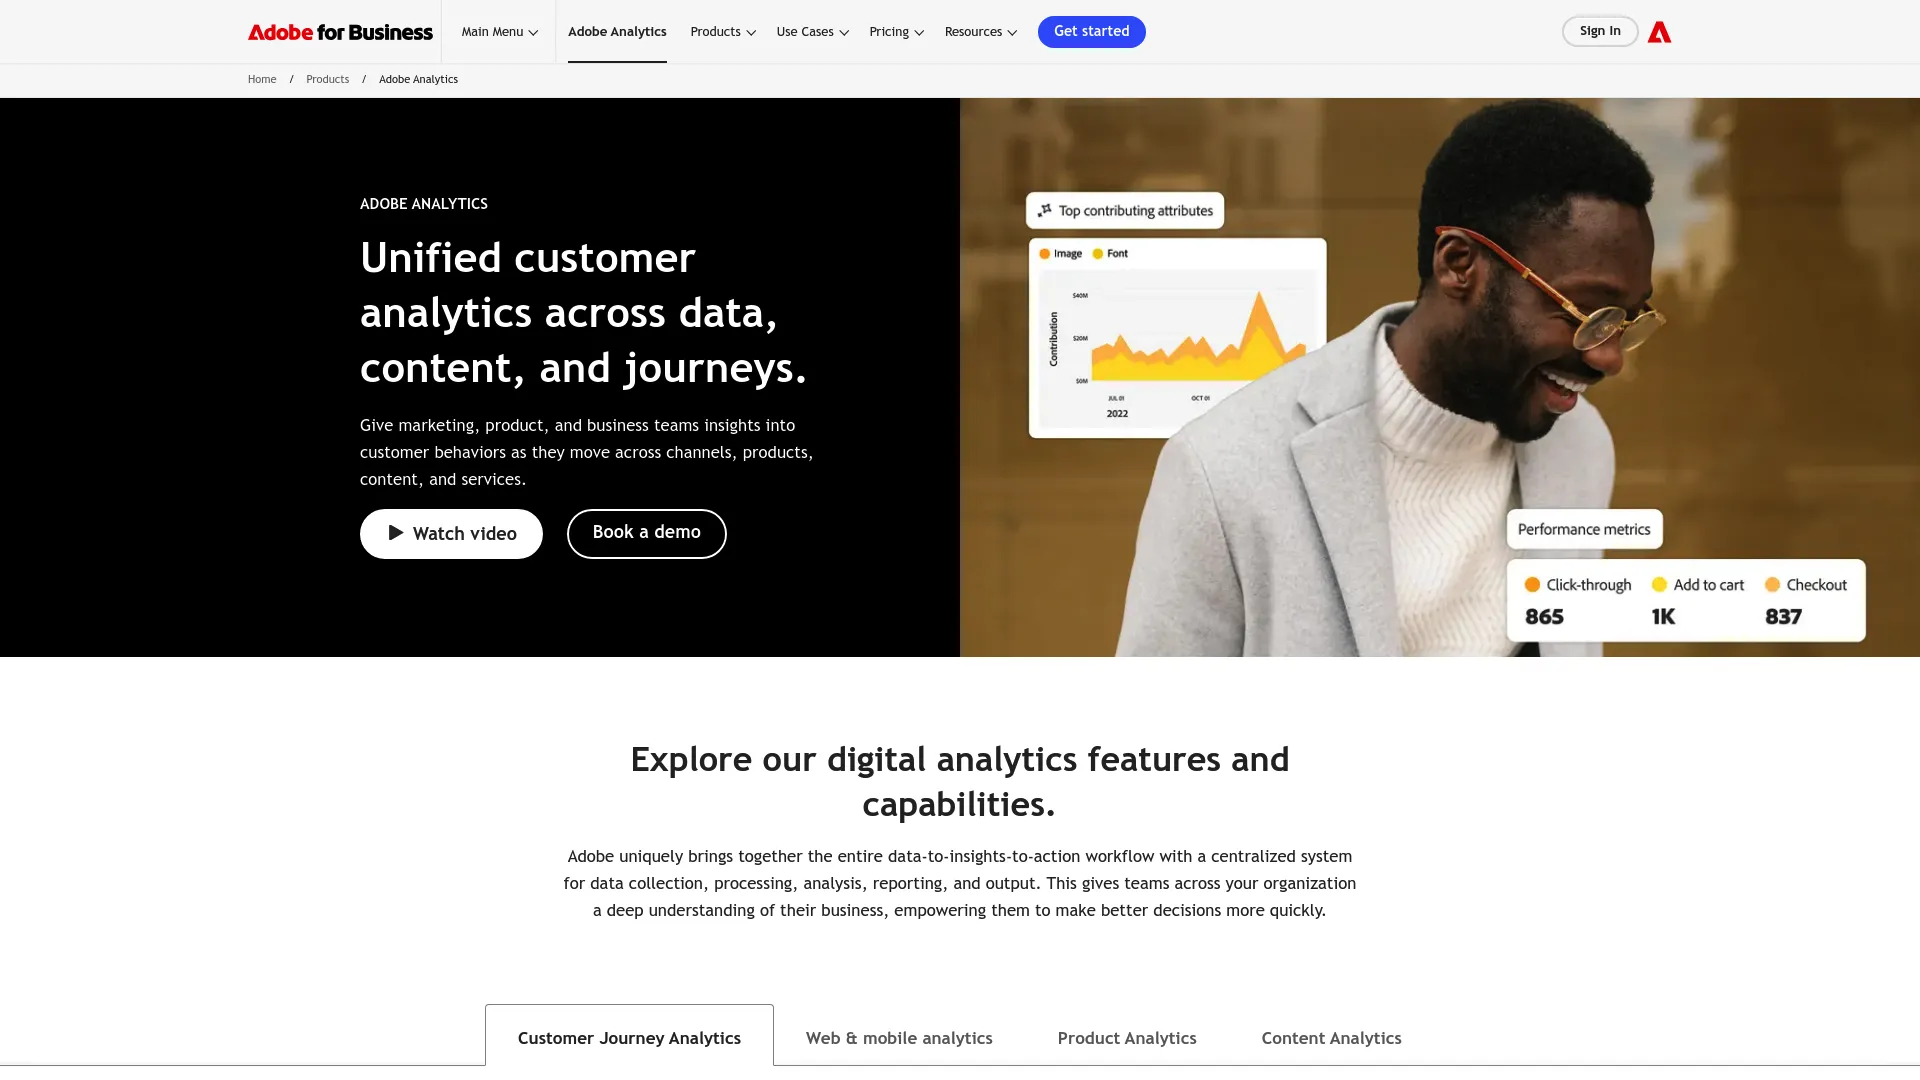
Adobe Analytics
Adobe Analytics is basically the Rolls Royce of analytics – incredibly powerful, beautifully engineered, and priced accordingly. If you’re a Fortune 500 company with a dedicated analytics team and a serious budget, this is probably where you’ll end up.
Best Known for Enterprise-Grade Analytical Power
Adobe Analytics doesn’t mess around. This is what enterprises use when they need to track complex customer journeys across dozens of touchpoints and actually understand what’s driving revenue.
The attribution modeling alone justifies the cost for big companies. Being able to see how email, social, paid ads, and organic search work together to drive conversions is incredibly valuable when you’re spending millions on marketing.
Features
The calculated metrics and custom dimensions let you track basically anything you can imagine. Want to measure customer lifetime value across different acquisition channels? Adobe can do that. Need to track how product recommendations affect purchase behavior? Yep, that too.
Real-time segmentation processes massive amounts of data instantly. I’ve seen implementations handling millions of events per day without breaking a sweat.
The workspace collaboration tools are actually useful for large teams. Multiple analysts can work on the same reports and share insights without stepping on each other.
Pros
Unmatched depth for complex analysis. If you need to understand sophisticated customer journeys and multi-touch attribution, nothing else comes close.
Predictive analytics that actually work. The machine learning models can forecast customer behavior with impressive accuracy when you have enough data.
Integration with Adobe’s marketing cloud creates a comprehensive ecosystem. If you’re already using Adobe’s other tools, the synergy is powerful.
Cons
The cost is genuinely prohibitive for most businesses. We’re talking $150K+ annually before you even factor in implementation and training costs.
Implementation complexity is no joke. Plan on 3-6 months minimum for a proper rollout, assuming you have experienced consultants helping.
The learning curve is steep even for experienced analysts. Adobe Analytics has its own way of doing things, and it takes time to master.
Criteria Evaluation
Ease of Setup: 2/5 – Complex implementation requiring specialized expertise
Privacy/Compliance: 4/5 – Enterprise-grade privacy controls and compliance features
Integration: 4/5 – Extensive Adobe ecosystem plus enterprise integrations
Reporting Depth: 5/5 – Unmatched analytical capabilities
Cost: 1/5 – Extremely expensive with high implementation costs
Community Reviews and Expert Recommendations
Enterprise analytics folks swear by Adobe Analytics – it’s basically the gold standard if you can afford it. I’ve heard implementation consultants say it’s the most powerful platform they’ve worked with, but they also warn that most companies underestimate the resources needed to use it properly.
The learning curve stories are legendary. One guy in an analytics forum said his team took over a year to feel truly comfortable with all the features.
Source: Enterprise analytics forums, Adobe user groups, and digital marketing conferences
Pricing
Custom pricing only – if you have to ask, you probably can’t afford it. Expect six figures annually plus implementation costs.
Contact Adobe Analytics at business.adobe.com
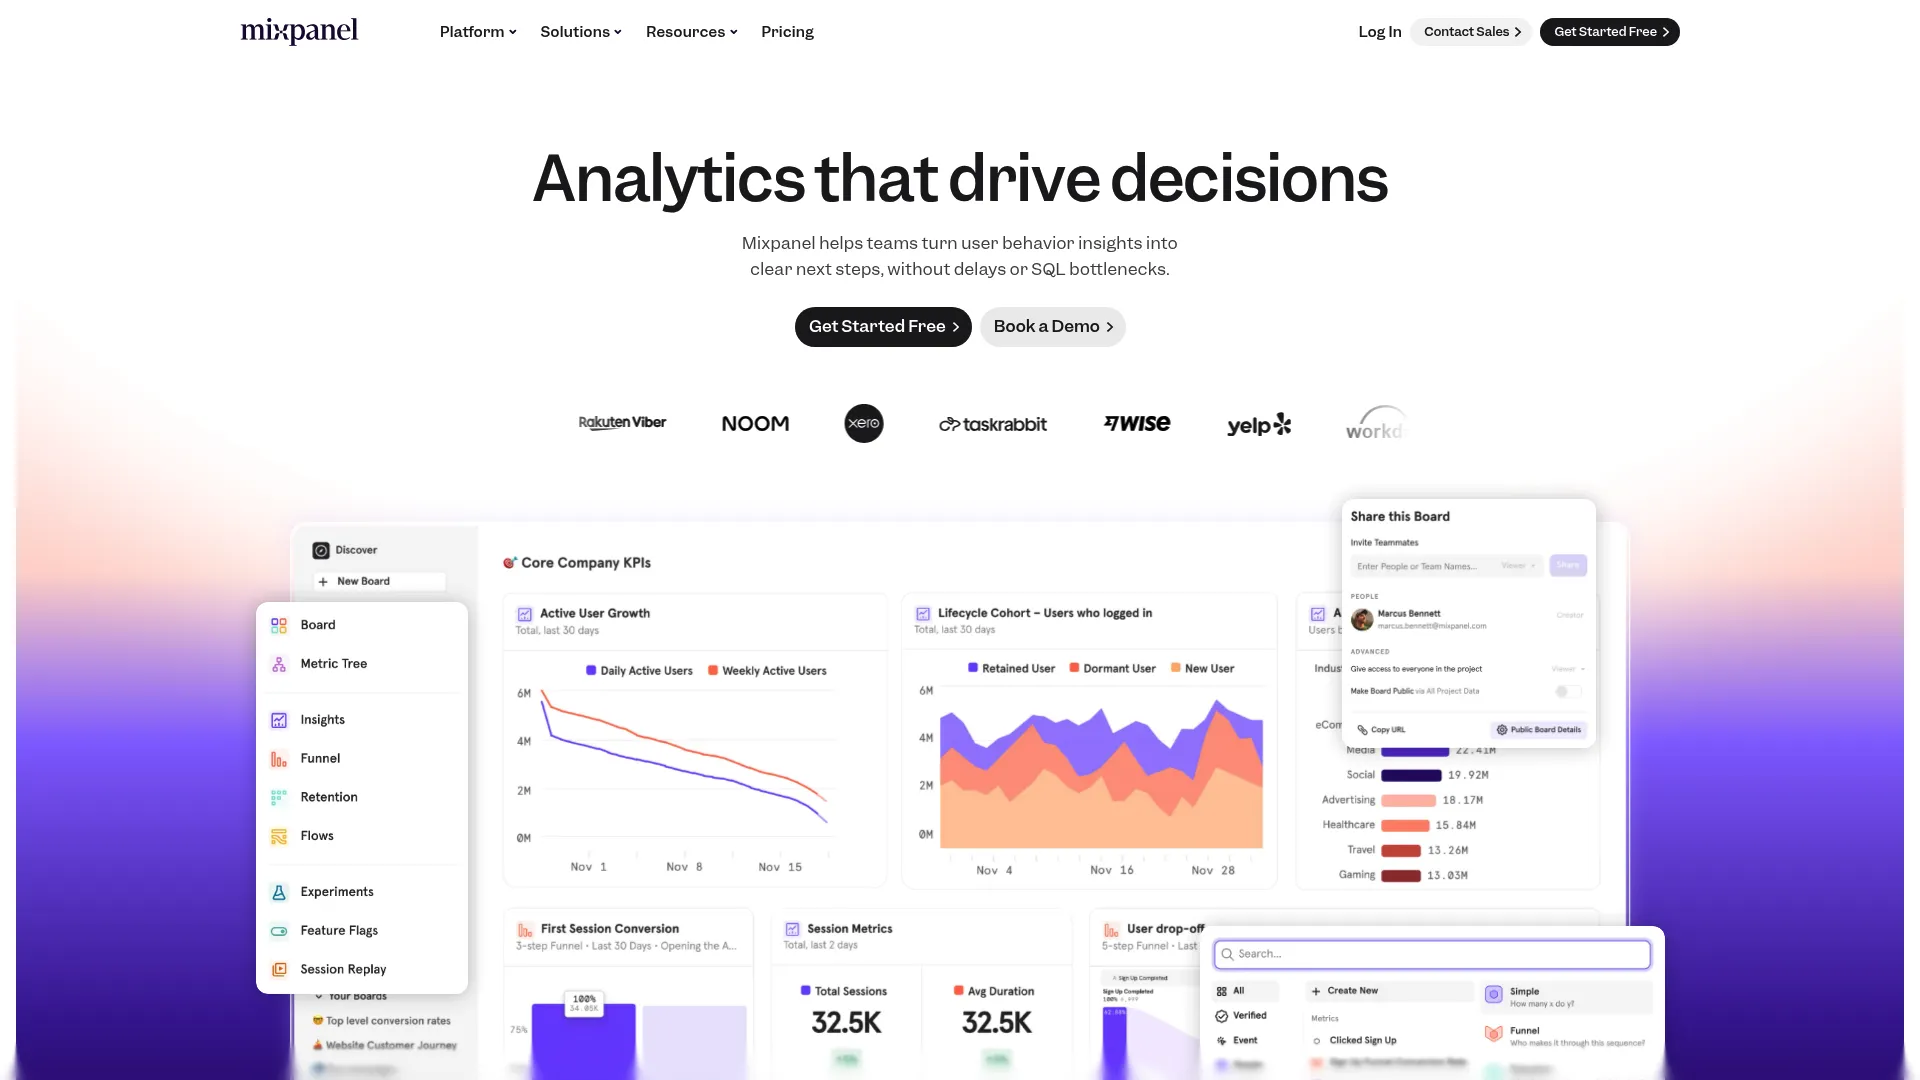
Mixpanel
Mixpanel changed the game by focusing on what users actually do instead of just tracking page views. If you’re running a SaaS product or web app and need to understand user behavior, this is probably your best bet.
Best Known for Event-Based Product Analytics
Here’s the thing about Mixpanel – it tracks actions, not just visits. So instead of knowing someone visited your pricing page, you know they clicked the “upgrade” button, started the checkout flow, but bailed at the payment step. That’s actionable data.
I’ve seen SaaS companies use Mixpanel to identify exactly where users drop off in their onboarding and fix those specific friction points. It’s incredibly powerful when implemented correctly.
Features
Event tracking is where Mixpanel shines. You can track literally any user action – button clicks, form submissions, feature usage, whatever matters for your product. The funnel analysis then shows you exactly where people drop off.
Cohort analysis is genuinely useful for understanding retention. You can see how user behavior changes over time and identify which acquisition channels bring the highest-quality users.
A/B testing is built right in, so you can test changes and see the impact on your key metrics immediately. No need to juggle multiple tools.
Pros
Product analytics capabilities blow traditional web analytics out of the water. If you need to understand how people use your product (not just your website), Mixpanel delivers.
The retention analysis helps you understand customer lifetime value and identify churn risks before they become problems.
Free tier is generous enough to get real value before you need to upgrade. Most startups can run on the free plan for months.
Cons
Setup requires more planning than traditional analytics. You need to think carefully about which events to track and how to structure your data.
Costs can explode quickly if you’re not careful about event volume. I’ve seen bills jump from hundreds to thousands overnight when a product goes viral.
Traditional website metrics aren’t Mixpanel’s strength. If you need standard web analytics alongside product analytics, you might need multiple tools.
Criteria Evaluation
Ease of Setup: 3/5 – Requires event planning but documentation is solid
Privacy/Compliance: 4/5 – Good privacy controls and compliance options
Integration: 4/5 – Strong ecosystem with most major tools
Reporting Depth: 5/5 – Excellent for product analytics and user behavior
Cost: 3/5 – Free tier available but can get expensive at scale
Community Reviews and Expert Recommendations
Product managers consistently rank Mixpanel as essential for understanding user behavior. The SaaS community particularly loves the retention analysis and funnel optimization features.
Growth teams appreciate being able to track the entire user journey from signup to conversion. However, traditional marketers sometimes find the product focus limiting for content marketing analysis.
Source: Product management communities, SaaS forums, and startup accelerator discussions
Pricing
Free for up to 20M events monthly. Paid plans start at $25/month with pricing based on event volume.
Explore Mixpanel at mixpanel.com
Hotjar
Hotjar shows you what’s actually happening on your website through session recordings and heatmaps. It’s like having a security camera for your site, and honestly, watching real users navigate your pages can be eye-opening (and sometimes painful).
Best Known for Visual User Behavior Insights
The first time you watch a session recording of someone struggling to find your contact form or getting confused by your navigation, it hits different than just seeing bounce rate numbers. Hotjar makes user experience problems immediately obvious.
Heatmaps are addictive in the best way – seeing where people actually click versus where you think they click often reveals surprising insights about user behavior.
Features
Session recordings capture real user interactions, showing exactly how visitors navigate your site. You can watch them scroll, click, hesitate, and sometimes rage-quit in real-time.
Click, move, and scroll heatmaps visualize user attention patterns. The data aggregates across multiple sessions to show you the overall picture of how people interact with each page.
Feedback polls and surveys let you ask users directly what they think. Sometimes the best insights come straight from asking “what’s confusing about this page?”
Pros
Qualitative insights you simply can’t get from traditional analytics. Numbers tell you what happened, but Hotjar shows you why.
Session recordings help identify specific usability problems that would be impossible to discover otherwise. I’ve seen teams fix conversion-killing issues within hours of watching user sessions.
Easy implementation – literally just add a script and start collecting data. No complex setup or configuration required.
Cons
Privacy considerations require careful consent management. Recording user sessions raises obvious privacy concerns that need to be handled properly.
Can get expensive for high-traffic sites since pricing is based on session volume. The costs can add up quickly if you’re not careful about what you’re recording.
Doesn’t provide comprehensive website metrics. You’ll still need traditional analytics for traffic sources, conversion attribution, and other standard metrics.
Criteria Evaluation
Ease of Setup: 5/5 – Simple script installation, immediate results
Privacy/Compliance: 4/5 – Good privacy controls but requires proper consent setup
Integration: 3/5 – Basic integrations with major platforms
Reporting Depth: 3/5 – Excellent qualitative insights, limited quantitative data
Cost: 4/5 – Free plan available, reasonable scaling
Community Reviews and Expert Recommendations
UX designers and conversion optimization specialists love Hotjar. E-commerce teams find session recordings invaluable for understanding checkout abandonment.
The consensus is that it’s essential for understanding user experience but needs to be paired with traditional analytics for complete insights.
Source: UX design communities, conversion optimization forums, and e-commerce marketing groups
Pricing
Free plan with basic features. Paid plans start at $32/month with increased recording limits.
Check out Hotjar at hotjar.com
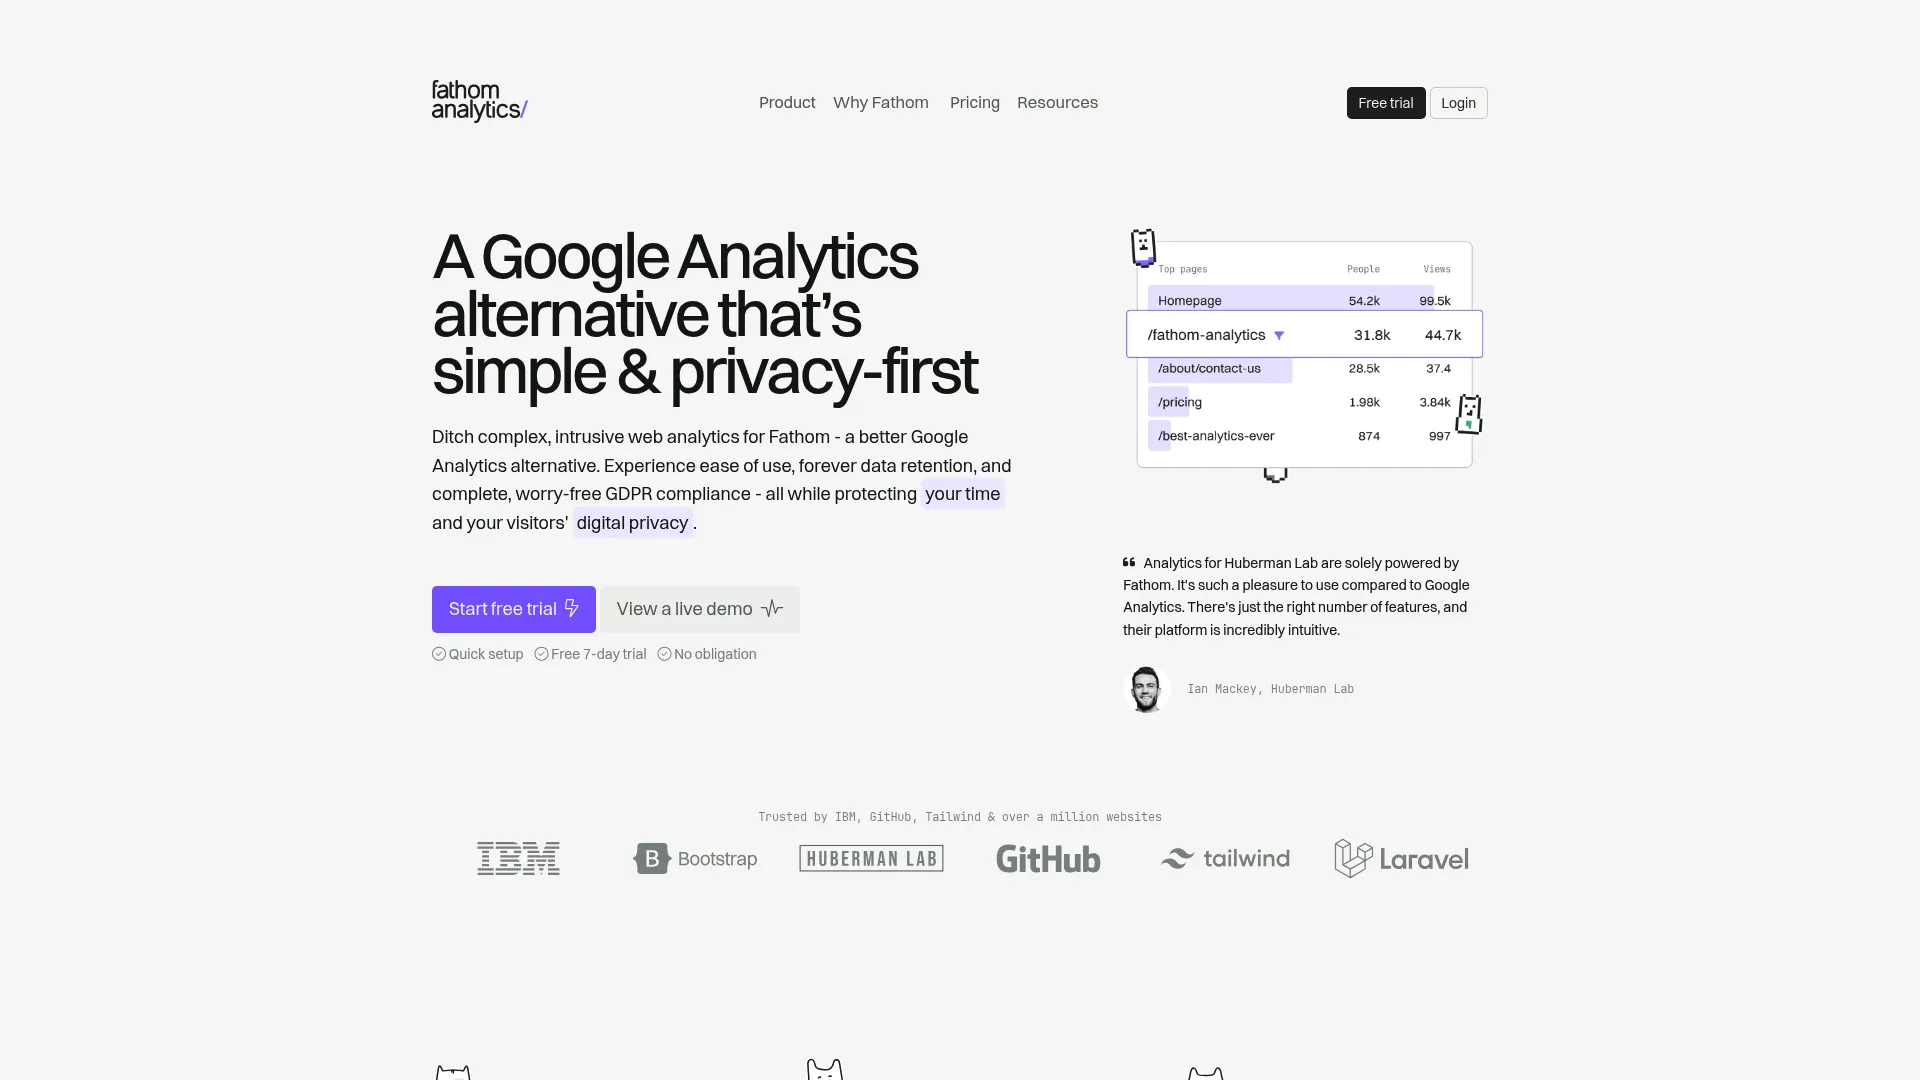
Fathom Analytics
Fathom sits in that sweet spot between Plausible’s simplicity and GA4’s complexity. It’s what I actually use for my own site because I want more than basic page views but don’t need to become a data scientist.
Best Known for Balanced Privacy Features
Fathom gives you goal tracking, email reports, and other useful features while maintaining the privacy-first approach that eliminates compliance headaches. It’s like Plausible’s more feature-rich cousin.
The interface strikes a nice balance – clean enough to understand at a glance but detailed enough to be actually useful for optimization decisions.
Features
Goal tracking is straightforward and works exactly like you’d expect. Set up conversion goals and track them without complex funnel configurations.
Automated email reports keep your team updated without having to remember to check the dashboard. You can customize the frequency and recipients.
Custom domains for tracking scripts help avoid ad blockers. This is actually more important than it sounds – ad blockers can mess with your data collection.
Pros
Privacy compliance is automatic, just like Plausible, but with more functionality. You get the best of both worlds.
The balanced feature set provides enough depth for most businesses without overwhelming complexity. It’s the Goldilocks of analytics – just right.
Fast performance doesn’t impact site speed. The script is lightweight and loads quickly.
Cons
Still limited compared to comprehensive analytics platforms. If you need advanced segmentation or detailed user flow analysis, you’ll outgrow it.
Smaller ecosystem means fewer integrations than major platforms. You’re somewhat limited in connecting it with other tools.
The middle-ground approach might not satisfy users who want either maximum simplicity or maximum power.
Criteria Evaluation
Ease of Setup: 5/5 – Simple installation with clear documentation
Privacy/Compliance: 5/5 – Privacy-first design with automatic compliance
Integration: 3/5 – Basic integrations available
Reporting Depth: 3/5 – More than basic tools, less than enterprise platforms
Cost: 3/5 – Mid-range pricing that reflects the feature balance
Community Reviews and Expert Recommendations
Small business owners appreciate the balance between features and simplicity. It’s popular among agencies who need something more robust than Plausible but less complex than GA4.
The privacy-conscious community likes having more features while maintaining ethical data practices.
Source: Small business marketing forums, privacy advocacy groups, and digital agency discussions
Pricing
Plans start at $14/month for up to 100K page views with transparent scaling.
Try Fathom Analytics at usefathom.com
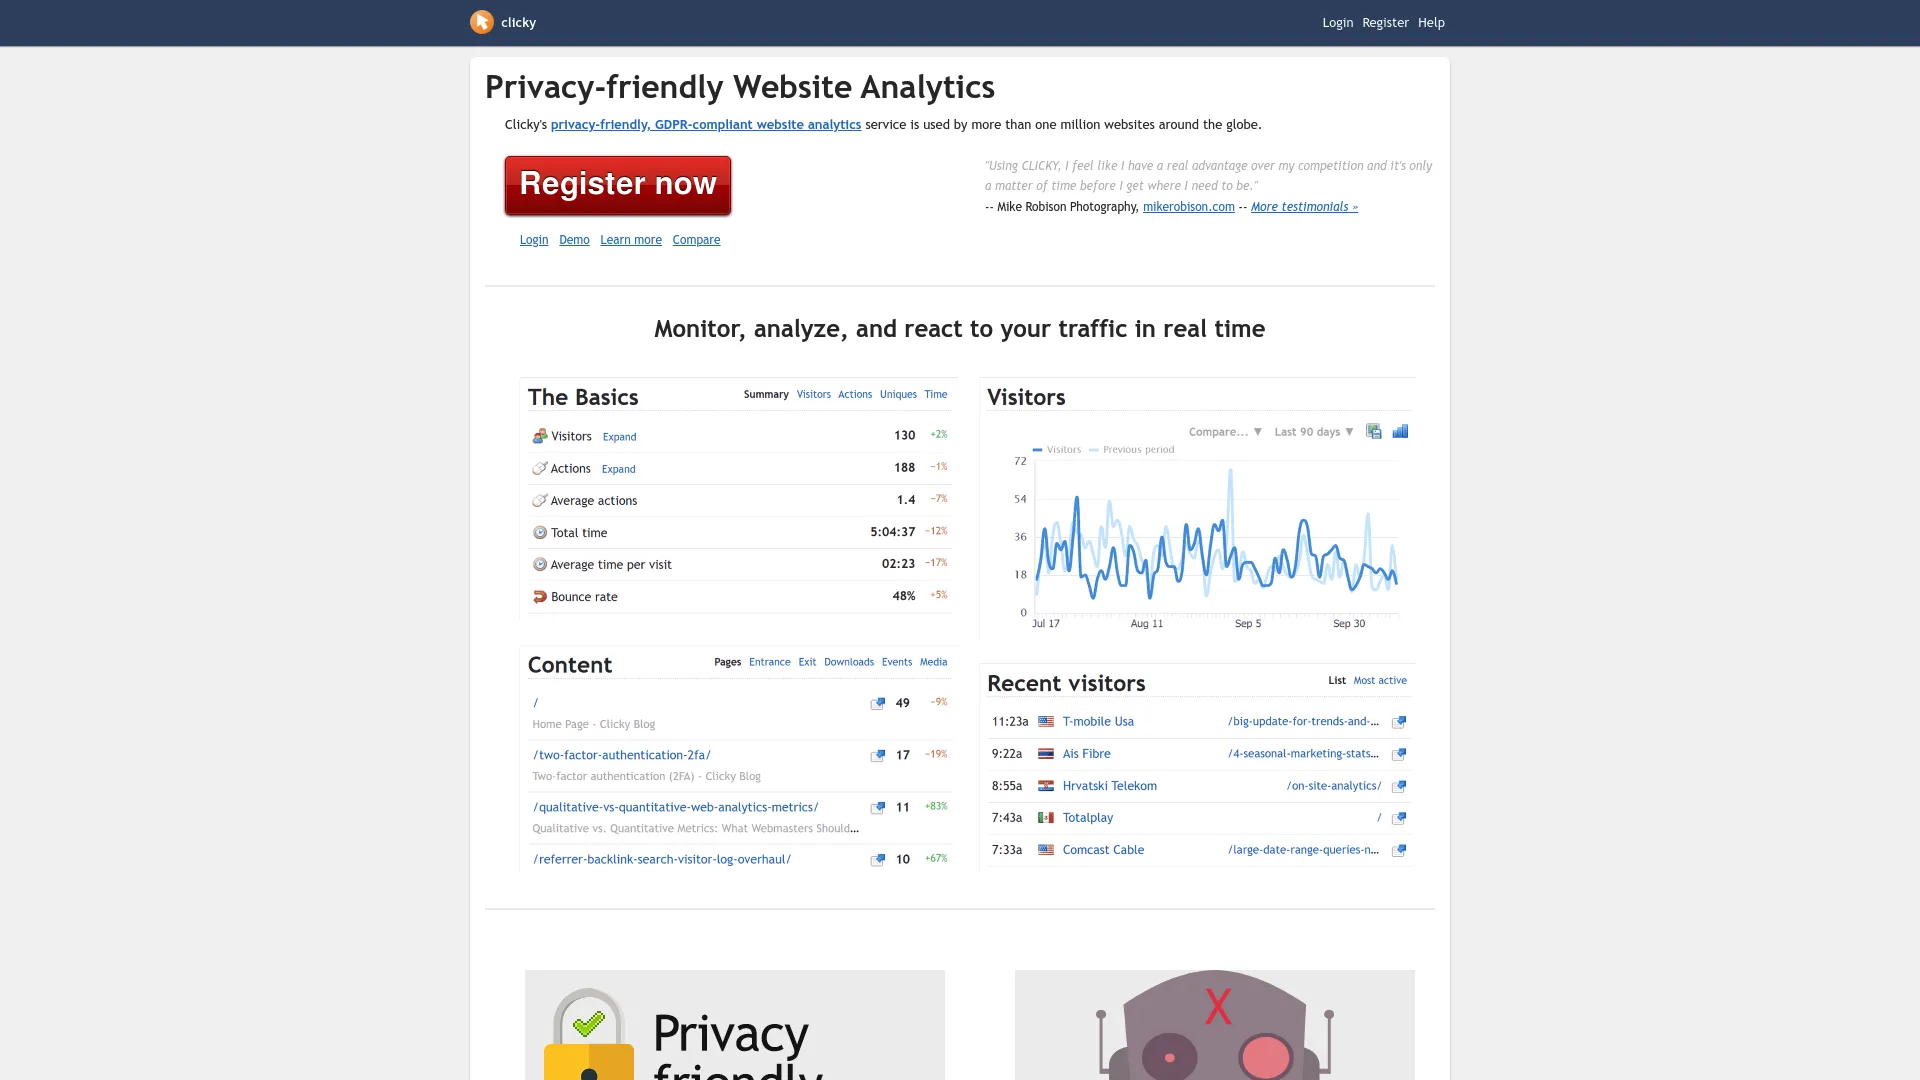
Clicky
Clicky has been around forever (in internet terms) and focuses on real-time analytics with detailed visitor tracking. If you need to see what’s happening on your site right now, Clicky delivers.
Best Known for Real-Time Visitor Tracking
The real-time capabilities are genuinely impressive. You can watch visitors navigate your site as it happens, which is incredibly useful for monitoring campaign launches or social media spikes.
Individual visitor tracking creates detailed behavioral profiles over time. It’s fascinating (and slightly creepy) to see how specific users interact with your site across multiple visits.
Features
Real-time analytics show current visitors and their actions as they happen. The “spy” feature lets you literally watch someone browse your site live.
Individual visitor tracking maintains detailed histories for each user. You can see their complete journey across multiple sessions.
Heatmaps visualize user interaction patterns, though they’re not as polished as Hotjar’s implementation.
Pros
Excellent real-time capabilities for immediate insights. Perfect for monitoring campaign performance or social media traffic spikes.
Detailed visitor-level information reveals individual user behavior patterns that aggregated data misses.
Affordable pricing makes advanced features accessible to smaller businesses. The free tier is actually usable.
Cons
The interface feels dated compared to modern analytics platforms. It works fine but doesn’t feel as polished as newer tools.
Individual tracking raises privacy concerns that require careful consideration, especially with GDPR and similar regulations.
Smaller community and ecosystem compared to major platforms. You’re more on your own for support and integrations.
Criteria Evaluation
Ease of Setup: 4/5 – Straightforward installation with decent documentation
Privacy/Compliance: 3/5 – Privacy options available but require configuration
Integration: 3/5 – Basic integrations, limited ecosystem
Reporting Depth: 4/5 – Detailed visitor data and comprehensive real-time info
Cost: 4/5 – Affordable with free option available
Community Reviews and Expert Recommendations
Digital marketers who need real-time monitoring appreciate Clicky’s immediate insights. Small businesses like the detailed visitor information at affordable prices.
The consensus is that it’s solid for specific use cases but not comprehensive enough for most businesses as a primary analytics solution.
Source: Digital marketing communities, small business forums, and real-time analytics discussions
Pricing
Free plan with basic features. Paid plans start at $9.99/month.
Visit Clicky at clicky.com
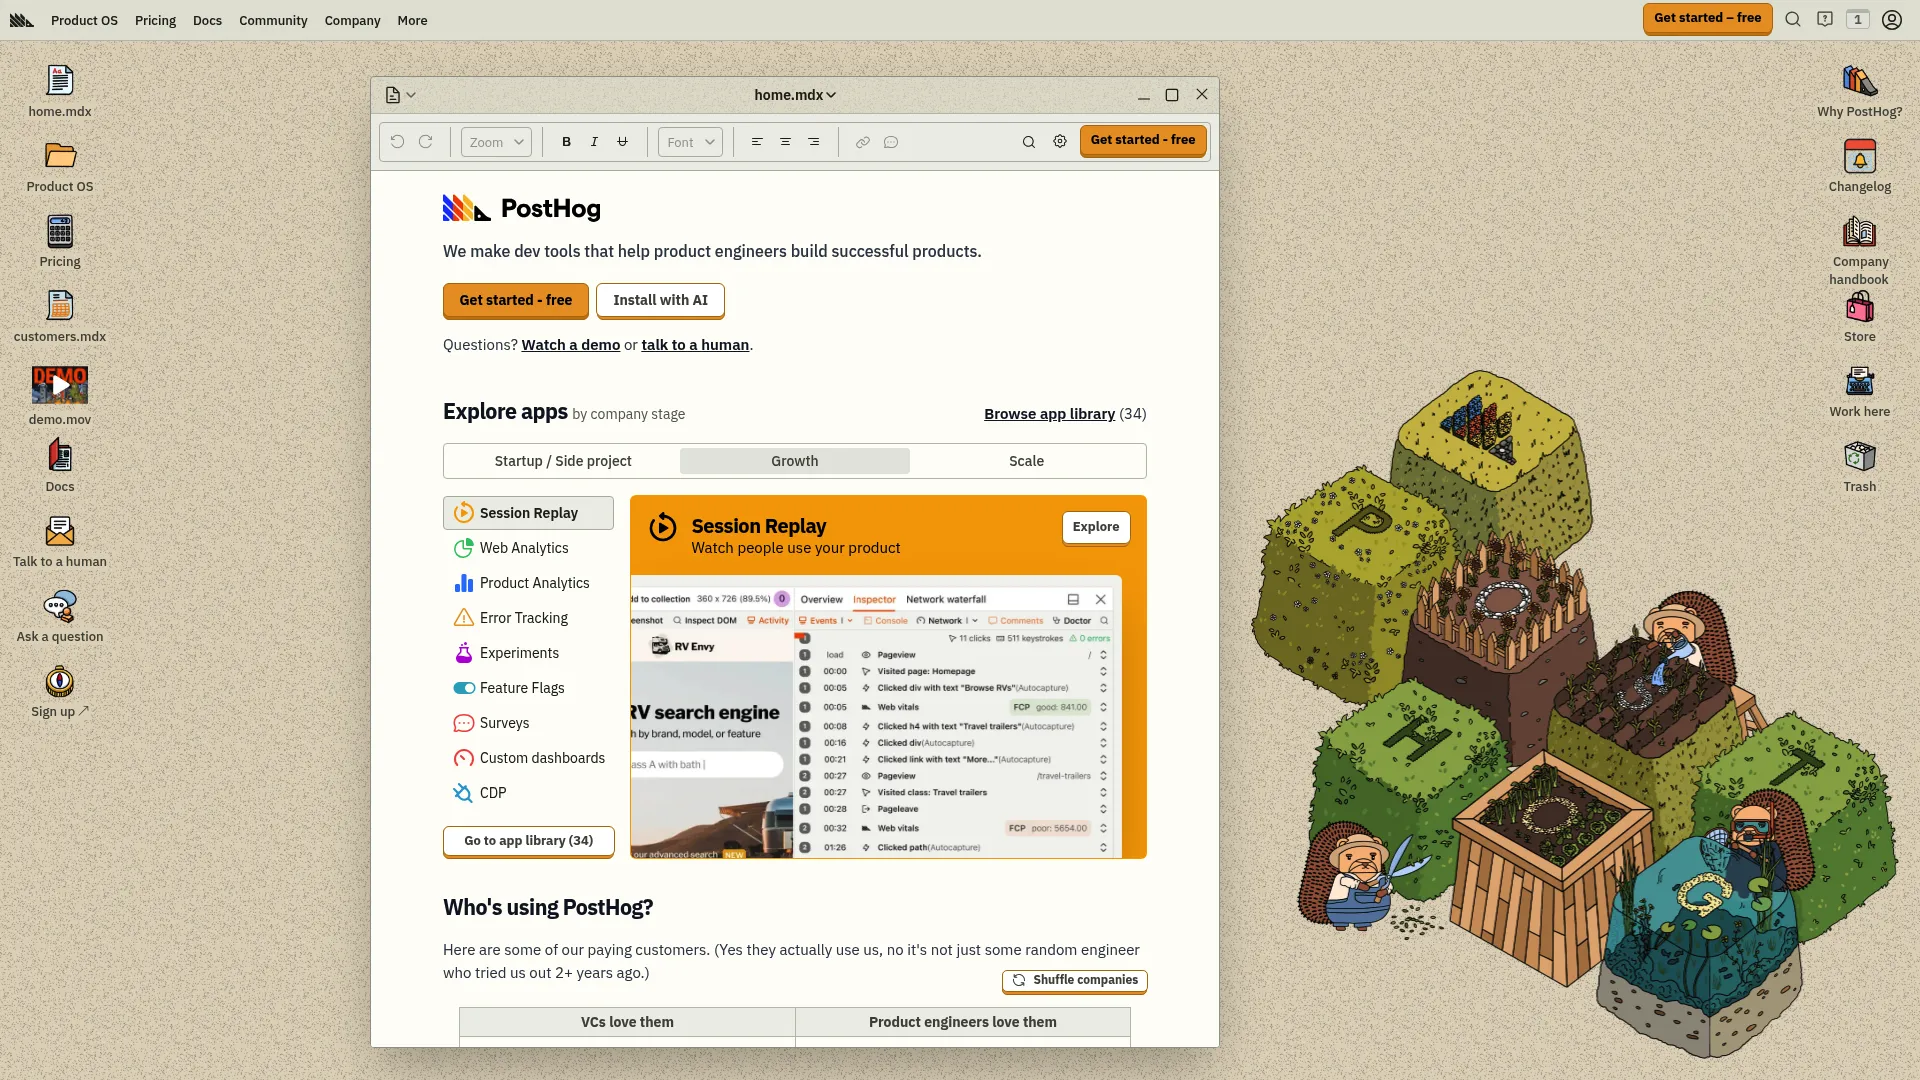
PostHog
PostHog is trying to be the Swiss Army knife of product analytics – analytics, A/B testing, feature flags, and user surveys all in one open-source platform. It’s ambitious, and the execution is pretty impressive.
Best Known for All-in-One Open Source Platform
The open-source approach means complete transparency about how your data is handled, which is refreshing in a world of black-box analytics tools. Plus, you can self-host if you want complete control.
Having analytics, experimentation, and feature management in one place eliminates the usual tool-switching headaches. Everything just works together naturally.
Features
Web and product analytics with automatic event capture eliminate manual setup headaches. The platform tracks user interactions without requiring extensive configuration.
A/B testing is built in with statistical significance calculations handled automatically. No need to become a statistician to run valid experiments.
Feature flags enable controlled rollouts and gradual feature releases. This is incredibly valuable for product teams managing complex deployments.
Pros
Replaces multiple tools with one integrated platform, reducing costs and complexity. The open-source nature builds trust and enables customization.
Generous free tier allows extensive testing before upgrading. Most small to medium businesses can run on the free plan.
Strong product analytics capabilities rival specialized platforms like Mixpanel. The technical focus appeals to engineering-driven teams.
Cons
Can overwhelm users who just need basic website analytics. The comprehensive feature set might be overkill for simple use cases.
Technical platform that assumes some level of development knowledge. Less technical team members might struggle with the interface.
Newer platform means some features are still evolving. You might encounter occasional rough edges or missing functionality.
Criteria Evaluation
Ease of Setup: 4/5 – Good documentation but technical platform requiring some expertise
Privacy/Compliance: 5/5 – Open source with EU data residency options
Integration: 4/5 – Good API and integration options
Reporting Depth: 5/5 – Comprehensive analytics and product features
Cost: 4/5 – Generous free tier with transparent usage-based pricing
Community Reviews and Expert Recommendations
Engineering teams love PostHog’s comprehensive feature set and open-source transparency. Product managers appreciate having analytics and experimentation tools integrated.
The developer community is enthusiastic about the open-source approach and active development. However, marketing teams sometimes find the technical focus challenging.
Source: Engineering communities, product management forums, and open-source software discussions
Pricing
Generous free tier covers most small business needs. Paid plans scale based on usage with transparent pricing.
Discover PostHog at posthog.com
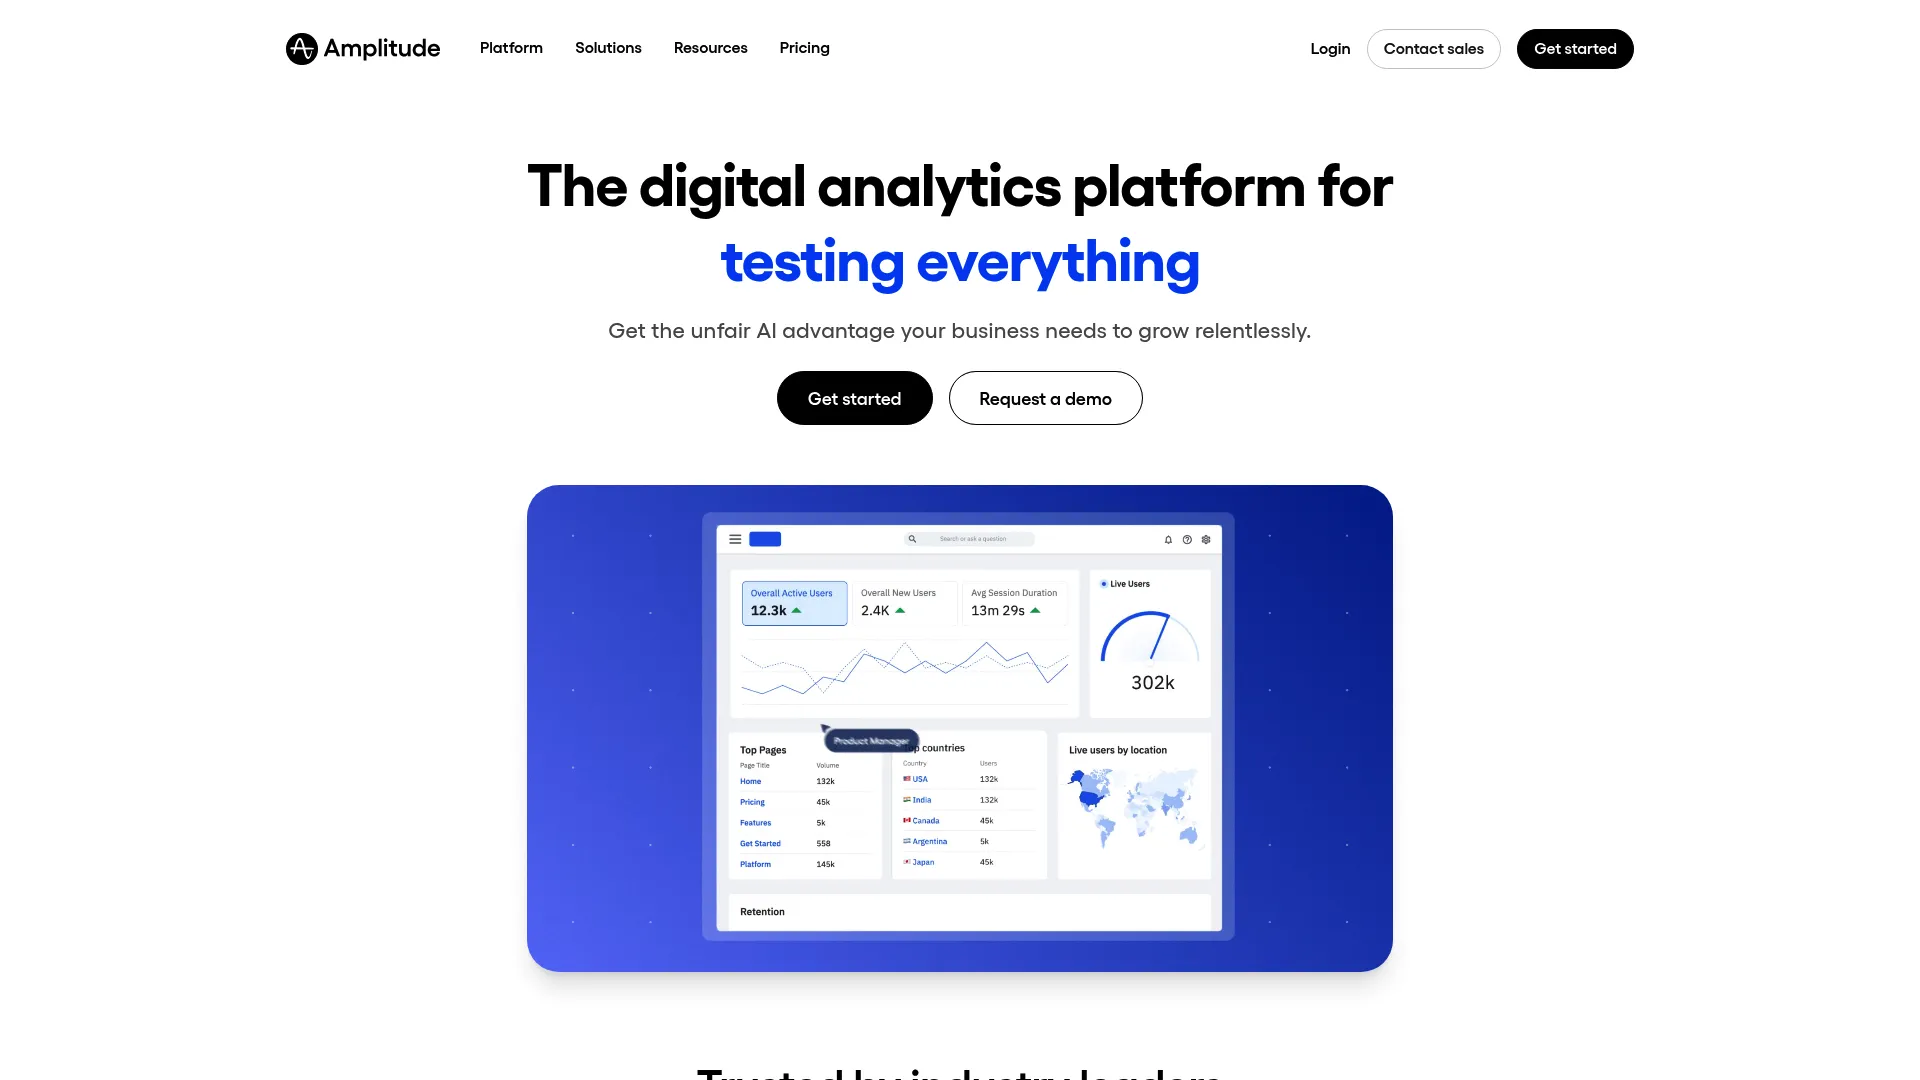
Amplitude
Amplitude is where product teams go when they need serious behavioral analytics. It’s expensive but incredibly powerful for understanding complex user journeys and predicting customer behavior.
Best Known for Advanced Behavioral Analytics
Amplitude pioneered product analytics for digital products, and they’re still the gold standard for understanding user behavior at scale. Companies like Ford, NBCUniversal, and Walmart use it to optimize their digital experiences.
The behavioral cohort analysis and customer journey mapping capabilities are unmatched. If you need to understand how different user segments behave over time, Amplitude delivers insights that other platforms miss.
Features
Comprehensive product analytics include advanced funnel and retention analysis with sophisticated behavioral segmentation. The platform handles complex user journey mapping across multiple touchpoints.
A/B testing integrates directly with analytics for seamless experimentation. You can test changes and measure impact on key metrics without switching tools.
AI-powered insights enable natural language queries for complex analysis. Ask questions in plain English and get meaningful answers from your data.
Pros
Powerful product analytics capabilities exceed most alternatives. The behavioral analysis reveals optimization opportunities that traditional web analytics miss.
Integrated experimentation platform eliminates tool switching. Everything you need for product optimization is in one place.
Enterprise-grade features support large-scale implementations. The platform scales effectively for high-volume applications.
Cons
Expensive at scale with complex pricing tiers. Costs can escalate quickly as your usage grows.
Setup complexity requires technical expertise and careful planning. Implementation timelines can stretch significantly for complex requirements.
Product analytics focus may not suit traditional website analytics needs. If you need standard web metrics, you might need additional tools.
Criteria Evaluation
Ease of Setup: 3/5 – Requires event configuration and technical knowledge
Privacy/Compliance: 4/5 – Enterprise-grade privacy and compliance features
Integration: 4/5 – Extensive integration ecosystem
Reporting Depth: 5/5 – Advanced product analytics and behavioral insights
Cost: 2/5 – Can become very expensive at enterprise scale
Community Reviews and Expert Recommendations
Product analytics professionals consider Amplitude the industry standard. Enterprise product teams praise the comprehensive feature set and scalability.
The consensus is that it’s incredibly powerful but requires significant investment in both money and expertise to use effectively.
Source: Product analytics communities, enterprise software forums, and growth marketing discussions
Pricing
Free tier with basic features. Enterprise pricing is custom and typically expensive.
Learn about Amplitude at amplitude.com
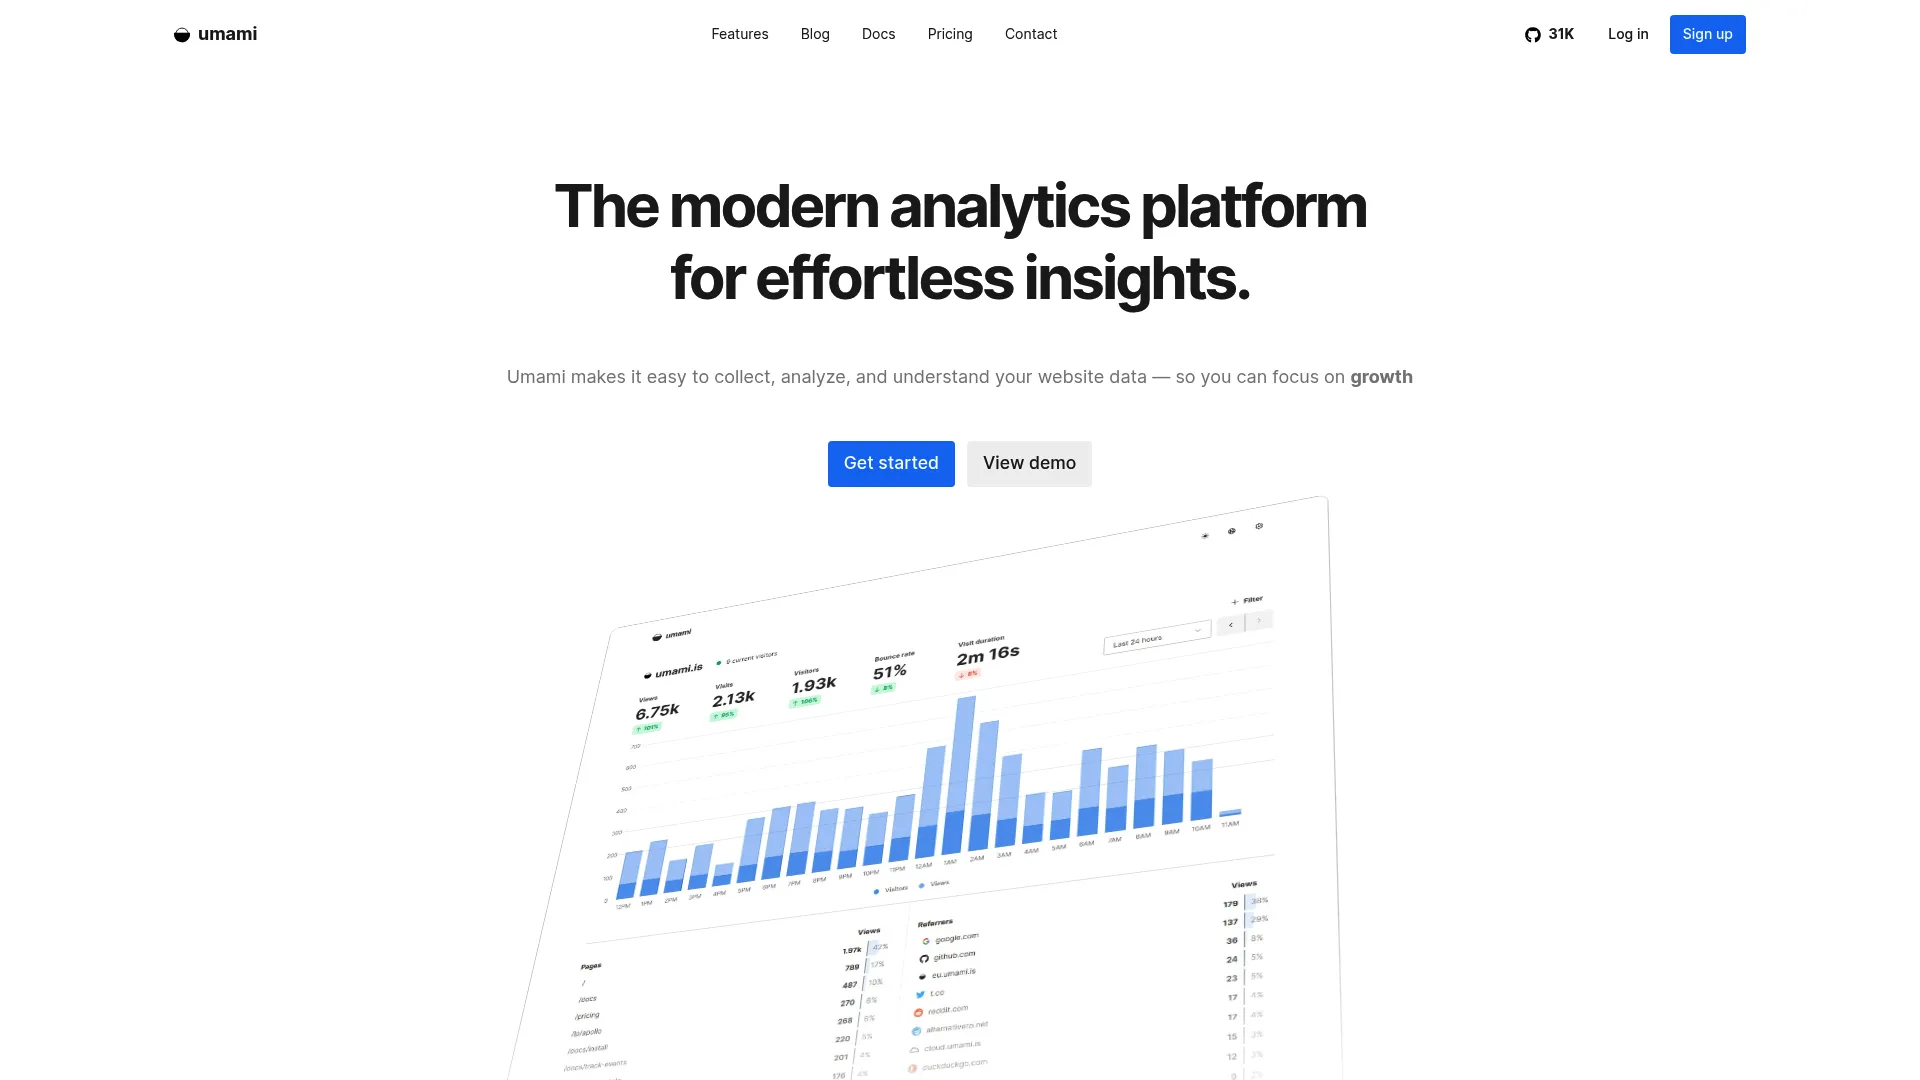
Umami
Umami is the scrappy open-source analytics tool that just works. Clean, simple, and you can host it yourself if you want complete control over your data.
Best Known for Simple Open Source Analytics
Umami proves that analytics don’t need to be complicated to be useful. The interface is clean and modern, showing you the essential metrics without overwhelming complexity.
Complete data ownership through self-hosting appeals to organizations with strict data governance requirements. You control everything about how your data is collected and stored.
Features
Essential website metrics include traffic sources, geographic data, and device information. The dashboard presents everything clearly without unnecessary complexity.
Custom event tracking captures important user actions beyond basic page views. Setup is straightforward compared to more complex platforms.
Self-hosting options provide complete data control and privacy. The Docker deployment makes installation and maintenance relatively simple.
Pros
Completely free for self-hosting eliminates ongoing costs. The open-source nature ensures transparency and enables customization.
Simple setup and maintenance reduce technical overhead. The lightweight design doesn’t impact website performance.
Privacy-compliant design eliminates consent banner requirements. Modern interface feels current and professional compared to some older alternatives.
Cons
Limited feature set compared to comprehensive analytics platforms. If you need advanced analysis capabilities, you’ll quickly outgrow Umami.
Smaller community means fewer resources and integrations available. You’re mostly on your own for support and extensions.
Self-hosting requires technical knowledge and server management. Not ideal if you don’t want to deal with infrastructure maintenance.
Criteria Evaluation
Ease of Setup: 4/5 – Simple for technical users, Docker options available
Privacy/Compliance: 5/5 – Privacy-first design with complete data control
Integration: 3/5 – Basic integrations with open-source flexibility
Reporting Depth: 2/5 – Essential metrics only, limited advanced features
Cost: 5/5 – Free self-hosted option, affordable cloud hosting
Community Reviews and Expert Recommendations
Developers appreciate the clean codebase and straightforward implementation. Privacy advocates recommend it for organizations prioritizing data ownership.
The general consensus is that it’s perfect for basic needs but limited for complex analysis requirements.
Source: Developer communities, open-source forums, and privacy-focused discussions
Pricing
Free for self-hosting. Cloud plans start at $20/month for hosted solutions.
Explore Umami at umami.is
Notable Mentions
A few other platforms deserve a quick mention for specific use cases, though they didn’t make the main list for various reasons.
Piwik PRO
Piwik PRO evolved from Matomo’s original codebase but went enterprise-focused with heavy compliance features. It’s popular in regulated industries like healthcare and finance where data governance is critical.
The platform combines analytics, tag management, and consent management in one solution, which is convenient but also makes it more complex than single-purpose tools.
Check out Piwik PRO at piwik.pro
Open Web Analytics (OWA)
OWA is a free, self-hosted option that includes some interesting features like click tracking and heatmaps. However, development has been sporadic, and the interface feels dated.
It’s worth considering if you need a completely free solution and have the technical skills to maintain it, but most businesses are better served by more actively developed alternatives.
Visit Open Web Analytics at openwebanalytics.com
Woopra
Woopra specializes in customer journey analytics, connecting website behavior with email interactions, support tickets, and other touchpoints. It’s powerful but expensive and complex.
The platform is designed for businesses with dedicated analytics teams and substantial budgets. Most smaller organizations find it overwhelming and costly.
Explore Woopra at woopra.com
Statcounter
Statcounter has been around since 1999 and offers straightforward web analytics with a focus on simplicity. It’s reliable but lacks modern features and interface design.
While it works fine for basic analytics needs, newer platforms offer better value and more comprehensive features for similar costs.
Visit Statcounter at statcounter.com
FAQ
Which alternative offers the best privacy compliance?
Plausible and Umami lead the pack for privacy compliance. Both are cookie-free by design and meet GDPR requirements automatically. PostHog also excels with its open-source transparency and EU data residency options.
If you’re dealing with strict privacy requirements, these three eliminate most compliance headaches without requiring legal expertise.
How difficult is migrating from Matomo?
Honestly? It depends on how complex your Matomo setup is. Simple configurations migrate easily to most platforms, but if you’ve got custom dimensions, complex goals, or extensive historical data, expect some pain.
GA4 and Adobe Analytics require the most setup work but can handle complex migrations. Simpler tools like Plausible and Fathom are easier to implement but you’ll lose some historical data and advanced features.
Plan for a parallel tracking period to ensure data continuity during the transition.
What’s the most cost-effective option for small businesses?
GA4 is hard to beat for pure cost-effectiveness – comprehensive features at zero cost. But factor in the time investment for setup and training .
Umami’s self-hosted option eliminates ongoing fees entirely if you’ve got technical skills. Plausible and Fathom offer good value for businesses that want simplicity without the Google ecosystem.
Which platform provides the deepest insights?
Adobe Analytics and Amplitude offer the most sophisticated analysis capabilities, but they’re expensive and complex. GA4 provides comprehensive insights for free but requires expertise to unlock advanced features.
For product-focused businesses, Mixpanel and PostHog deliver excellent behavioral analytics. The choice depends on whether you need traditional web analytics or product-focused insights.
Do I need technical expertise for these alternatives?
Plausible, Fathom, and Hotjar are designed for non-technical users – basically copy and paste a script and you’re done. GA4 and Mixpanel need more configuration but have extensive documentation.
Adobe Analytics, Amplitude, and self-hosted options like Umami typically require dedicated technical resources or professional implementation services.
Final Thoughts
Look, here’s what I’ve learned after testing all these platforms: there’s no perfect analytics tool, just tools that fit your specific situation better than others.
If you’re a small business owner who just wants to understand your website traffic without becoming a data scientist, go with Plausible or Fathom. They’ll give you what you need without the headaches.
Running a SaaS product or web app? Mixpanel or PostHog will show you how users actually interact with your product, which is way more valuable than knowing they visited your homepage.
Enterprise with deep pockets and dedicated analytics teams? Adobe Analytics or Amplitude provide the sophisticated analysis capabilities that justify their high costs.
Want something free but powerful? GA4 is still the best option if you’re willing to invest time in learning it properly.
The key thing is matching the tool to your actual needs, not just picking the one with the most features. I’ve seen too many teams struggle with overpowered platforms when something simpler would have served them better.
Whatever you choose, remember that the best analytics platform is the one your team actually uses. A simple tool that provides actionable insights beats a sophisticated platform that sits unused because it’s too complex to navigate.
Start with your privacy requirements, consider your technical resources, and pick something that fits your budget – both in terms of money and time investment. You can always migrate later as your needs evolve.
