
Look, we’ve all been there. You set a goal, track your progress with some basic math, and think you’ve got it figured out. Current number divided by target number, multiply by 100 – boom, you’re done.
But here’s the thing I’ve learned after years of helping businesses track their goals: that simple formula will lie to you almost every time.
Just last month, I was in a meeting where the sales director was practically doing a victory dance. “We’re at 60% of our annual goal and it’s only August!” he announced. The room went quiet when someone pointed out that August means we’re 67% through the year. That celebration turned into a strategy session real quick.
The percent to goal calculator takes your current progress and final goal, does the division, multiplies by 100, and spits out a percentage. Sounds foolproof, right? Wrong. This basic approach creates more problems than it solves because it completely ignores context, timing, and the messy reality of how business actually works.
Table of Contents
-
Understanding the Real Math Behind Progress Tracking
-
Why Most People Calculate Progress Wrong
-
Digital Tools That Actually Work for Goal Tracking
-
How Smart Businesses Use These Calculations
-
Fixing Common Mistakes That Kill Your Results
-
Advanced Strategies for Better Performance Insights
TL;DR
-
Most progress calculations fail because people use the wrong formula or garbage data
-
The basic formula is simple: (Current Value ÷ Target Goal) × 100, but real life gets messy fast
-
Time matters more than you think – being 50% done with 75% of your time gone is bad news
-
Digital calculators save time, but picking the wrong one makes everything worse
-
Sales and marketing teams need completely different approaches to get useful numbers
-
Bad data and unrealistic goals kill more tracking systems than bad math
-
Smart analytics can predict problems before they blow up your goals
Understanding the Real Math Behind Progress Tracking
Progress tracking isn’t just about knowing where you stand – it’s about figuring out if you’re moving fast enough to actually hit your targets. I’ve seen too many people think they’re crushing it because they’ve completed 50% of their goal, completely missing that they’re already 75% through their timeline.
Here’s what drives me crazy: everyone treats this like it’s just basic math, but the fundamentals of percent to goal calculations are way more complex than simple division. Getting this foundation right is the difference between tracking that actually helps and tracking that just makes you feel busy.

The Formula Everyone Gets Wrong
You’d think calculating progress would be straightforward. Take what you’ve done, divide by what you want to do, multiply by 100. Done, right?
Nope. That basic formula only works in perfect scenarios that basically never exist in real life.
The standard percent to goal calculator formula – (Current Value ÷ Target Goal) × 100 – assumes your goal builds up over time and timing doesn’t matter. But what happens when you’re tracking conversion rates instead of total sales? What about seasonal businesses where December performance can’t be compared to February?
I watched a team celebrate hitting 60% of their annual revenue goal in August, completely missing that they should’ve been at 67% to stay on track. The math looked good, but the context made it meaningless.
Understanding the mathematics behind business performance requires the same analytical rigor used in retail math calculations, where context and timing fundamentally change what the numbers actually mean.
Here’s a perfect example: Take Mike’s Honda dealership in Phoenix. They set an annual goal of 1,200 vehicles. By September (75% through the year), they’ve sold 720 cars – that’s 60% of their goal. Looks concerning, right?
But here’s the thing – Mike knows that 40% of his sales happen in Q4 when people are using year-end bonuses and dealers are pushing inventory. In the desert, nobody buys cars in July and August when it’s 115 degrees outside. So that 60% achievement? He’s actually ahead of schedule. Same math, completely different reality.
Different Goals Need Different Math
Not every goal fits the same calculation mold. This is where most people mess up big time.
Cumulative goals work with straightforward division. But rate-based goals? Completely different beast.
When you’re tracking conversion rates, customer satisfaction scores, or efficiency metrics, you’re comparing current rates against target rates. A 5% conversion rate when your goal is 4% means you’re at 125% of goal – not 5%. I’ve seen marketing teams panic because they thought their 5% rate was terrible, not realizing they were actually crushing their targets.
Binary outcomes create another headache. Did you launch the product on time? Did you pass the certification? These yes/no goals need weighted calculations when you’re mixing them with other metrics.
|
Goal Type |
Formula |
Example |
|---|---|---|
|
Cumulative |
(Current ÷ Target) × 100 |
Sales: ($50K ÷ $100K) × 100 = 50% |
|
Rate-Based |
(Current Rate ÷ Target Rate) × 100 |
Conversion: (5% ÷ 4%) × 100 = 125% |
|
Binary |
Weighted Average |
Project Launch: (1 ÷ 1) × Weight = 100% × 30% |
|
Efficiency |
(Output ÷ Input) ÷ Target × 100 |
Productivity: (100 units ÷ 8 hours) ÷ 10 × 100 = 125% |
Time Changes Everything
Here’s where most progress tracking completely falls apart: ignoring time.
If you’ve completed 40% of your goal but you’re 60% through your timeline, you’re not “making progress” – you’re behind. Way behind. Checking if you’re actually on schedule compares your progress percentage against how much time has passed to show your real status.
Seasonal adjustments make this even trickier. Retail businesses know Q4 drives crazy revenue. Software companies see subscription renewals cluster around contract anniversaries. Your percent to goal calculator needs to account for these patterns, or your tracking becomes useless during off-peak periods.
I’ve seen marketing teams completely panic in January because their lead generation was “only” at 5% of annual goal. They forgot that their industry sees 40% of annual activity in the final quarter. January panic led to budget cuts that hurt them when busy season actually arrived.
Handling Multiple Goals at Once
Real businesses don’t track single goals in isolation. You’re juggling revenue targets, customer acquisition costs, retention rates, and operational efficiency metrics all at the same time.
Weighted goal calculations assign importance levels to different objectives. Maybe revenue is worth 50% of your overall score, customer satisfaction is 30%, and operational metrics make up the remaining 20%. Your composite percent to goal reflects what actually matters to your business, not just mathematical averages.
This prevents the trap I see everywhere: teams optimizing for easy-to-achieve goals while ignoring the hard stuff that actually moves the needle. When you calculate percentage across multiple weighted goals, you get a picture of how you’re really doing overall.
Why Most People Calculate Progress Wrong
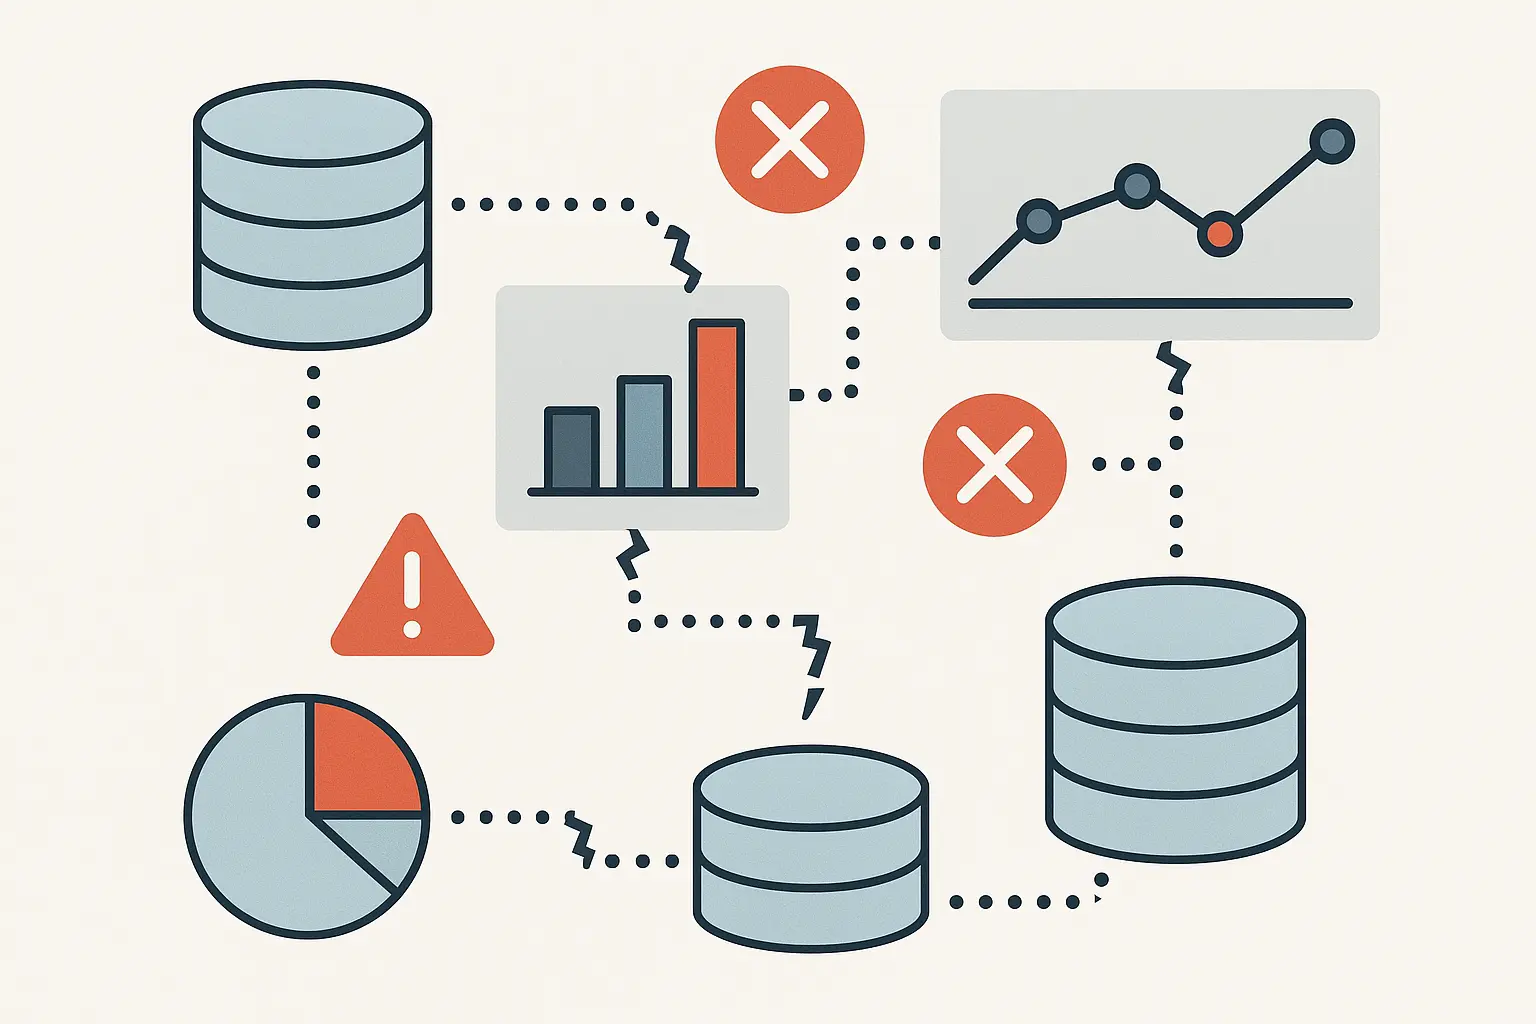
The biggest problem with progress tracking isn’t the math – it’s everything that happens before you get to the math. Bad data, unrealistic goals, and timing mismatches create calculations that look precise but tell you absolutely nothing useful.
I can’t tell you how many times I’ve walked into a company and found three different systems showing three completely different “truths” about the same metric. It’s maddening, and it happens everywhere.
Recent analysis of federal budget planning shows how mathematical precision can mask fundamental flaws in goal setting. “Scott Bessent’s 3 percent deficit target would require massive cuts” according to the American Progress, showing how seemingly achievable numerical targets can hide unrealistic implementation requirements.
When Bessent’s plan calls for reducing the federal deficit to 3% of GDP while maintaining current spending levels, the math simply doesn’t work without massive program cuts. It’s a perfect example of how percent to goal calculator results become meaningless when your underlying assumptions are completely unrealistic.
The Data Quality Disaster
Your percent to goal calculator is only as good as the data you’re feeding it. Garbage in, garbage out isn’t just a programming concept – it’s the harsh reality of most business tracking.
Inconsistent data sources create the first nightmare. Your CRM shows one set of numbers, your analytics platform shows another, and your accounting system has a third version. Which one feeds your percent to goal calculator? Most people pick whichever one looks best, not the one that’s actually accurate.
Missing values wreck calculations in ways you don’t even notice. If your system doesn’t capture weekend sales but your goal includes them, your percent to goal will always look artificially low. Timing mismatches are even worse – comparing daily performance against monthly targets, or mixing fiscal year goals with calendar year measurements.
I audited a tracking system where the percent to goal consistently showed underperformance. Turns out the real problem was data collection that missed 30% of actual results. The team was beating themselves up over “poor performance” when they were actually exceeding targets.
Data quality issues plague business analytics everywhere, which is why comprehensive GA4 audits are essential for making sure your measurements actually reflect reality.
Goal Setting That Guarantees Failure
Unrealistic goals don’t just kill team morale – they make percent to goal calculator results completely meaningless. When your target is impossible, hitting 60% might actually represent exceptional performance.
Poorly defined success metrics create another layer of confusion. What exactly counts toward your goal? Are you tracking gross revenue or net revenue? New customers or total customers? Active users or registered users? These distinctions completely change your calculations.
Here’s what really gets me: companies that change their target definitions mid-period based on performance. I’ve seen teams adjust their goals quarterly, essentially guaranteeing they’ll always hit 100%. The math works, but you’ve learned absolutely nothing.
Progress Tracking Checklist:
-
Define exactly what counts toward your goal (be specific!)
-
Set up consistent data collection methods
-
Set realistic but challenging targets
-
Account for seasonal ups and downs
-
Document how you’re calculating everything
-
Review and validate data sources monthly
-
Make sure timeline expectations match goal difficulty
The Context Problem
Numbers without context are just numbers. Your percent to goal might show 85% achievement, but what does that actually mean?
Market conditions completely change what “good” performance looks like. Hitting 70% of your growth goal during a recession might be incredible. Hitting 110% during a boom might be disappointing. Your calculator doesn’t know this unless you build in external benchmarks.
Resource allocation changes throughout goal periods. If you planned to spend $100K on marketing but only spent $60K, your revenue percent to goal needs adjustment. Otherwise, you’re comparing actual results against theoretical targets that never had proper support.
Competitive dynamics shift constantly. Your customer acquisition goal might be perfectly reasonable until a major competitor slashes prices or some new player enters your market and changes everything overnight.
The challenge of understanding percentages correctly extends way beyond business. As highlighted in recent journalism training materials, “percentage change and percentage-point change get mixed up all the time” according to Journalist’s Resource, with experts noting that even experienced professionals struggle with these concepts.
When a diagnosis rate increases from 1% in 1981 to 5% in 2021, it’s accurate to say the rate rose 4 percentage points – but the actual percentage change is 400%, not 4%. This confusion between percentage points and percent change is exactly the kind of context problem that makes business goal tracking misleading when you calculate percentage without understanding what your baseline really means.
Digital Tools That Actually Work for Goal Tracking
Choosing the right digital tools for percent to goal tracking can make the difference between insights that actually help you make decisions and expensive spreadsheet theater that just makes you feel productive.
You know that sinking feeling when you realize your fancy new tracking tool can’t talk to any of your existing systems? Yeah, that’s exactly what happens with most goal tracking tools too.
What to Look for in Calculator Tools
Essential features separate useful calculators from digital paperweights. Real-time data input means your percent to goal calculator updates automatically as new information comes in. No more manually updating spreadsheets that are outdated before you finish entering the numbers.
Multiple goal tracking in a single interface saves you from the chaos of managing separate calculators for different objectives. Historical trend analysis shows patterns over time, not just snapshots. Customizable reporting presents information differently for executives, managers, and individual contributors.
Integration capabilities matter way more than fancy features. The best calculator in the world is useless if it can’t connect to your CRM, analytics platform, or project management system. Automated data collection eliminates human error and keeps everything consistent.
Mobile optimization isn’t optional anymore. Decision-makers need access to percent to goal information regardless of where they are or what device they’re using. If your calculator doesn’t work on phones, it won’t get used when it actually matters.
Here’s the thing though – a fitness enthusiast tracking weight loss needs completely different features than a sales manager monitoring quarterly quotas. The fitness tracker might need daily weigh-ins, body composition metrics, and progress photos while calculating percent to goal against a target weight. The sales manager needs CRM integration, pipeline forecasting, and team performance comparisons. Both use the same basic formula, but their tool requirements are worlds apart.
Building Your Own Solution
Sometimes off-the-shelf calculators just don’t fit what you actually need. Building custom solutions gives you complete control, but requires more upfront work.
Spreadsheet-based solutions offer surprising power. Excel and Google Sheets handle complex formulas, conditional formatting, and automated reporting. You can create dashboard-style interfaces that rival expensive software.
Start with basic columns for goals, current values, and calculated percentages. Add conditional formatting to highlight progress levels visually. Use charts and graphs to show trends over time. The key is making information scannable at a glance.
Automated data refresh eliminates manual updates. Connect your spreadsheet to external data sources through APIs or database connections. Your percent to goal calculator calculations update automatically as new data arrives.
Web-based calculator development provides more flexibility but requires technical know-how. Custom applications can integrate with multiple data sources, handle complex business logic, and provide sophisticated user interfaces.
Database integration becomes critical for web-based solutions. Design your system to pull current performance data from existing systems while keeping historical records for trend analysis. When you calculate percentage across multiple time periods, proper data setup prevents everything from slowing to a crawl.
Integration Strategy That Actually Works
The best calculator is worthless if it doesn’t fit your workflow. Integration strategy determines whether your tool becomes essential or gets abandoned after the initial enthusiasm wears off.
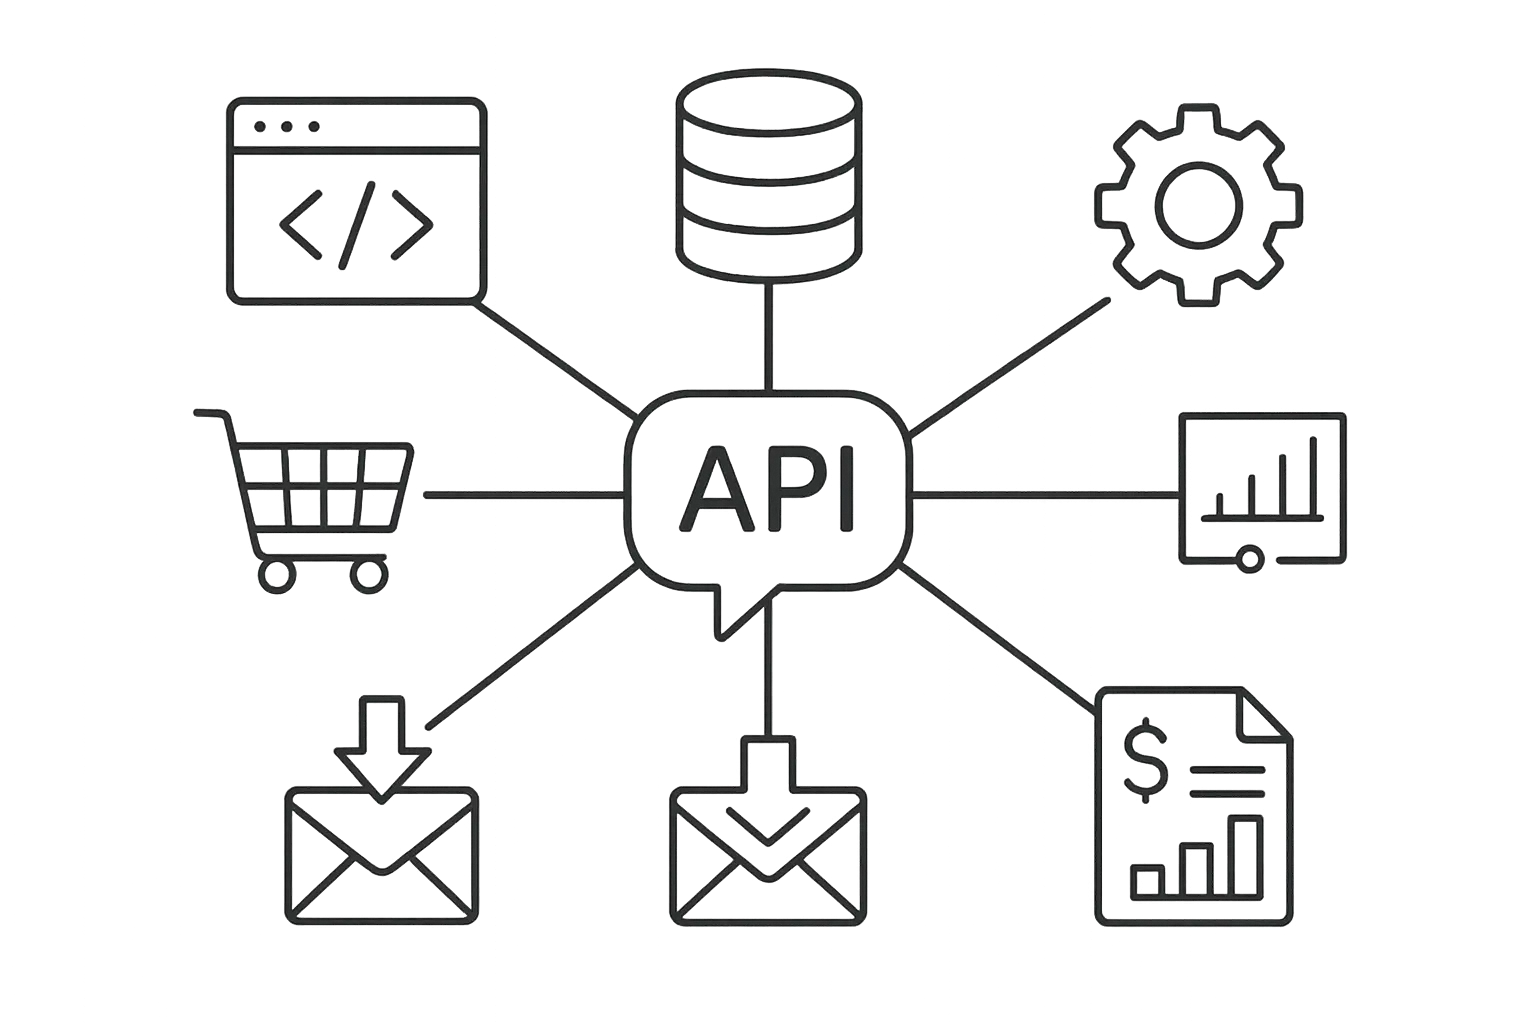
API connections let your calculator pull data from existing systems automatically. CRM integration means sales performance updates in real-time. Analytics platform connections keep marketing metrics current. Project management tool integration keeps operational goals synchronized.
Single sign-on eliminates password fatigue and reduces barriers to actually using the thing. If people need separate credentials for your percent to goal calculator, usage will drop dramatically.
Notification systems alert people when goals are at risk or milestones are achieved. But be careful – too many alerts create noise that gets ignored. Focus on notifications that actually require decisions or responses.
Tool integration challenges mirror those faced when selecting SEO content tools, where the best individual features mean nothing if the platform doesn’t work seamlessly with your existing workflow and data sources.
How Smart Businesses Use These Calculations
The most successful companies don’t just calculate percent to goal – they use these metrics to make specific business decisions and fix performance problems in real-time. Sales teams, marketing departments, and operations groups each need completely different approaches to make percent to goal calculations actually useful rather than just interesting numbers on a dashboard.
Sales Performance That Drives Results
Sales teams live and die by percent to goal calculator metrics, but most use them completely wrong. Individual quota tracking is just the starting point. Smart sales organizations layer in pipeline analysis, conversion rate trends, and activity-based leading indicators.
Individual versus team calculations require different approaches. Personal quota attainment is straightforward math, but team performance involves weighted averages based on territory size, experience levels, and product specializations. A new rep hitting 60% of quota might be performing way better than a veteran hitting 80%.
Pipeline forecasting integration transforms percent to goal from backward-looking reporting to forward-looking strategy. Current achievement plus qualified pipeline opportunities, adjusted for historical conversion rates, predicts future performance with surprising accuracy.
Conversion rate adjustments add another layer of sophistication. Your percent to goal calculator should account for deal probability and timing factors. A pipeline full of low-probability opportunities looks different from one with high-confidence deals, even if the dollar amounts are similar.
Activity-based metrics provide early warning systems. If your calls-to-meetings conversion rate drops, your revenue percent to goal will suffer in future periods. Smart sales managers track leading indicators alongside lagging results.
|
Sales Metric |
Calculation Method |
Typical Target |
Warning Threshold |
|---|---|---|---|
|
Revenue Quota |
(Actual Revenue ÷ Quota) × 100 |
100%+ |
<80% by month 9 |
|
Pipeline Coverage |
(Pipeline Value ÷ Remaining Quota) × Close Rate |
3-5x |
<2x coverage |
|
Activity Goals |
(Completed Activities ÷ Target Activities) × 100 |
100%+ |
<90% consistently |
|
Conversion Rates |
(Conversions ÷ Opportunities) × 100 |
Varies by stage |
20%+ decline |
Marketing Optimization Beyond Vanity Metrics
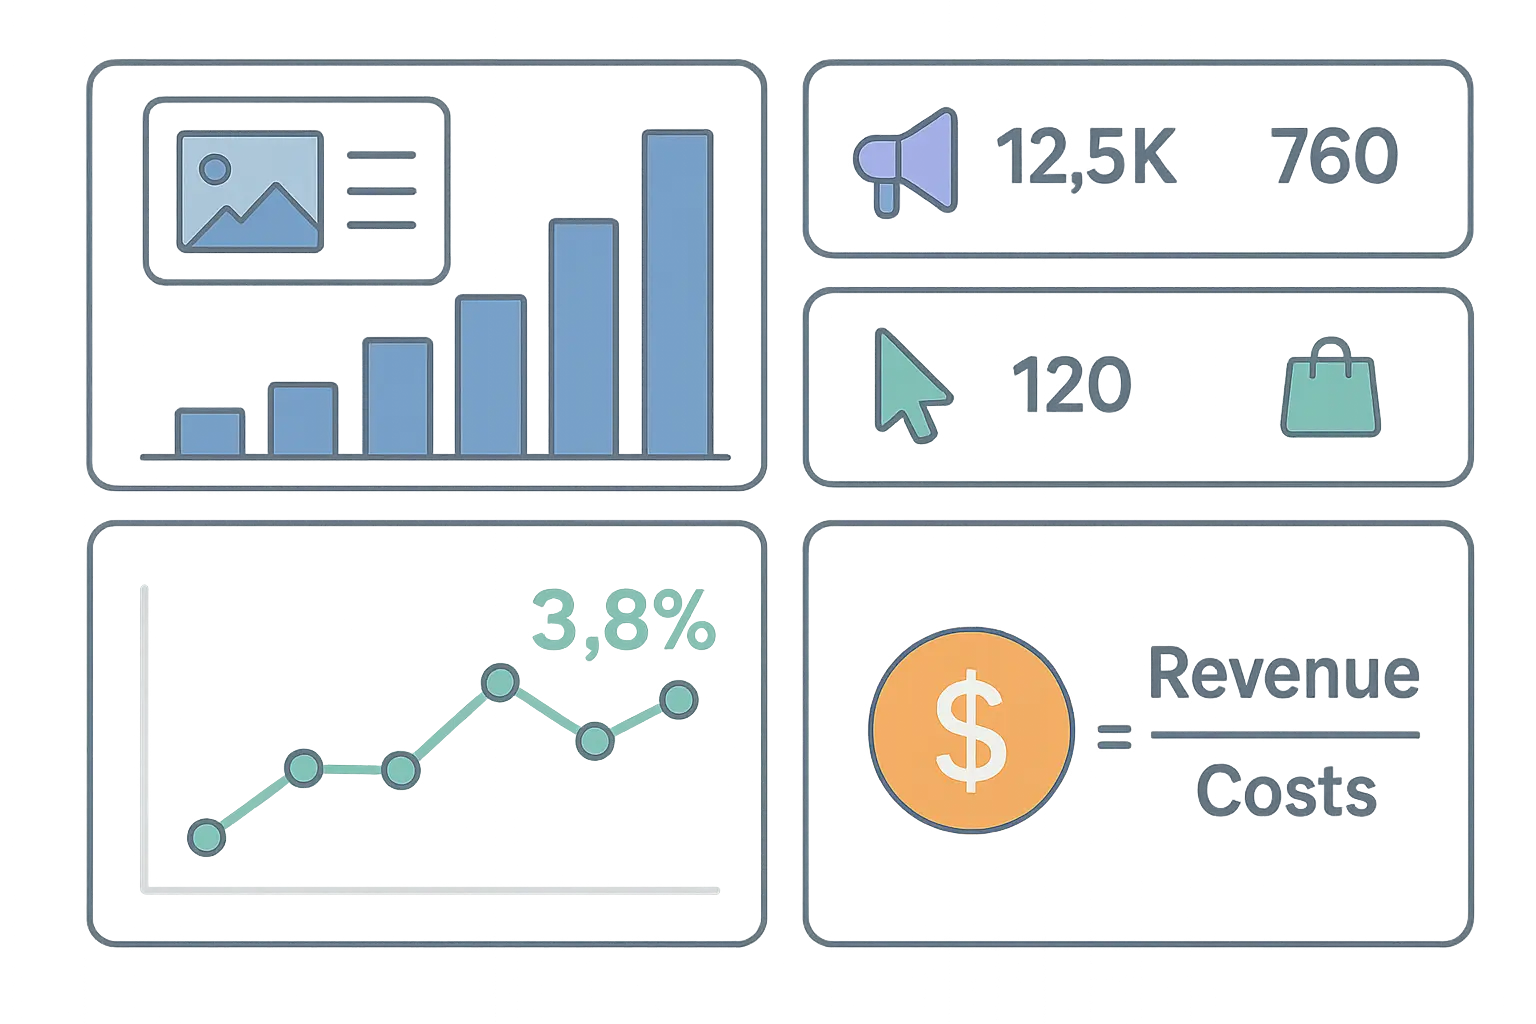
Marketing teams often get seduced by vanity metrics that look impressive but don’t actually drive business results. Percent to goal calculations should focus on outcomes that matter: qualified leads, conversion rates, and customer acquisition costs.
Multi-channel attribution modeling complicates percent to goal calculator results but provides way better insights. When customers interact with multiple touchpoints before converting, simple attribution gives misleading results. Your email campaign might show 120% of goal while your paid search shows 60%, but they’re working together to drive results.
ROI-based goal setting ties percent to goal directly to business impact. Instead of tracking email opens or social media followers, focus on metrics that connect to revenue. Cost per acquisition, customer lifetime value, and return on ad spend provide actionable insights.
Campaign optimization becomes systematic when percent to goal calculations include profitability metrics. You might be hitting lead generation targets while missing profitability goals because acquisition costs are too high.
Seasonal adjustment factors help marketing teams avoid panic during natural low periods and complacency during peak seasons. Your percent to goal calculator should reflect expected seasonal patterns, not treat every month equally.
Marketing measurement complexity increases when teams need to identify high-impact blog topics that drive measurable business results rather than just traffic vanity metrics.
Operations and Project Management Applications
Operational goals often involve multiple interconnected metrics that traditional percent to goal calculator systems handle poorly. Project completion rates, quality scores, and efficiency metrics need sophisticated tracking approaches.
Milestone-based tracking works better than simple percentage completion for complex projects. Breaking large goals into smaller, measurable milestones provides more accurate progress assessment and catches problems earlier.
Quality-adjusted progress prevents the common trap of sacrificing standards to hit numerical targets. Your percent to goal calculation should include quality metrics alongside quantity measures. Completing 90% of tasks with 60% quality is way worse than completing 70% with 95% quality.
Resource utilization tracking ensures your percent to goal calculations account for input efficiency. Hitting targets while using 150% of planned resources indicates process problems, not success.
Cross-functional dependencies require coordinated percent to goal tracking. When Team A’s progress affects Team B’s ability to achieve their goals, isolated calculations miss the bigger picture.
Here’s a real example: A software development team with a goal of releasing 12 features per quarter might show 83% completion (10 features delivered) in week 11 of a 12-week quarter. However, if 3 features were delivered with critical bugs requiring rework, and 2 features are blocked waiting for API changes from another team, the real progress is closer to 58%. Quality adjustments and dependency tracking reveal the true status that simple completion percentages hide.
Fixing Common Mistakes That Kill Your Results
Even sophisticated percent to goal tracking systems fail when fundamental mistakes creep into data collection, goal setting, or calculation methodology. The most expensive analytics platform can’t fix bad inputs or unrealistic targets. Identifying and correcting these common problems transforms percent to goal calculations from misleading noise into actionable business intelligence.
Data Problems That Ruin Everything
Data validation protocols prevent most calculation errors before they impact decision-making. Cross-reference multiple sources and flag discrepancies automatically. When your CRM shows different numbers than your analytics platform, investigate immediately rather than picking the version you prefer.
Source validation becomes critical when multiple systems track similar metrics. Your email platform, CRM, and analytics tool might all count “leads” differently. Define exactly what counts toward each goal and ensure consistent measurement across all sources.
Timing synchronization eliminates comparison errors between different measurement periods. Don’t compare daily performance against monthly targets or mix fiscal year goals with calendar year measurements. Align your data collection periods with your goal timeframes.
Missing data handling requires systematic approaches. Decide upfront how to handle weekends, holidays, system downtime, and other gaps in data collection. Inconsistent handling creates artificial fluctuations in percent to goal calculator results.
Data freshness standards ensure your calculations reflect current reality. Real-time updates aren’t always necessary, but you need to know how old your data is and whether delays affect decision-making.

Goal Setting That Actually Works
SMART goal integration ensures your targets meet basic criteria for measurability and achievability. Specific, Measurable, Achievable, Relevant, and Time-bound goals create meaningful percent to goal calculator results. Vague objectives produce meaningless percentages.
Baseline establishment provides context for goal difficulty. A 20% growth target means different things for a startup versus an established company. Your percent to goal calculation should reflect the challenge level, not just the mathematical result.
Market condition adjustments account for external factors beyond your control. Economic downturns, competitive changes, and industry disruptions affect what “good” performance looks like. Build flexibility into your goal-setting process.
Resource allocation alignment ensures your goals match your actual capabilities. Ambitious targets without proper support guarantee failure and make percent to goal calculations meaningless. Match your goals to your resources, or adjust resources to match your goals.
Regular review cycles prevent goal obsolescence. Business conditions change faster than annual planning cycles. Quarterly goal reviews keep your targets relevant and your percent to goal calculator results meaningful.
Strategic goal setting requires the same methodical approach used in market sizing analysis, where realistic assumptions and data-driven projections determine whether targets are achievable or merely aspirational.
Goal Setting Template:
-
Specific: Define exactly what success looks like
-
Measurable: Establish clear metrics and data sources
-
Achievable: Verify resources and capabilities align
-
Relevant: Connect to broader business objectives
-
Time-bound: Set clear deadlines and milestones
-
Baseline: Document current performance levels
-
Context: Account for market and competitive factors
Calculation Methodology Fixes
Formula selection depends on your specific goal type and business context. Cumulative goals use different calculations than rate-based goals. Binary outcomes require different approaches than continuous metrics. Choose the right formula for your situation.
Weighting systems prevent easy goals from dominating your overall percent to goal calculator results. Assign importance levels to different objectives based on strategic priorities. Revenue goals might carry more weight than activity metrics.
Seasonal adjustment factors smooth out natural fluctuations that distort percent to goal calculations. Retail businesses see Q4 spikes. B2B companies experience summer slowdowns. Account for these patterns in your calculations.
Outlier handling prevents unusual events from skewing your percent to goal trends. One massive deal or system outage shouldn’t dominate your performance assessment. Establish protocols for handling exceptional circumstances.
Confidence intervals add statistical rigor to percent to goal calculations. Instead of reporting a single percentage, provide ranges that reflect data quality and measurement uncertainty. This prevents false precision and overconfident decision-making. When you calculate percentage with confidence intervals, stakeholders understand the reliability of your projections.
Advanced Strategies for Better Performance Insights
Basic percent to goal calculations tell you where you are, but advanced analytics predict where you’re going and why. Machine learning algorithms, predictive modeling, and automated anomaly detection transform simple progress tracking into sophisticated performance management systems that catch problems early and identify optimization opportunities before they become obvious.

Predictive Analytics Integration
Machine learning algorithms analyze historical percent to goal calculator patterns to forecast future performance with surprising accuracy. These systems identify subtle trends that human analysis misses and provide early warning signs of potential problems.
Trend analysis algorithms go beyond simple linear projections. They account for seasonality, cyclical patterns, and external factors that influence performance. Your percent to goal calculation becomes the foundation for sophisticated forecasting models.
Regression analysis identifies which factors most strongly influence your percent to goal achievement. Maybe marketing spend has a three-week lag effect on sales performance. Perhaps team size changes affect productivity for two months. These insights drive better resource allocation decisions.
Anomaly detection systems automatically flag unusual percent to goal patterns that might indicate data errors, market changes, or operational issues. Instead of waiting for monthly reviews to catch problems, you get immediate alerts when performance deviates from expected patterns.
Confidence scoring adds statistical rigor to predictions. Instead of saying “you’ll hit 95% of goal,” advanced systems report “you’ll achieve 85-105% of goal with 90% confidence.” This prevents overconfident decision-making based on false precision.
Advanced analytics integration requires the same systematic approach used in creating continuously learning AI systems, where machine learning models improve performance tracking accuracy over time through iterative data analysis.
Real-Time Dashboard Development
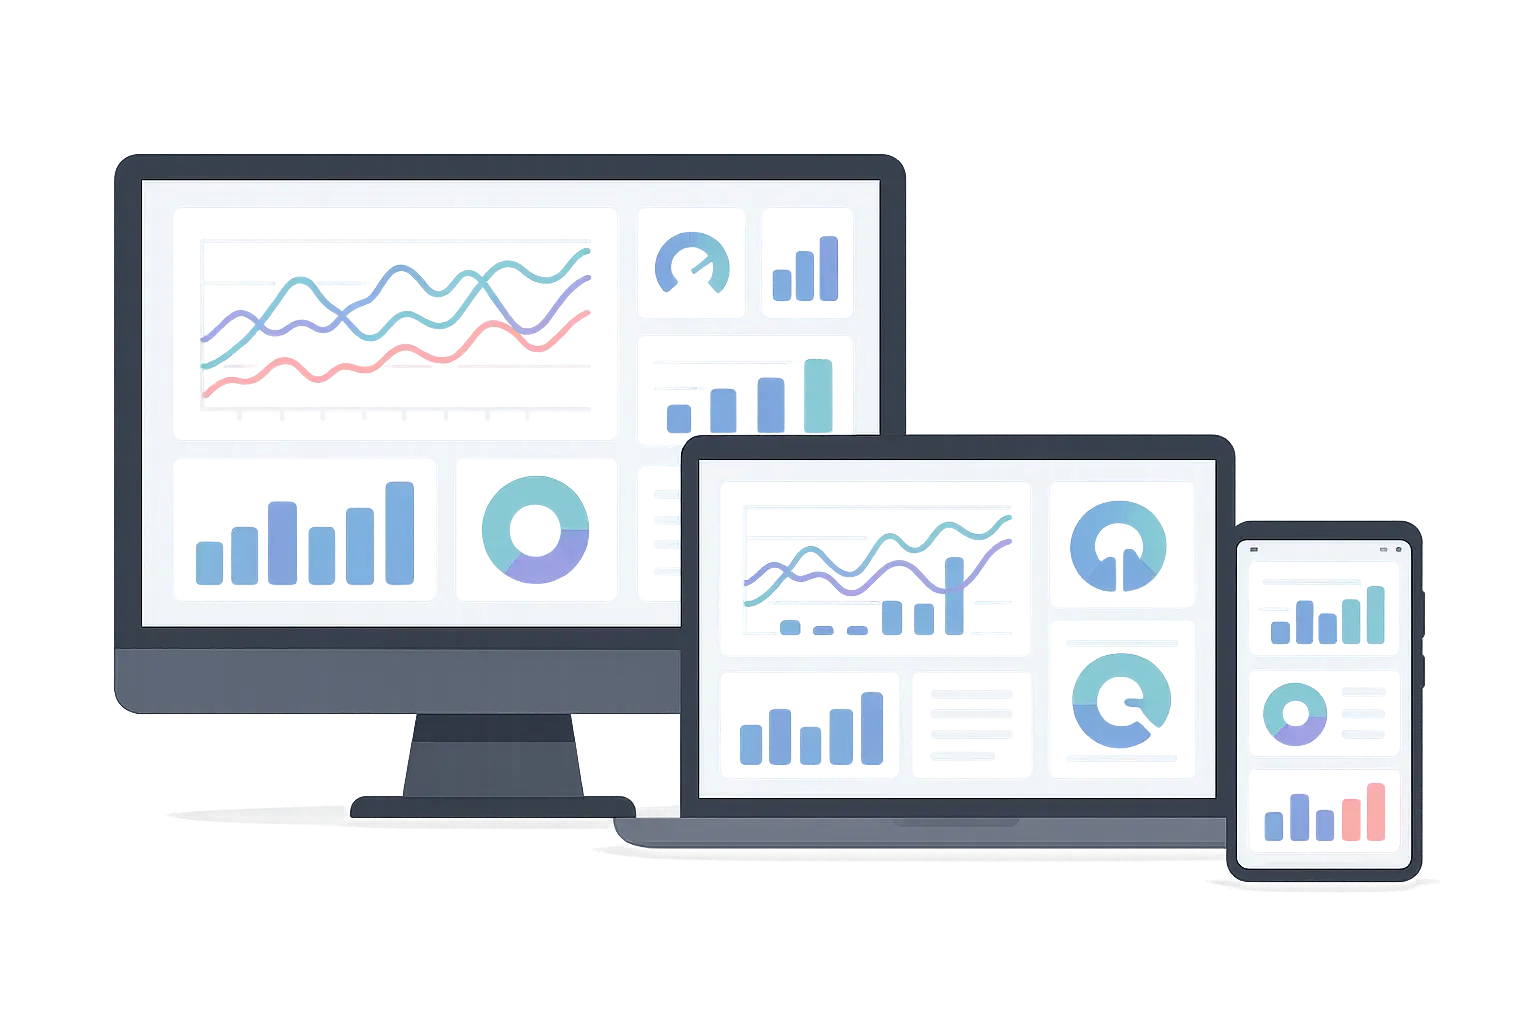
Comprehensive dashboards display percent to goal calculator metrics alongside contextual information that drives better decisions. Market conditions, resource allocation, competitive benchmarks, and external factors provide the context that raw percentages lack.
Visual hierarchy guides attention to the most important metrics first. Critical goals that are off-track get prominent placement and visual alerts. Secondary metrics provide supporting context without cluttering the interface.
Drill-down capabilities allow users to explore percent to goal data at different levels of detail. Executives see high-level summaries while managers access departmental breakdowns and individual contributors focus on personal metrics.
Mobile optimization ensures decision-makers can access percent to goal information anywhere. Responsive design adapts to different screen sizes without losing functionality. Push notifications alert stakeholders to critical changes even when they’re not actively monitoring dashboards.
Automated reporting generates percent to goal calculator summaries on predetermined schedules. Weekly executive briefings, monthly department reviews, and quarterly board presentations pull current data automatically. No more scrambling to compile reports before important meetings.
Performance Optimization Strategies
Bottleneck identification uses percent to goal calculator data to pinpoint process constraints that limit overall performance. When one metric consistently underperforms while others exceed targets, you’ve found your limiting factor.
Resource reallocation becomes data-driven when percent to goal calculations show which areas need additional support. Instead of spreading resources evenly, concentrate efforts where they’ll have the biggest impact on overall goal achievement.
Process improvement initiatives target the activities that most strongly influence percent to goal performance. A/B testing different approaches while monitoring percent to goal changes identifies the most effective optimization strategies.
Benchmark comparison puts your percent to goal performance in industry context. Hitting 80% of goal might be excellent performance if industry average is 65%, or concerning if competitors average 95%.
Continuous improvement cycles use percent to goal trends to guide systematic optimization efforts. Monthly reviews identify patterns, quarterly assessments evaluate improvement initiatives, and annual planning incorporates lessons learned from percent to goal analysis.
Performance Optimization Checklist:
-
Identify bottlenecks limiting overall performance
-
Reallocate resources based on percent to goal data
-
Test process improvements systematically
-
Compare performance against industry benchmarks
-
Implement continuous improvement cycles
-
Monitor leading indicators alongside lagging metrics
-
Automate anomaly detection and alerting
How The Marketing Agency Can Transform Your Progress Tracking
Most businesses struggle with percent to goal calculator implementations because they’re trying to track too many metrics without proper systems or expertise. The Marketing Agency’s data-driven approach solves this problem by implementing sophisticated tracking systems that actually drive business decisions.
Our proprietary analytics platforms integrate with your existing systems to provide real-time percent to goal calculations across all marketing channels. Instead of manually updating spreadsheets or guessing whether campaigns are working, you get automated dashboards that show exactly where you stand against every target.
We specialize in multi-channel attribution modeling that makes percent to goal calculator results meaningful for complex marketing funnels. When prospects interact with email, social media, paid ads, and content before converting, simple tracking gives misleading results. Our systems show how each channel contributes to overall goal achievement.
Ready to stop guessing about your marketing performance? Contact The Marketing Agency today to learn how our data-driven tracking systems can transform your percent to goal calculations from confusing numbers into actionable business intelligence.

Final Thoughts
Percent to goal calculations seem simple on the surface, but real-world applications require sophisticated approaches to data collection, goal setting, and performance analysis. The difference between useful tracking and meaningless numbers comes down to understanding your specific business context, choosing appropriate calculation methods, and building systems that provide actionable insights rather than just mathematical precision.
Most businesses treat percent to goal calculator systems as a reporting exercise rather than a strategic tool. They calculate percentages, put them in presentations, and move on without using the insights to actually make decisions. This approach wastes time and creates false confidence in metrics that don’t reflect business reality.
The companies that get real value from percent to goal calculator implementations treat them as the foundation for continuous improvement. They use these metrics to identify problems early, optimize resource allocation, and make data-driven decisions about strategy and tactics. Their tracking systems evolve constantly based on what they learn about their business and market conditions.
Look, most of you reading this won’t implement half of what I’ve covered here. That’s fine. Just pick the one thing that’s driving you crazy right now and fix that first. Perfect tracking that nobody uses is worse than simple tracking that actually helps you make decisions.
Your percent to goal calculations are only as valuable as the actions they inspire. Perfect mathematical precision means nothing if it doesn’t help you achieve better results. Focus on building tracking systems that drive better decisions, not just more accurate numbers.


