


Table of Contents
-
Understanding Twitch’s Complex Money-Making System
-
Breaking Down the Core Revenue Streams
-
Advanced Metrics That Actually Matter for Your Bottom Line
-
Smart Strategies for Maximizing Your Revenue Potential
-
Choosing the Right Calculator Tools for Accurate Projections
-
How Professional Marketing Support Can Transform Your Earnings
-
Final Thoughts
TL;DR
-
Most basic Twitch revenue calculators miss crucial variables like geographic demographics and engagement rates that significantly impact your actual earnings
-
Your partnership status (Affiliate vs Partner) dramatically affects revenue calculations, with Partners receiving better splits and more monetization options
-
Accurate revenue forecasting requires integrating data from multiple sources beyond just Twitch Analytics, including third-party tools and social media metrics
-
Geographic location of your viewers matters more than you think – North American and European audiences generate higher CPM rates
-
Seasonal trends and content category choices can swing your ad revenue by significant margins that basic calculators don’t account for
-
Professional-grade calculators should help with tax planning and business expense integration, not just earnings estimates
Understanding Twitch’s Complex Money-Making System
Look, I’ve been streaming for three years now, and I still remember the crushing disappointment of my first payout. I had this basic calculator telling me I’d made around $300 that month. When Twitch finally paid me? $127. I was so confused I actually contacted support thinking there was a mistake.
Turns out, most of us are doing this completely wrong. We think it’s simple math – views times some magic number equals money. But Twitch’s system is more like a weird puzzle where every piece affects every other piece.
The reality is that Twitch’s monetization system operates on multiple interconnected revenue streams that extend far beyond simple ad impressions. On Twitch, Affiliate and Partner streamers earn a share of ad revenue, typically ranging from 30% to 55%, with streamers starting at a 30% share and potentially increasing to 55% through the Ads Incentive Program by showing at least 3 minutes of ads per hour (Hexeum Twitch Money Calculator).
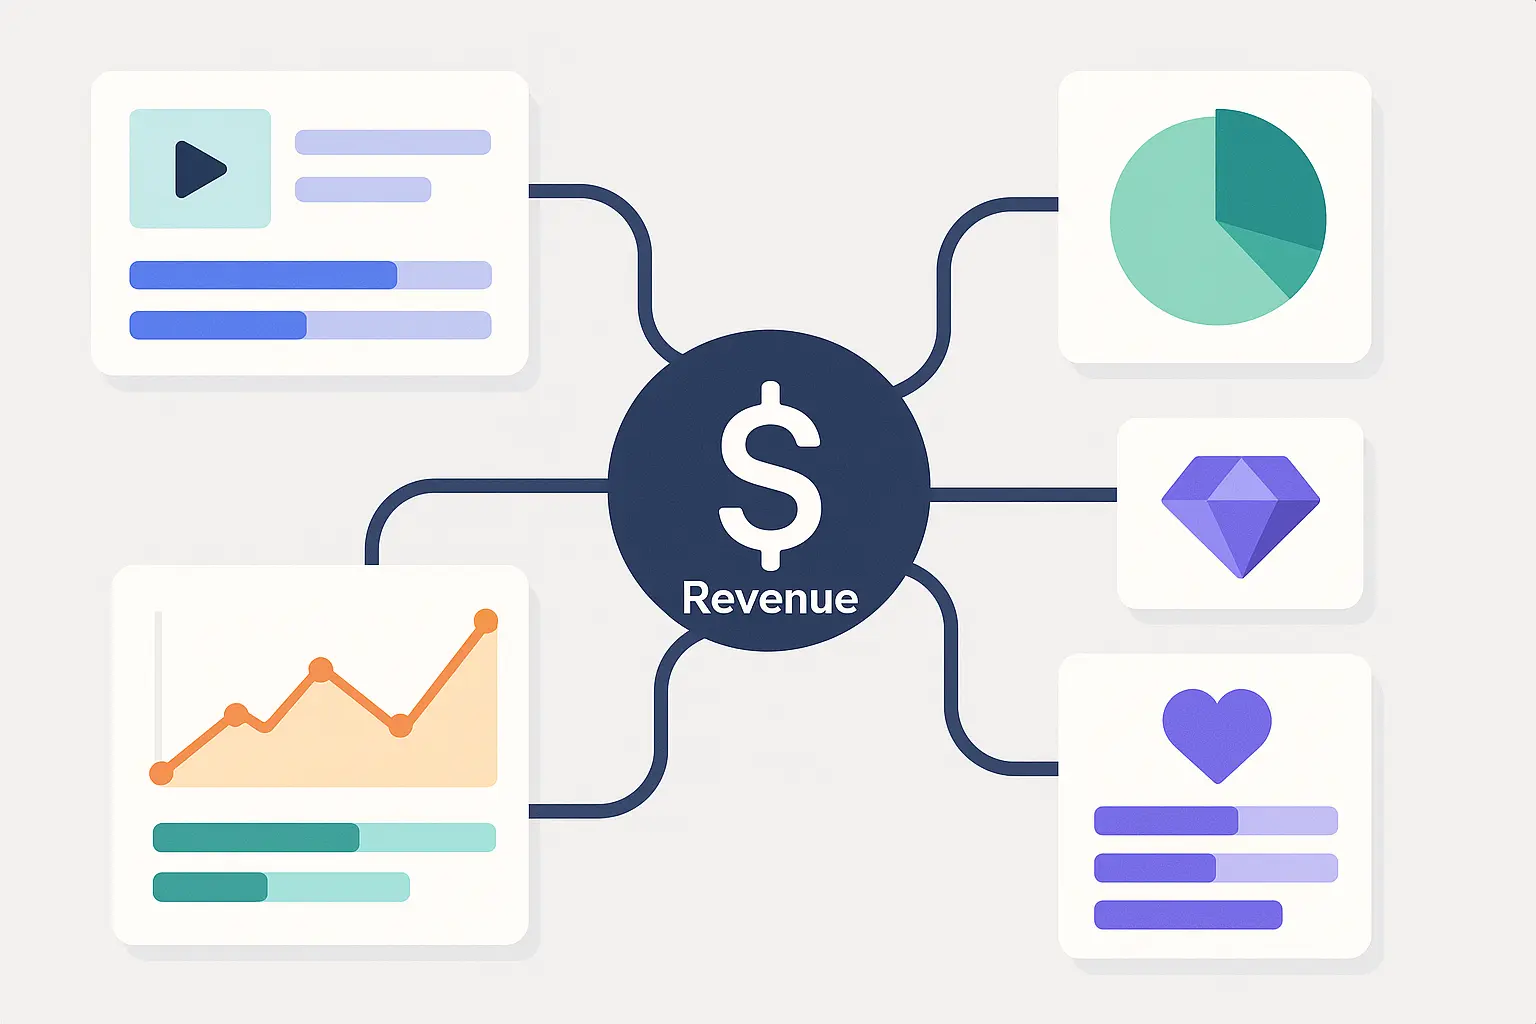
Here’s what nobody tells you when you start: your earnings depend on literally dozens of things working together. It’s not just about how many people watch you. It’s about where they’re watching from, how long they stick around during ads, what time you’re streaming, what games you’re playing, and a bunch of other stuff that basic calculators completely ignore.
I learned this the hard way when I switched from variety streaming to focusing on indie games. My viewer count stayed roughly the same, but my ad revenue dropped by 40%. Why? Because indie game viewers generate way lower CPM rates than people watching popular battle royales. Nobody’s calculator warned me about that.
Your partnership status changes everything too. When I finally hit Partner, it wasn’t just about the revenue split getting better – suddenly I had access to all these monetization features that Affiliates can’t use. But most calculators just ask “Partner or Affiliate?” like it’s a simple yes/no question.
The geographic thing still blows my mind. I have this friend who streams to mostly European viewers, and another who gets mainly Southeast Asian audience. Same viewer counts, same content quality, but the European streamer makes literally three times more from ads. It’s wild how much your audience location matters.
Just as comprehensive GA4 audits reveal hidden analytics insights, a proper revenue calculator must account for multiple data layers that basic tools ignore. Understanding how viewer engagement, partnership status, and geographic demographics all play crucial roles in determining actual earnings potential becomes essential for accurate revenue calculation.
Breaking Down the Core Revenue Streams
Ad Revenue: The Foundation That’s Trickier Than It Looks
Ad revenue is supposed to be the “easy” part to calculate, right? Just count your views and multiply by CPM. Except CPM isn’t some fixed number you can rely on.
I track my CPM obsessively now (learned that lesson), and it swings from $0.80 to $4.20 depending on the month. December? My CPM hits $3.50 because everyone’s advertising for holidays. February? I’m lucky to see $1.20 because nobody’s spending ad money after Christmas.
But here’s the thing that really messed me up early on – viewer retention during ads. I used to think if 1,000 people were watching when ads started, that’s 1,000 ad views. Nope. Half my audience would literally leave the stream when ads rolled. So I was getting paid for maybe 500 ad views, not 1,000.
I started experimenting with ad timing and frequency. Running more ads seems like it should equal more money, but I learned that if you annoy people too much, they just stop watching. I found my sweet spot is about 3 minutes of ads per hour, usually during natural breaks in gameplay.
Subscriptions: Your Most Predictable Income Stream
Subs are honestly the only income I can actually budget around. Everything else is too unpredictable, but subscription money hits your account pretty consistently.
Most people get the basic math wrong though. They see 100 subs and think “okay, that’s $500 a month.” But it’s not that simple. First, you’re only getting half (or 70% if you’re lucky enough to qualify for Partner Plus). Second, not everyone subscribes at Tier 1.
|
Subscription Type |
Typical Price |
Streamer Revenue (50/50 Split) |
Streamer Revenue (70/30 Split) |
|---|---|---|---|
|
Tier 1 |
$4.99 |
$2.50 |
$3.49 |
|
Tier 2 |
$9.99 |
$5.00 |
$7.00 |
|
Tier 3 |
$24.99 |
$12.50 |
$17.49 |
|
Prime Gaming |
Free to viewer |
$2.50 |
$2.50 |
I keep a spreadsheet now because I’m obsessive like that. Out of my 200 subs, about 180 are Tier 1, 15 are Tier 2, and 5 are Tier 3. That breakdown matters way more than just the total number. A streamer with 150 subs but 30 Tier 2s makes more than someone with 200 Tier 1s.
Prime Gaming subs are weird too. They’re “free” to viewers but you still get paid the same as a regular Tier 1. I get about 40% of my subs from Prime Gaming, which is pretty typical.
The renewal timing gets tricky around holidays. December is amazing because people gift subs like crazy, but January always hurts because people are broke after Christmas spending.
The streaming landscape is evolving rapidly. Twitch’s Partner Plus program now offers a 70/30 split for qualifying streamers who maintain 300+ recurring paid subscriptions for three consecutive months. This represents a significant shift from the traditional 50/50 split that most creators are accustomed to, but only 2.5% of partners actually qualify for this enhanced revenue share.
Donations and Bits: The Wild Cards in Your Revenue Mix
Donations are impossible to predict, and anyone who tells you otherwise is lying. I’ve had months where I made $50 in donations and months where I made $800. There’s no pattern I can figure out.
Bits are more consistent but still unpredictable. People use them for small interactions – cheering for good plays, celebrating with emotes, that kind of stuff. I usually see about $100-150 a month in Bits, but it varies based on how interactive my streams are.
Here’s something weird I noticed: emotional streams generate way more donations. When I was going through a rough patch and talked about it on stream, donations spiked. When I’m just casually gaming, barely anything. It’s like people donate when they feel connected to you personally.
One Bit equals one cent to you, but viewers pay more than that to purchase Bits initially. The psychology behind donations and Bits differs significantly. Donations often come during emotional moments or special events, while Bits get used more consistently for smaller interactions.
Consider a mid-tier streamer with 150 average viewers who streams 25 hours per week. Their monthly breakdown might look like: $300 from ad revenue (based on 2.5 million monthly impressions at $1.20 CPM), $750 from 150 Tier 1 subscriptions at 50/50 split, $200 in donations, and $100 from Bits. This totals $1,350 monthly, but each component fluctuates based on content, seasonality, and audience engagement patterns.
Advanced Metrics That Actually Matter for Your Bottom Line
Geographic and Demographic Weighting: Location Determines Your Paycheck
This is the big one that most people miss completely. Where your viewers live literally determines how much money you make, and it’s not even close.
I started tracking this obsessively after that indie game revenue drop I mentioned. Turns out, when I switched games, I didn’t just lose viewers – I lost my high-value viewers. The battle royale crowd has more disposable income and lives in countries where advertisers pay premium rates.
CPM rates vary dramatically by region. North American viewers might generate $3-5 CPM, while viewers from certain other regions might only generate $0.50-1.00 CPM. This isn’t a small difference – it can make or break your revenue projections.
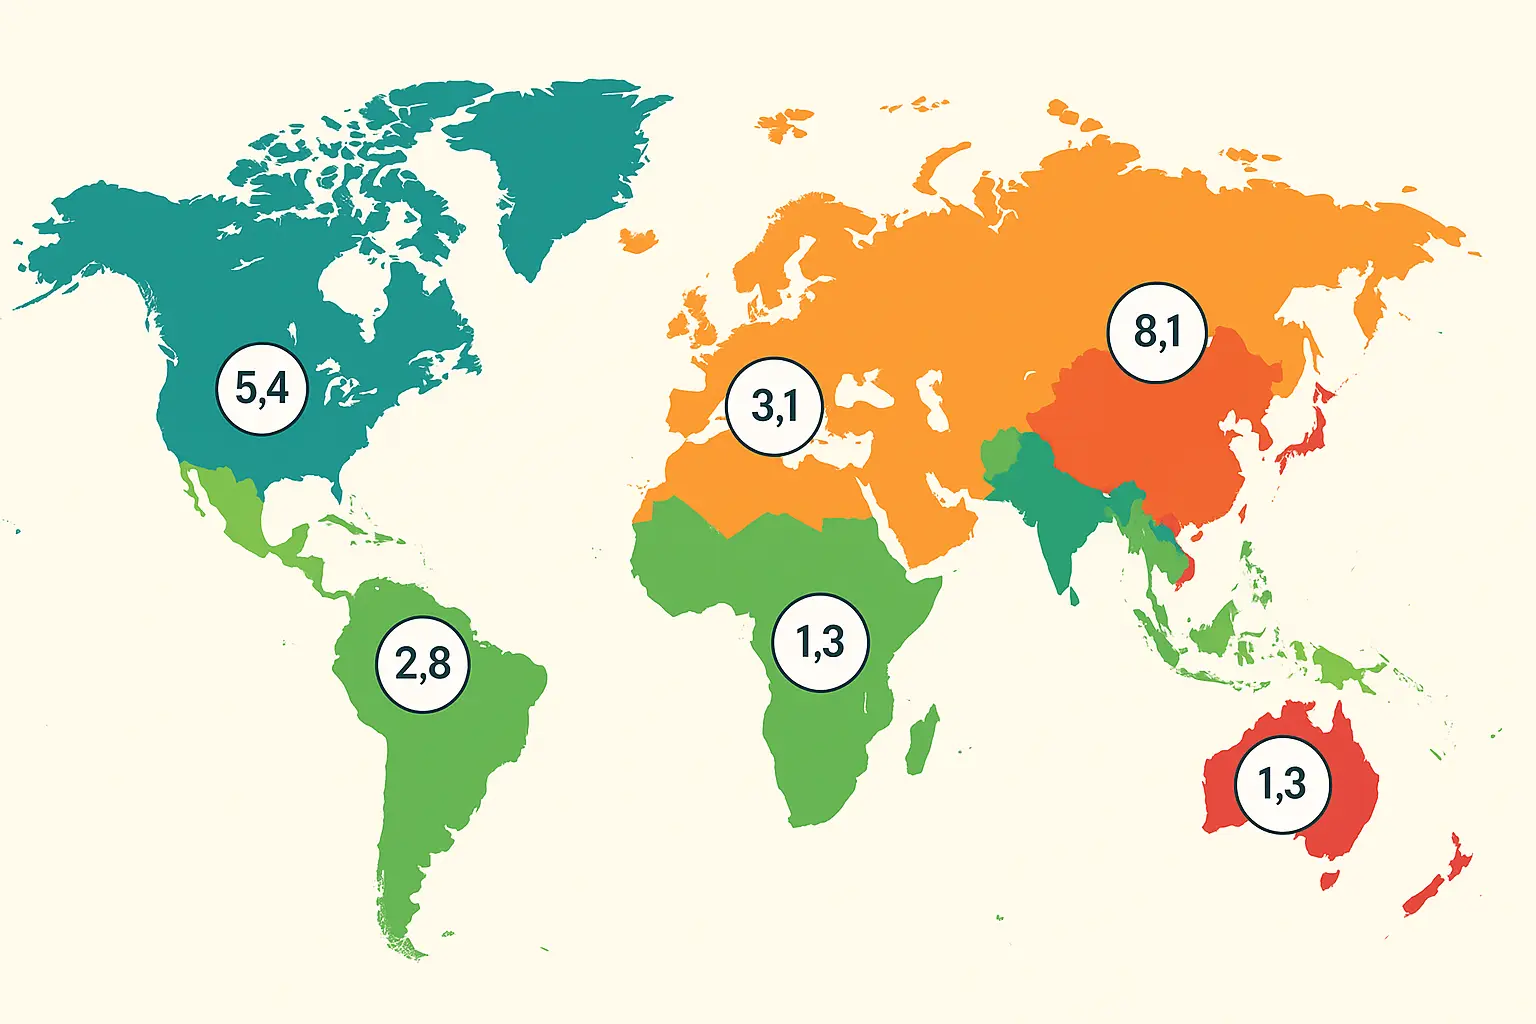
My friend streams at 3 AM my time to catch US prime time because that’s where the money is. Sounds crazy, but she makes 2x more per viewer than I do streaming during my local evening hours. US viewers are just worth more to advertisers.
I use StreamLabs to track viewer geography now. When I see my US/Canada percentage dropping, I know my next payout is going to be lower even if my viewer count stays the same.
Understanding your audience composition is as crucial as conducting a thorough market sizing analysis to identify the true revenue potential within your specific streaming niche.
Engagement Rates: Why Active Viewers Pay More Than Passive Ones
Engaged viewers are worth way more than passive ones, but most calculators treat all viewers the same. Big mistake.
I learned this when I started looking at my chat-to-viewer ratio. When I have 500 viewers but only 20 people chatting, my CPM sucks. When I have 300 viewers with 80 people actively chatting, my CPM is way higher. Advertisers can tell when people are actually paying attention.
Engagement is calculated by looking at the ratio of viewers to unique chatters, which streamers can find in their Twitch dashboard (Hexeum Twitch Money Calculator). Channels with active, participating chat communities typically see higher CPM rates because advertisers know these viewers are paying attention.
Poll participation is another good indicator. When I run polls during streams and get good response rates, my ad revenue for that stream is usually above average. It’s like Twitch knows when your audience is engaged and serves them better ads.
If your audience actually clicks and purchases products you recommend, brands will pay premium rates to advertise on your channel. Stream interaction levels include everything from poll participation to following your social media accounts.
Seasonal Trends and Content Category Impact
November and December are goldmines if you can capitalize on them. My CPM literally doubles during holiday season because everyone’s advertising. But January and February? Brutal. Everyone’s broke and advertisers pull back their spend.
Game choice matters more than I ever realized. When I played Fall Guys during its peak, my CPM was insane because advertisers wanted to reach that audience. When I switched to indie puzzle games, my revenue tanked even though I enjoyed the content more.
I keep a spreadsheet tracking my CPM by game now. Battle royales, popular multiplayer games, and new releases always perform better. Niche indie games, retro games, and creative content consistently underperform from an ad revenue perspective.
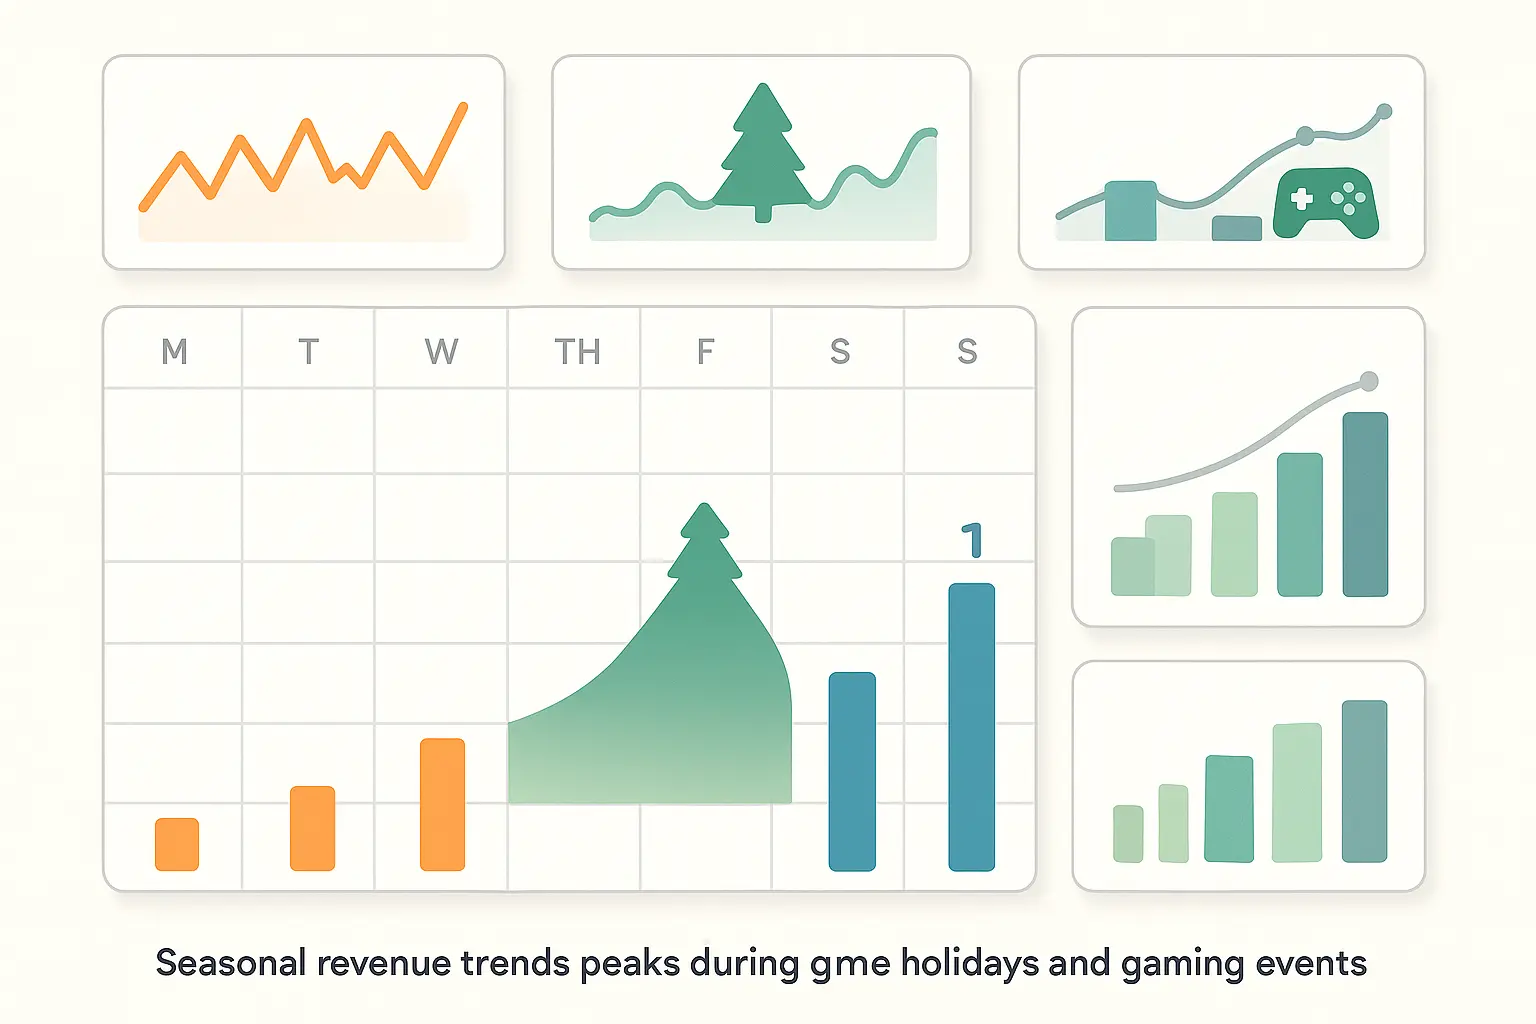
Trending games create temporary revenue spikes that can dramatically affect monthly earnings. Streaming a newly released popular game might double your CPM rates for a few weeks, then return to normal as the hype dies down.
Holiday and event-driven content also affects revenue calculations. Streaming during major gaming events, holidays, or cultural moments can boost earnings significantly, but these spikes shouldn’t be projected as sustainable long-term income.
Smart Strategies for Maximizing Your Revenue Potential
Data Collection: Building Your Revenue Intelligence System
I use way too many analytics tools now, but it’s worth it. Twitch Analytics gives you the basics, but you need more data to really understand what’s happening.
StreamLabs tracks my donations and follower patterns. Social Blade shows me how I compare to other streamers. I even use Google Analytics on my social media to see where my traffic comes from. It sounds like overkill, but this data helps me make better decisions.
I discovered through data that my Friday night streams generate 40% higher CPM than weekday streams, even with similar viewer counts. So now I save my best content and any sponsored segments for Fridays. That one insight increased my monthly ad revenue from $800 to $1,200 without streaming more hours.
Peak viewing times, content performance metrics, and viewer behavior patterns all influence your revenue potential. You can’t optimize what you don’t measure. Most successful streamers use 3-5 different analytics tools to get the complete picture.
Similar to how comprehensive SEO content tools provide multi-layered analytics insights, successful streamers need diverse data sources to understand their complete revenue picture.
Historical trend analysis helps identify patterns in your revenue generation. Maybe your earnings spike during certain games, or specific streaming times generate higher CPM rates. This data becomes invaluable for forecasting and optimization.
Revenue Forecasting and Goal Setting
I stopped setting vague goals like “I want to make more money” and started using my data to set realistic targets. If my CPM averages $2.50 and I’m getting 50,000 ad impressions per month, I know I should expect around $125 in ad revenue.
Growth projections help too. I’m gaining about 15 new subs per month consistently, so I can project where my subscription income will be in six months. It’s not exciting math, but it’s realistic math.
I also track which strategies actually work. Collaborating with other streamers costs time but usually results in measurable follower growth. Investing in better equipment shows up in viewer retention rates. Social media promotion drives traffic that I can track back to revenue increases.
Content strategy impact assessment shows how different choices affect your earning potential. Switching from variety streaming to focusing on a specific game, changing your streaming schedule, or adjusting your content format all impact revenue in measurable ways.
Strategic Business Intelligence Applications
Understanding where you rank within your niche helps calibrate revenue expectations and identify competitive advantages or gaps you need to address for growth. Should you specialize in a particular game or maintain variety content? Revenue calculators with market intelligence can help inform these strategic decisions.
Spending money on social media advertising, collaborating with other streamers, or investing in better equipment all have measurable impacts on revenue that smart calculators can track. Understanding which growth strategies actually pay off becomes crucial for long-term success.
Your Twitch earnings might be just one part of a broader content monetization approach that includes YouTube, TikTok, or other platforms. Understanding how these work together maximizes your total earning potential.
The competitive landscape is shifting dramatically as Influencer Marketing Hub reports that creators are no longer just comparing revenue splits but evaluating payout cadence, discovery algorithms, and layered monetization systems. YouTube’s 70/30 membership split combined with ad revenue and Shorts monetization is creating new benchmarks for what creators expect from streaming platforms.
Tax implications, business expense tracking, and investment decision support help you treat streaming as a legitimate business rather than just a hobby. This transforms calculators into comprehensive business tools.
Choosing the Right Calculator Tools for Accurate Projections
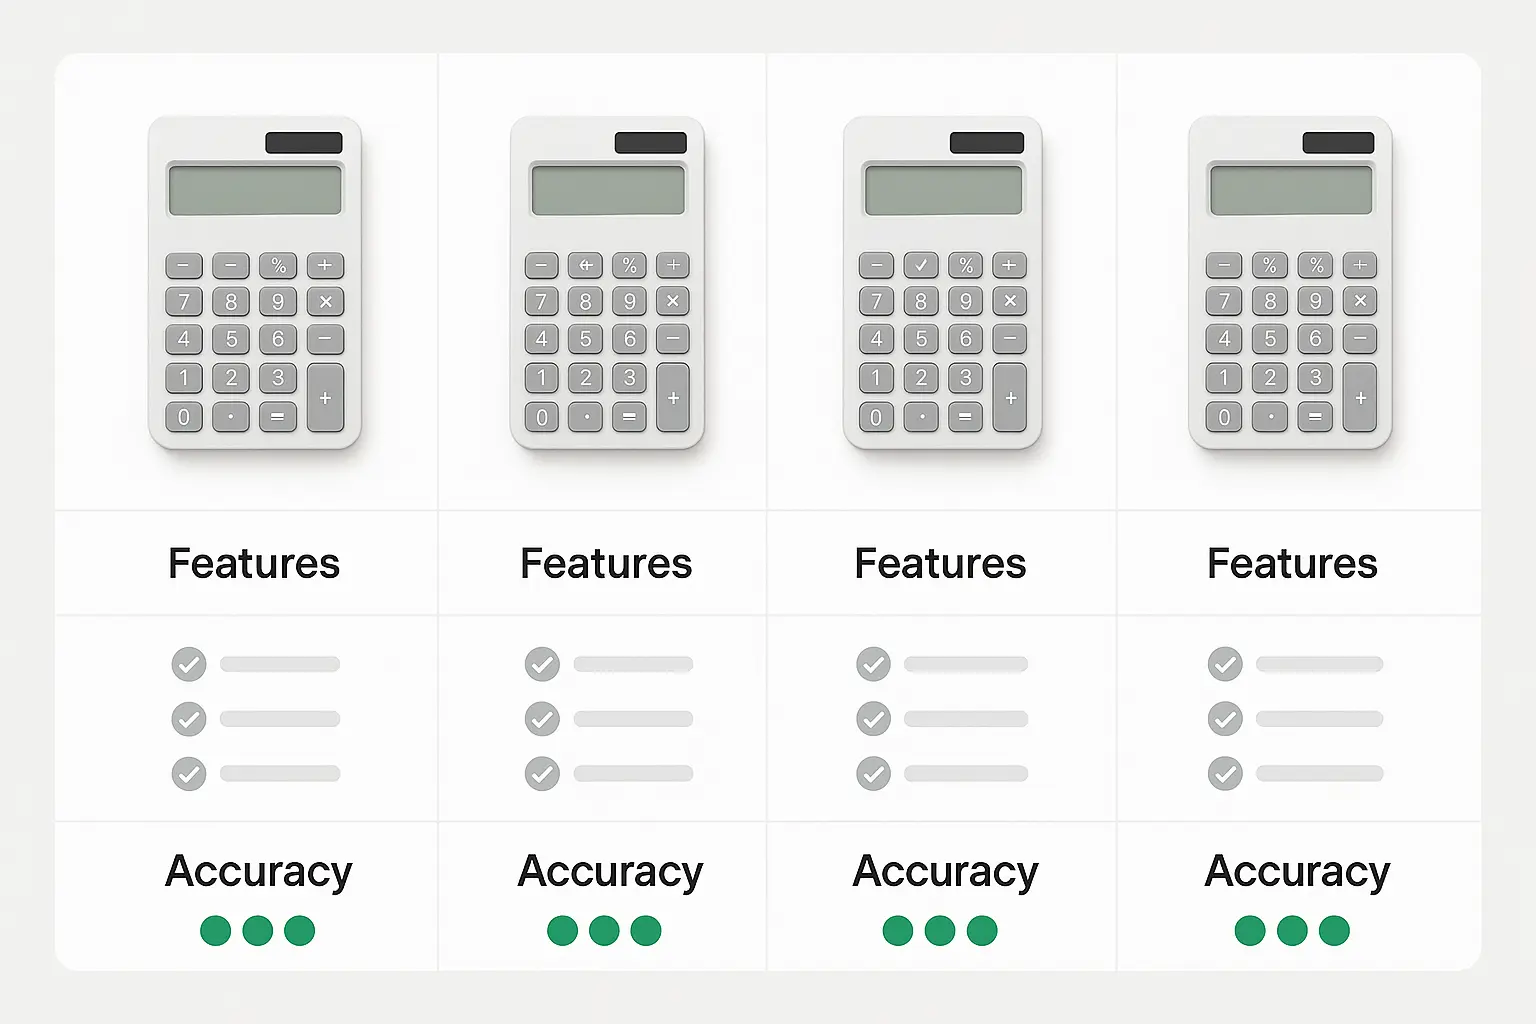
Popular Calculator Platforms and Their Real-World Performance
I’ve tried pretty much every calculator out there. The free ones like StreamScheme are fine for rough estimates, but they’re usually off by 30-40% when I compare to actual earnings.
I built my own Google Sheets calculator because I’m a data nerd, and it’s way more accurate. I input my actual CPM rates, geographic breakdown, and historical patterns. Takes more work to maintain, but it’s usually within 10% of my actual payouts.
The premium tools like Social Blade Pro are worth it if you’re treating this as a business. They connect to real-time data and adjust for things like seasonal trends and audience demographics. I pay $30/month for one, and it pays for itself by helping me optimize my revenue.
Just like choosing between Ahrefs vs SEMrush for SEO analytics, selecting the right revenue calculator depends on your specific needs and budget requirements.
|
Calculator Type |
Cost |
Accuracy Level |
Key Features |
Best For |
|---|---|---|---|---|
|
Basic (StreamScheme) |
Free |
60-70% |
Simple view×rate calculation |
Casual streamers |
|
Custom Spreadsheets |
Free (time investment) |
80-85% |
Personalized variables, historical tracking |
Data-savvy creators |
|
Premium API Tools |
$15-50/month |
90-95% |
Real-time data, demographic weighting |
Professional streamers |
|
All-in-One Platforms |
$25-100/month |
85-90% |
Business tools, tax integration |
Full-time creators |
The trade-off between free and paid calculators comes down to accuracy and features. Free tools work for basic estimates, but if you’re treating streaming as a business, investing in premium calculation tools pays for itself through better revenue optimization.
Accuracy Assessment and Validation Methods
I keep a spreadsheet comparing calculator predictions to actual earnings. Over six months, my custom calculator has been accurate within 15% consistently. The free tools were all over the place – sometimes 50% too high, sometimes 30% too low.
Cross-checking with multiple calculators helps spot problems. If one tool says I should make $1,000 and another says $500, something’s wrong with the assumptions. Usually it’s geographic weighting or partnership status not being calculated correctly.
If your calculator suggests CPM rates that are significantly higher or lower than industry averages for your niche, question its accuracy and methodology. Market rate benchmarking compares calculator outputs against known industry standards.
Testing calculator recommendations with real strategy changes provides the best validation. If a calculator suggests that changing your streaming schedule will increase revenue by 20%, test it and track the actual impact. This feedback loop improves your future projections.
A gaming streamer I know used three different calculators to project monthly earnings: a free tool estimated $600, a premium calculator projected $850, and their custom spreadsheet showed $780. After three months of actual data, their real earnings averaged $795, proving the premium calculator was most accurate but the custom spreadsheet provided the best cost-to-accuracy ratio for their needs.
Revenue Calculator Validation Checklist:
-
Compare predictions to actual earnings over 3+ months
-
Test multiple calculators and compare results
-
Verify CPM rates match industry benchmarks for your niche
-
Account for seasonal variations in projections
-
Include geographic audience weighting in calculations
-
Factor in your specific partnership status and splits
-
Test calculator recommendations with real strategy changes
How Professional Marketing Support Can Transform Your Earnings
Professional marketing support takes this way beyond what calculators can do. I work with a marketing agency now, and they’ve helped me understand attribution modeling – basically figuring out which of my growth efforts actually translate to revenue increases.
They helped me realize that my Twitter promotion drives viewers who convert to subs at 2x the rate of my TikTok traffic. That insight changed where I focus my social media efforts, and my subscription revenue increased 25% in three months.
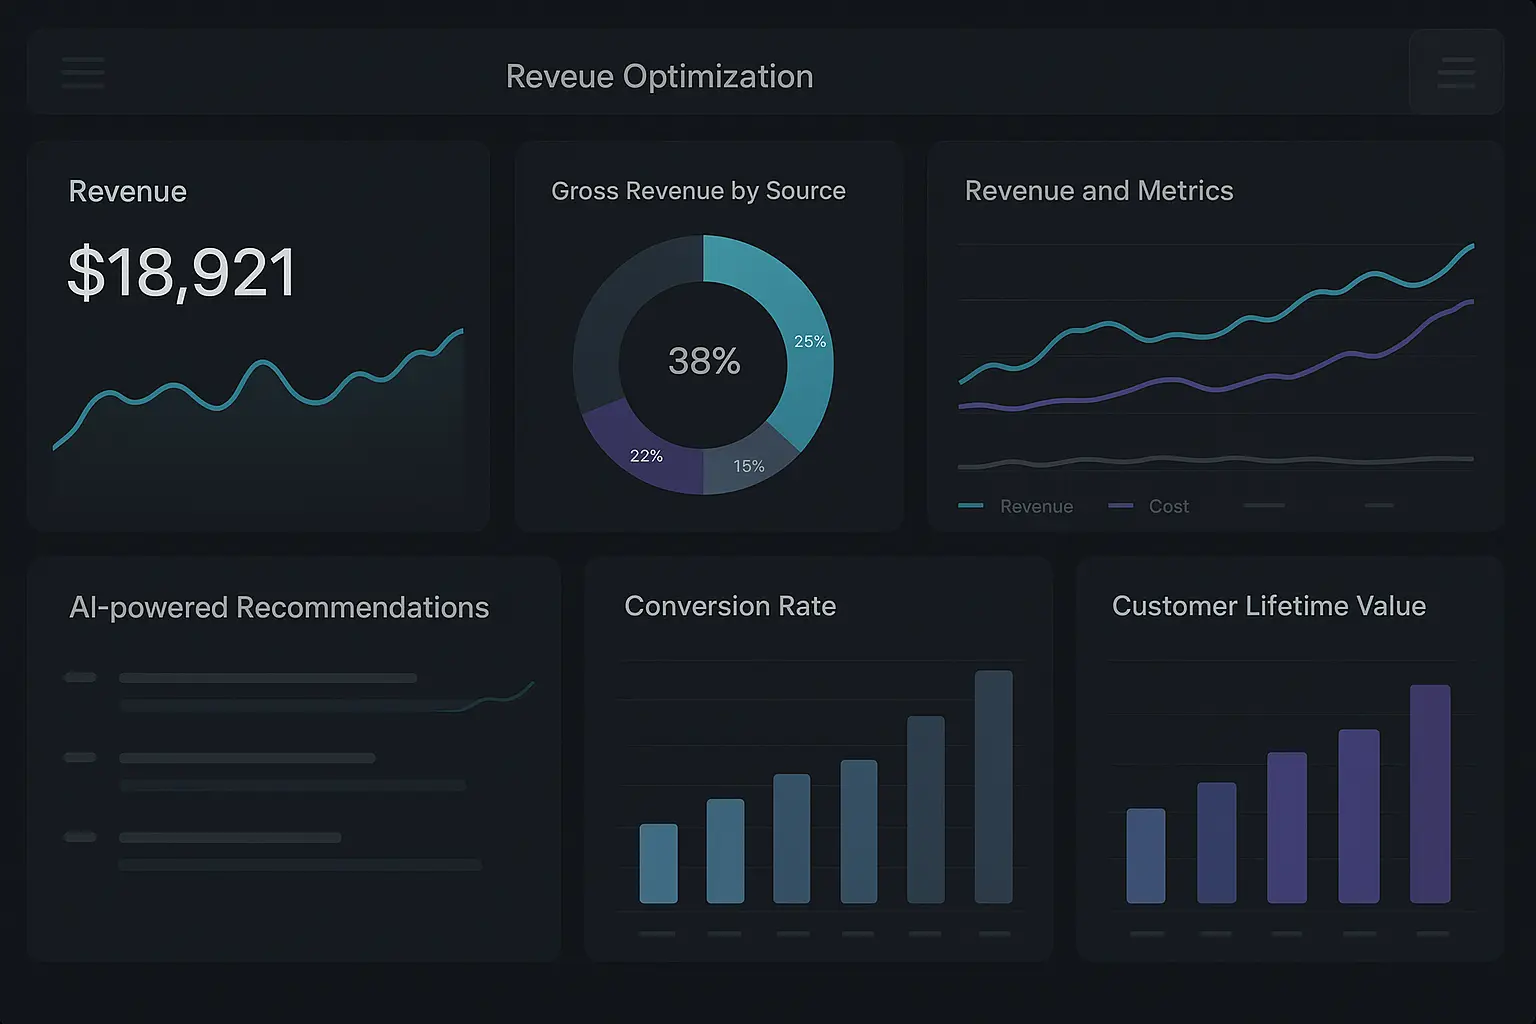
The Marketing Agency brings scientific methodology to Twitch revenue optimization that transforms guesswork into predictable business growth. Our AI-driven analytics systems integrate with your revenue data to provide real-time optimization recommendations that adapt to market changes and audience behavior patterns.
Our approach combines advanced AI-powered optimization tools with streaming-specific expertise to deliver measurable revenue improvements that go far beyond what standard calculators can provide.
The scientific approach makes a huge difference. Instead of guessing what might work, they use data to identify optimization opportunities I never would have found on my own. Attribution modeling becomes particularly valuable when you’re managing multiple revenue sources and marketing efforts.
Our transparent, metrics-based approach provides strategic oversight that extends far beyond basic revenue calculations. We help creators build sustainable, scalable income streams through comprehensive business intelligence and optimization strategies.
Ready to transform your Twitch revenue from unpredictable estimates into consistent business growth? Our team specializes in helping content creators maximize their earning potential through data-driven strategies and professional optimization techniques.

Final Thoughts
Here’s what I wish someone had told me when I started: treat revenue calculation like a business intelligence process, not a one-time estimate. Your earning potential changes constantly based on market conditions, audience growth, and content strategy.
Accurate Twitch revenue calculation requires understanding the complex interplay between multiple income streams, audience demographics, and market variables that basic calculators often miss. Your earning potential depends on far more than just view counts – geographic location of viewers, engagement rates, content category, and partnership status all significantly impact your actual revenue.
The most successful streamers I know don’t just use calculators – they understand the underlying mechanics of how Twitch monetization actually works. They track their data obsessively, test strategies systematically, and optimize based on real results rather than hopes and guesses.
Whether you use free tools or invest in premium calculators, the key is understanding their limitations and building your own data collection system. Your revenue optimization should evolve as your channel grows, always focusing on sustainable long-term growth rather than short-term spikes that don’t last.
The math matters, but the strategy behind the math matters more. Focus on building an engaged audience in valuable demographics, optimize your content for both entertainment and monetization, and use data to make decisions rather than gut feelings. That’s how you turn unpredictable income into a sustainable business.
