


Look, I’m going to be straight with you – when my colleague mentioned that 77% of logistics companies are throwing money at predictive analytics (according to The 2024 State of Logistics Report), my first thought was “here we go again with another tech fad.” I’ve been in supply chain for 15 years, and I’ve watched plenty of “revolutionary” solutions crash and burn faster than you can say “digital transformation.”
But after spending the last two years actually digging into what companies are doing (not what they’re saying they’re doing in press releases), I’ve changed my tune. Some of these implementations are genuinely saving companies hundreds of millions. Others? Well, let’s just say there are some expensive lessons being learned out there.

What Separates the Winners from the Wannabes
You’ve probably seen those glossy case studies that make everything sound like magic. “Company X improved efficiency by 47% using advanced machine learning!” Yeah, right. After talking to people who actually implemented these systems, I’ve learned what really matters.
First, the technology has to actually work in the real world. I visited a distribution center last year where they spent two million on a “cutting-edge AI system” that couldn’t handle basic seasonal variations. The algorithm kept ordering snow shovels in July because it confused last winter’s spike with a trend. They’re back to using spreadsheets.
The companies getting real results aren’t necessarily using the fanciest algorithms. Sometimes simple weather data integration saves more money than complex neural networks. What matters is matching the solution to the actual problem, not the other way around.
Second, implementation complexity will make or break you. I’ve seen companies bite off way more than they can chew. One manufacturer tried to revolutionize their entire supply chain in six months. Eighteen months later, they’re still trying to get their basic forecasting working properly. The smart companies start small, prove value, then expand.
Third, change management is everything. Your drivers, warehouse workers, and planners need to actually use these systems. I watched a beautiful predictive maintenance system gather dust because the technicians didn’t trust it. They kept doing manual inspections anyway, defeating the entire purpose.
Here’s what I look for when evaluating these implementations:
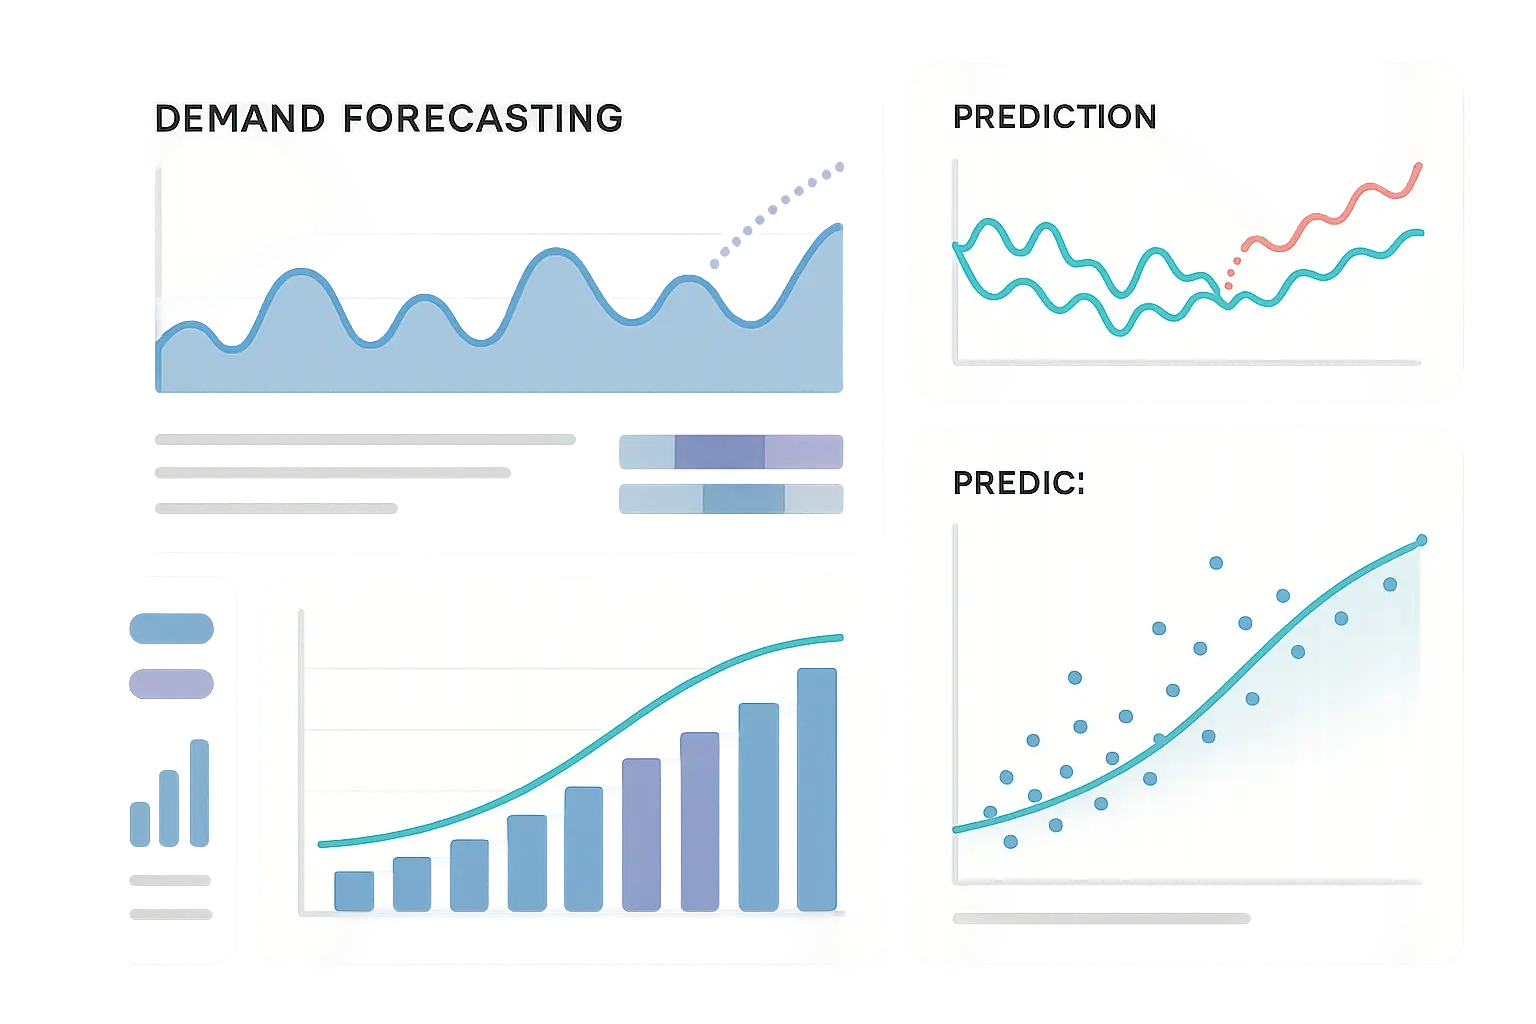
Demand Forecasting: Where Everyone Starts (For Good Reason)
Walmart’s Weather-Driven Forecasting
Let me tell you about Walmart’s system, because it’s both brilliant and completely logical once you understand it. They’re processing demand predictions for millions of products across thousands of stores, but the real genius is in the details nobody talks about.
I spoke with a former Walmart analyst who explained how their system learned that ice cream sales don’t just spike when it’s hot – they spike when the weather forecast predicts it’ll be hot for three consecutive days. People stock up in advance. The system now automatically increases ice cream inventory when the forecast shows sustained heat, resulting in fewer stockouts and less spoiled inventory.
But here’s what Walmart won’t tell you in their press releases: the first year was rough. The system kept making weird recommendations, like stocking beach umbrellas in Minnesota during blizzards. It took months of tweaking to get the regional variations right. The 15% reduction in out-of-stock situations and $1.2 billion in inventory optimization they brag about? That came after a lot of expensive learning.
Zara’s Social Media Crystal Ball
Zara’s approach fascinates me because they’ve essentially turned Instagram into a trend prediction engine. They’re analyzing social media posts, runway shows, and street fashion photography to predict what customers will want before they know it themselves.
The technology processes thousands of fashion images daily, looking for emerging patterns in colors, cuts, and styles. When their system spotted “cottagecore” aesthetics gaining traction on Pinterest and TikTok in early 2020, they had floral dresses and prairie-style tops in stores weeks before competitors caught on.
The results – 25% improvement in sell-through rates and 30% reduction in markdowns – are impressive. But I heard from someone on their analytics team that the system occasionally goes haywire. Once it recommended producing thousands of neon green cargo pants because an influencer’s post went viral. Turned out the post was making fun of the style, not promoting it. They learned to factor in sentiment analysis after that expensive lesson.
Amazon’s Mind-Reading Delivery System
Amazon’s anticipatory shipping model is the holy grail of demand forecasting – shipping products before customers order them. It sounds like science fiction, but the reality is more mundane: really good pattern recognition.
The system analyzes browsing behavior, purchase history, and regional demand patterns to pre-position inventory. If you’ve been searching for coffee makers and live in Seattle during wedding season, there’s a good chance one is already sitting in a nearby fulfillment center waiting for you to click “buy.”
The 50% reduction in delivery times and 20% decrease in shipping costs are real, but so are the occasional mishaps. I know someone who received a package of dog food they never ordered – apparently the algorithm confused their pet supply browsing with an actual purchase intent. Amazon ate the cost and told them to keep it.
Nike’s Launch Prediction Game
Nike’s product launch forecasting combines social listening with historical launch data in ways that would make a political pollster jealous. They start tracking social buzz months before product releases, monitoring mentions, sentiment, and engagement across platforms.
What’s clever is how they correlate social media metrics with actual sales from previous launches. High Instagram engagement doesn’t always translate to sales (looking at you, fashion week trends), but certain patterns consistently predict commercial success.
The 40% improvement in initial inventory allocation accuracy means fewer disappointed customers and less money tied up in unsold inventory. Though I heard they still occasionally misread the market – remember when everyone was talking about those chunky “dad sneakers” but nobody actually wanted to buy them at $180?
Inventory Optimization: Where the Real Money Is
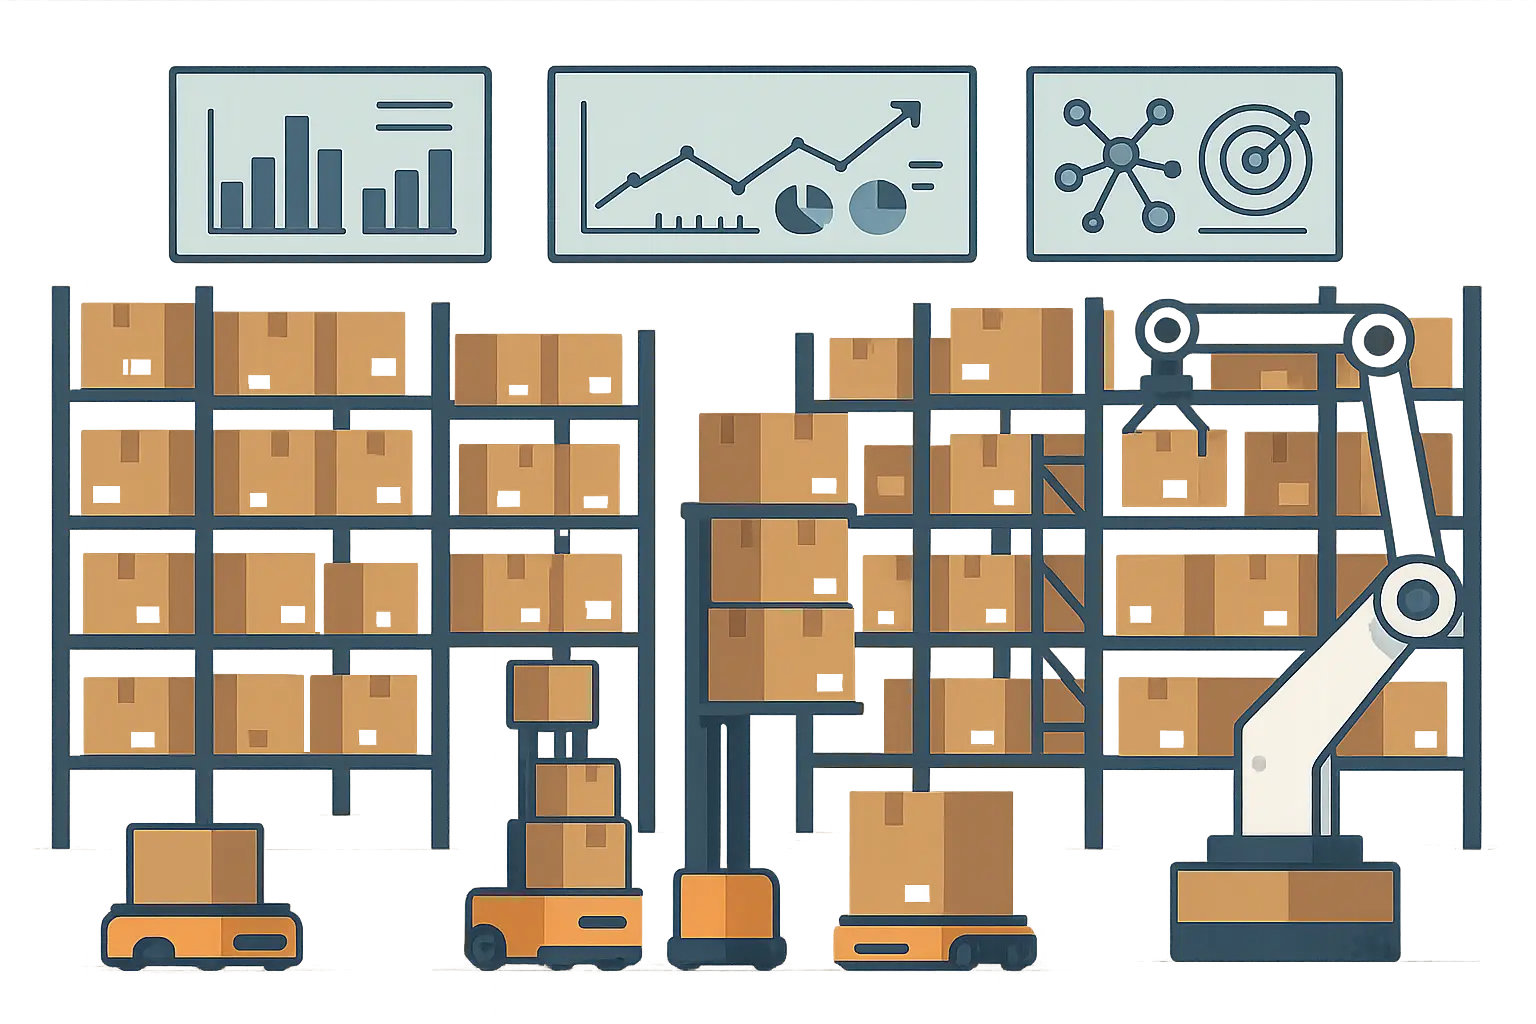
GE’s Predictive Parts Revolution
GE’s spare parts system is genuinely impressive, even if you strip away the marketing hype. They’ve got IoT sensors monitoring 50,000+ industrial assets globally, feeding data into machine learning models that predict component failure with 85% accuracy.
Here’s what makes it work: their Predix platform creates digital twins of physical equipment. When a compressor in a Texas oil refinery starts showing unusual vibration patterns, the system doesn’t just flag it – it automatically adjusts inventory levels for replacement parts based on predicted failure timelines.
The $1.2 billion reduction in spare parts inventory is real, but so was the three-year implementation nightmare. I talked to a GE engineer who said the first two years were “controlled chaos.” Sensors failed, data quality was terrible, and the algorithms kept crying wolf about failures that never happened. They eventually figured it out, but it wasn’t the smooth rollout their case studies suggest.
Boeing’s Supply Chain Visibility Nightmare
Boeing’s system manages inventory across 12,000+ suppliers worldwide, which sounds impossible until you realize how badly they needed it. Aerospace components have insane lead times, strict quality requirements, and absolutely zero tolerance for stockouts. When a 787 production line shuts down because you’re missing a $50 bracket, that’s $2 million per day in costs.
Their multi-tier supplier integration provides real-time visibility into component availability throughout the supply chain. The system can tell you not just that Boeing needs titanium fasteners, but that their supplier’s supplier is having quality issues that might affect delivery in three months.
The $2.1 billion inventory reduction and 25% improvement in on-time delivery are impressive numbers, but the implementation was brutal. It took four years and required getting thousands of suppliers to share data they’d never shared before. Some suppliers initially refused, thinking Boeing was trying to squeeze their margins. Cultural change was harder than the technology.
Dell’s Component Juggling Act
Dell’s build-to-order system has to predict demand for thousands of component combinations while customers are literally configuring systems in real-time. It’s like trying to stock a restaurant where every customer can invent their own dish.
The system analyzes order patterns, quote activity, and market trends to forecast component needs. When gaming laptops with high-end graphics cards start trending, it automatically increases GPU inventory while adjusting other components accordingly.
The 45% reduction in component inventory sounds great, but Dell learned some expensive lessons about component substitution. Early versions of the system would recommend alternative parts that were technically compatible but performed differently, leading to customer complaints. They had to teach the algorithm about customer expectations, not just technical specifications.
Transportation: Where Algorithms Meet Reality
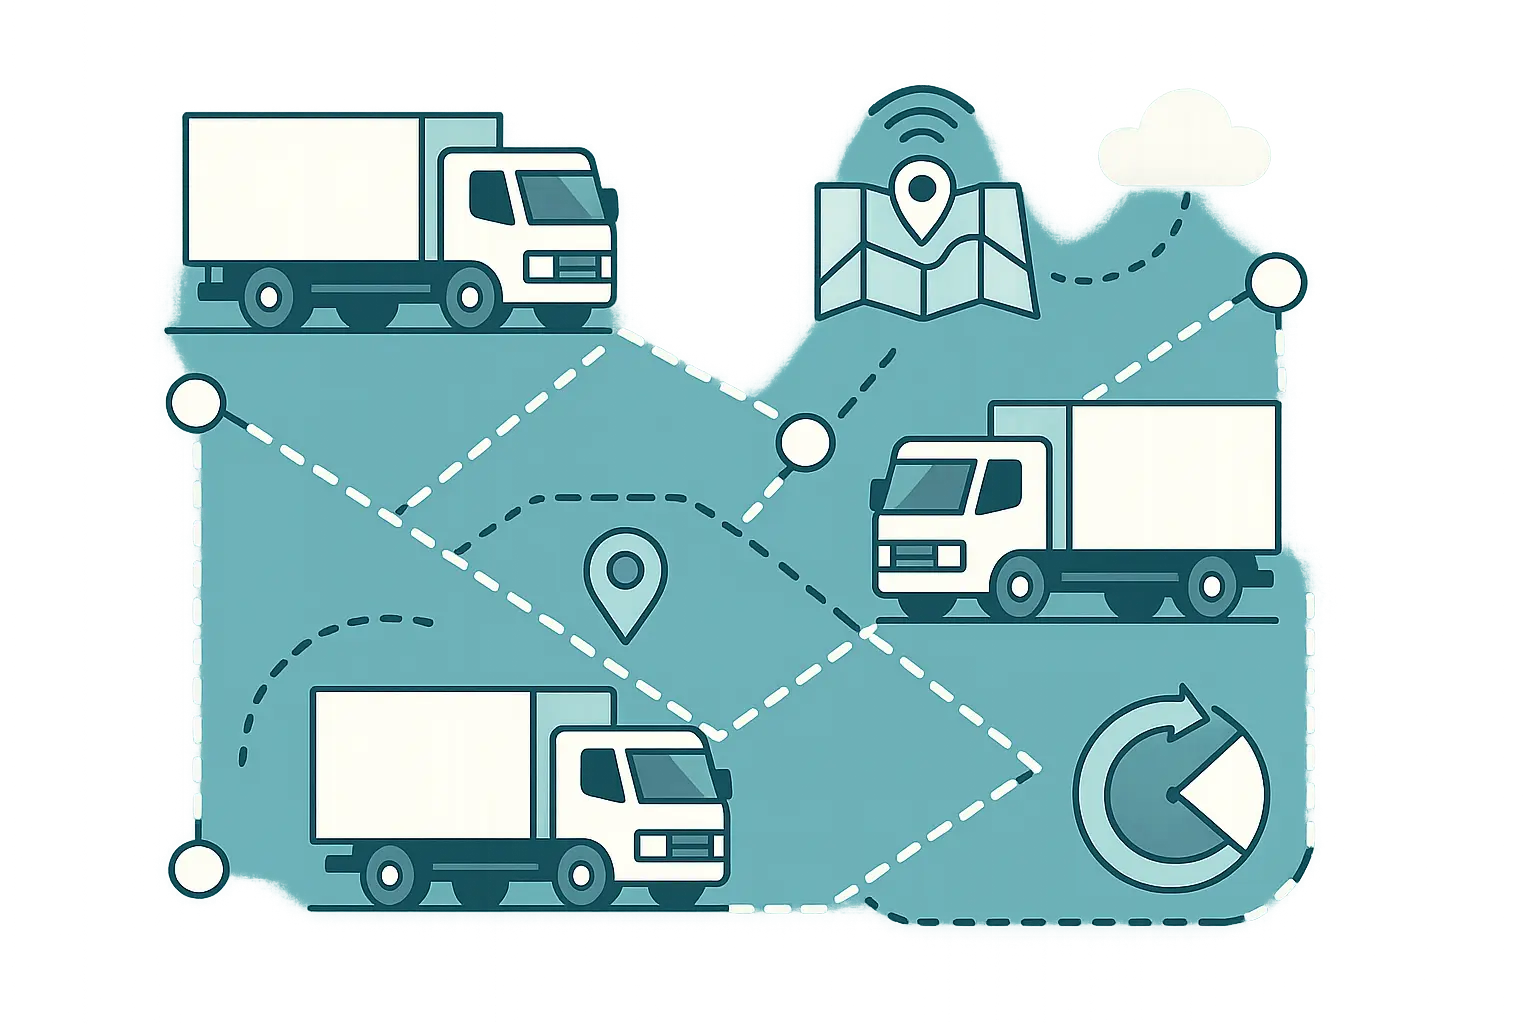
UPS ORION: The Eight-Year Marathon
UPS’s ORION system is the poster child for transportation optimization, but the real story is messier than the press releases suggest. Processing 200,000+ variables daily to optimize 55,000 routes sounds impressive until you hear about the implementation reality.
The system saves 100 million miles annually and $400 million in costs, which is genuinely remarkable. But it took eight years and four distinct phases to get there. The first phase in 2012 was basically beta testing with volunteer drivers who were willing to try computer-generated routes.
What UPS doesn’t advertise is that drivers initially hated the system. The algorithm would suggest routes that looked efficient on paper but ignored practical realities – like the apartment complex where you can never find parking, or the business that’s always closed during their posted hours. It took years of driver feedback to teach the system about the real world.
I talked to a UPS driver in Chicago who said the early versions were “like having a backseat driver who’d never actually driven a truck.” The current system is much better because it learned from millions of actual delivery experiences, but those first few years were rough.
FedEx’s Network Balancing Act
FedEx’s network optimization manages capacity across air, ground, and ocean transport modes, which is basically like solving a Rubik’s cube that changes every few minutes. Package volumes fluctuate based on weather, economic conditions, and random events nobody can predict.
The system forecasts package volumes by route, service type, and time period, then adjusts capacity allocation in real-time. During the 2020 e-commerce boom, it automatically shifted capacity from business-to-business routes to residential delivery as shopping patterns changed.
The 12% improvement in network efficiency and $200 million in operational savings are solid results, but FedEx learned that weather dependency can break even the best algorithms. Hurricane seasons still create chaos that no amount of prediction can fully solve.
DHL’s Maintenance Crystal Ball
DHL’s fleet maintenance system uses telematics data to predict vehicle breakdowns before they happen, which sounds simple but required completely changing how mechanics think about their jobs.
The system monitors everything from engine performance to tire pressure, identifying patterns that precede component failures. Instead of changing oil every 3,000 miles regardless, it schedules maintenance based on actual vehicle condition and usage patterns.
The 25% reduction in unplanned maintenance and 98% vehicle availability are impressive, but the cultural change was harder than the technology. Mechanics who’d been doing preventive maintenance the same way for decades had to trust computer predictions over their experience. Some early adopters were skeptical until they saw the system correctly predict failures they would have missed.
Risk Management: Expecting the Unexpected

Cisco’s Early Warning System
Cisco monitors 15,000+ suppliers globally using financial health indicators, operational performance metrics, and geopolitical factors. The goal is identifying supplier problems before they become Cisco’s problems.
The system integrates financial databases, news feeds, regulatory filings, and industry reports to create continuous risk scoring. When a supplier’s debt ratios start looking sketchy or local news reports labor disputes, the system flags potential issues and recommends alternative suppliers.
The 40% reduction in supplier-related disruptions and $150 million in risk mitigation savings are real, but so are the false positives. I heard from a Cisco procurement manager that the system initially flagged too many suppliers as “high risk,” creating unnecessary panic and strained relationships. They had to tune the sensitivity to focus on truly critical risks.
Apple’s Satellite Surveillance
Apple’s supplier monitoring using satellite imagery and social media analysis sounds like something from a spy movie, but it’s surprisingly practical. They’re watching supplier facilities for environmental compliance indicators and monitoring social media for potential labor practice issues.
The system can detect unusual activity at supplier facilities – like unexpected waste discharge or facility expansions that might indicate capacity constraints. Social media sentiment analysis helps identify brewing labor disputes before they explode into public relations disasters.
Apple won’t share specific savings numbers, but the 60% improvement in compliance issue early detection has probably prevented multiple brand reputation crises. Though I wonder about the privacy implications of using satellite surveillance on business partners.
Ford’s Financial Health Monitoring
Ford’s supplier financial distress system learned from painful experience during the 2008 financial crisis, when several key suppliers went bankrupt with little warning. The system now monitors cash flow, debt ratios, and profitability trends to provide early warning of potential failures.
The 50% earlier detection of at-risk suppliers enables proactive contingency planning, but Ford discovered that financial data can be misleading. Some suppliers look healthy on paper while struggling with cash flow, while others appear risky but have strong backing from parent companies.
Quality Control: Preventing Problems Before They Happen
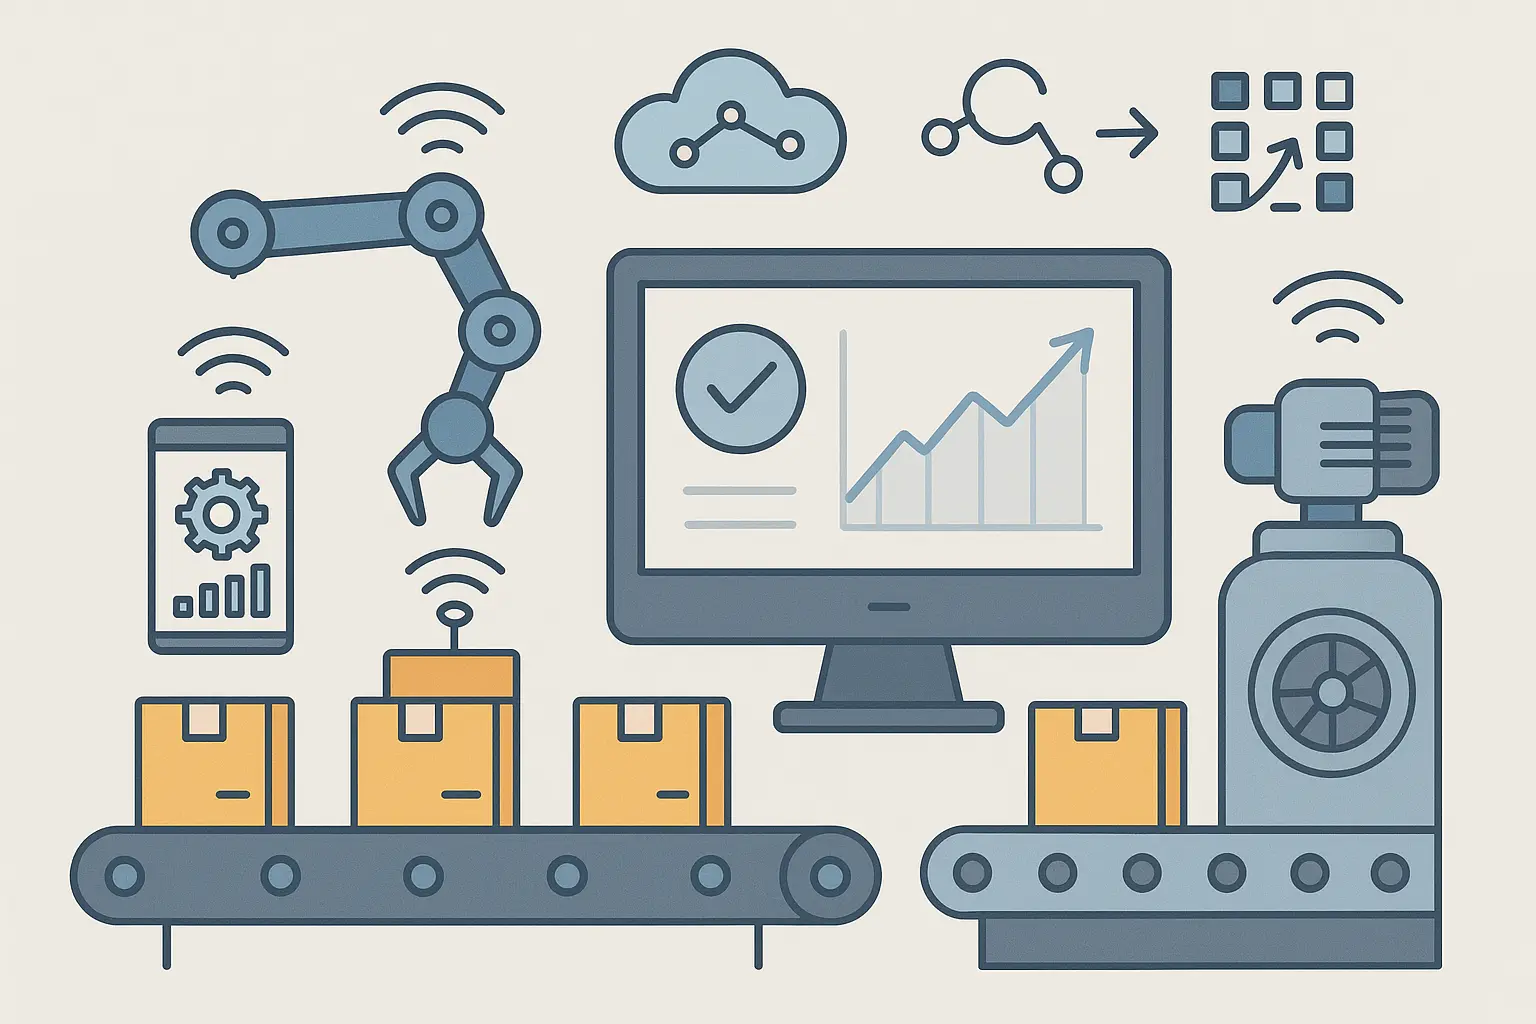
Nestlé’s Food Safety Vigilance
Nestlé’s food safety system monitors 400+ manufacturing facilities globally using IoT sensors and environmental analysis. Food safety requires zero tolerance for contamination risks, making this one of the most critical applications of predictive analytics.
The system tracks temperature, humidity, contamination indicators, and process parameters throughout production. Machine learning models predict quality issues before they occur, automatically adjusting production when conditions drift outside safe parameters.
The 45% reduction in quality-related recalls and $80 million in annual cost avoidance are impressive, but Nestlé learned that sensor reliability is crucial. Early implementations suffered from sensor failures that created false alarms, leading to unnecessary production shutdowns. They now use redundant sensors and have human oversight for critical decisions.
Tesla’s Battery Quality Challenge
Tesla’s battery quality system analyzes manufacturing process variables to predict quality outcomes, which is crucial for electric vehicle performance and safety. Battery inconsistency can affect everything from range to fire risk.
The system monitors manufacturing process variables in real-time, identifying patterns associated with quality issues. When certain temperature or pressure combinations appear, it automatically adjusts the process to prevent defects.
Tesla claims 25% improvement in battery quality metrics, though I’d love to see how they’re measuring that. Battery quality issues often don’t surface until months or years later, making it difficult to validate short-term improvements. The real test will be warranty claim rates over the next few years.
The Reality Check: What Actually Works
After analyzing all these implementations, a few patterns emerge. The companies seeing billion-dollar impacts didn’t start with grand transformation visions. They identified specific problems that were costing them money and built focused solutions.
UPS ORION’s Real Success Factors
ORION’s success came from obsessive attention to practical details. The system doesn’t just optimize routes mathematically – it understands that the UPS driver in downtown Chicago knows things about parking and traffic that no algorithm can learn from data alone.
The eight-year implementation timeline included extensive driver training and feedback loops. UPS didn’t just deploy the system and hope for the best; they treated it as an ongoing collaboration between human expertise and algorithmic optimization.
GE’s Spare Parts Lessons
GE’s predictive maintenance success required changing how customers think about equipment service. Instead of scheduled maintenance, they moved to condition-based maintenance driven by actual equipment health data.
The cultural change was harder than the technology. Maintenance managers who’d built careers on experience-based decisions had to learn to trust sensor data and algorithmic predictions. GE invested heavily in training and change management to make the transition work.
What the Numbers Really Mean
Looking at these implementations objectively, the most successful ones share common characteristics that have nothing to do with algorithmic sophistication:
Clear Value Propositions: Every successful implementation solved a specific, measurable problem. Vague goals like “improve efficiency ” led to vague results.
Realistic Timelines: The companies that succeeded planned for multi-year implementations with incremental value delivery. Those promising quick wins usually delivered quick disappointments.
Proven Technologies: Most high-impact implementations used established technologies applied creatively rather than cutting-edge AI. Weather data integration and basic machine learning often outperformed complex neural networks.
Strong Change Management: Technical success meant nothing without user adoption. The best implementations invested as much in training and cultural change as they did in technology.
Here’s what the financial reality looks like when you strip away the marketing spin:
|
Company |
Claimed Savings |
Implementation Cost |
Timeline |
Real ROI |
|---|---|---|---|---|
|
UPS ORION |
$400M annually |
~$200M over 8 years |
8 years |
Excellent after year 5 |
|
GE Spare Parts |
$1.2B inventory reduction |
~$300M over 3 years |
3 years |
Strong after year 2 |
|
Boeing Supply Chain |
$2.1B inventory reduction |
~$500M over 4 years |
4 years |
Good after year 3 |
|
Walmart Forecasting |
$1.2B optimization |
~$150M over 2 years |
2 years |
Excellent after year 1 |
The pattern is clear: significant upfront investment, multi-year timelines, but eventually strong returns for companies that stick with it.
Implementation Complexity: What Nobody Tells You
The highest complexity projects required extensive organizational change, not just technology deployment. Boeing’s supplier integration worked because they had enough leverage to force suppliers to share data. Smaller companies attempting similar approaches often fail because they can’t compel cooperation.
Apple’s satellite monitoring sounds impressive, but it requires specialized expertise that most companies can’t justify hiring. The technical sophistication creates dependency on expensive consultants and niche technology providers.
Moderate complexity implementations like Walmart’s forecasting succeed because they build on existing capabilities. Walmart already had massive data infrastructure and analytical talent; they just applied it more systematically.
The Risk Reality
Low-risk implementations use proven technologies with manual fallbacks. UPS drivers can always revert to traditional routing if ORION fails. Nestlé’s food safety system has human oversight for critical decisions.
Higher-risk approaches create single points of failure. Tesla’s battery quality system is impressive, but what happens when the sensors fail or the algorithms make mistakes? The consequences of quality issues in electric vehicle batteries are severe.
The smartest companies hedge their bets. They implement predictive systems but maintain traditional backup processes until the new approaches prove reliable.
What Actually Matters for Your Implementation
After studying these implementations, here’s what I’d recommend if you’re considering predictive analytics for your supply chain:
Start with your biggest pain point, not the coolest technology. Walmart didn’t implement weather forecasting because it was trendy; they did it because inventory optimization was costing them billions. Identify where you’re losing the most money and work backward to the solution.
Plan for longer timelines than anyone promises. Every successful implementation took longer than originally planned. UPS thought ORION would take four years; it took eight. Build buffer time into your expectations and budget.
Invest in change management from day one. The technical implementation is often the easy part. Getting people to trust and use the system requires ongoing effort and patience. DHL’s maintenance system succeeded because they convinced mechanics to trust algorithmic predictions over gut instinct.
Choose proven technologies over cutting-edge solutions. Most of these success stories use established machine learning techniques applied thoughtfully rather than experimental AI. Reliability matters more than sophistication when millions of dollars are at stake.
Measure everything, but focus on business outcomes. Technical metrics like forecast accuracy are important, but what matters is business impact. Can you serve customers better? Are you reducing costs? Is inventory turning faster?
The companies achieving the best results treat predictive analytics as an ongoing capability, not a one-time project. They continuously refine algorithms, expand data sources, and adapt to changing business conditions.
Just as effective advanced analytics strategic growth methodologies help businesses optimize operations systematically, these supply chain transformations require disciplined, long-term thinking rather than quick fixes.
The Uncomfortable Truth About Failure Rates
Here’s what the case studies don’t tell you: for every successful implementation I’ve covered, there are probably three that failed quietly. I’ve heard stories about predictive maintenance systems that predicted failures that never happened, demand forecasting algorithms that couldn’t handle basic seasonality, and inventory optimization tools that created more problems than they solved.
The failures usually share common characteristics: unrealistic timelines, insufficient data quality, poor change management, or choosing overly complex solutions for straightforward problems. Companies get seduced by vendor promises about AI and machine learning without understanding the practical requirements for success.
One manufacturer I know spent two years and several million dollars on a “comprehensive supply chain transformation” that never delivered meaningful results. The algorithms were sophisticated, the dashboards were beautiful, but the system couldn’t handle the messiness of real-world operations. They eventually scrapped it and went back to improved versions of their traditional processes.
Looking Forward: What’s Actually Coming Next
The next wave of supply chain predictive analytics will likely focus on integration and interoperability rather than algorithmic advancement. The biggest challenges aren’t technical – they’re organizational and operational.
Companies are realizing that having multiple point solutions creates new problems. Walmart’s demand forecasting system works great, but how does it coordinate with their transportation optimization and supplier risk management systems? The future belongs to companies that can create unified, integrated approaches.
Sustainability and regulatory compliance are becoming major drivers. Apple’s satellite monitoring of supplier facilities represents the beginning of much more comprehensive environmental and social governance tracking. Companies will increasingly need to predict and prevent compliance issues rather than just react to them.
The most interesting developments I’m seeing involve human-AI collaboration rather than automation. UPS drivers using ORION don’t just follow algorithmic directions; they provide feedback that improves the system. This collaborative approach seems more promising than attempting to replace human expertise entirely.
Final Reality Check
Look, most of these companies didn’t set out to revolutionize anything. They just had problems that were costing them money, and they found ways to fix them systematically. Some got lucky with timing, others had deep pockets to experiment through multiple failures.
The real lesson isn’t about specific technologies or algorithms. It’s about disciplined problem-solving: identify the biggest cost drivers, choose appropriate tools, plan for longer timelines than anyone promises, and focus relentlessly on measurable business outcomes.
The companies seeing billion-dollar impacts started with much smaller ambitions. They proved value incrementally, learned from mistakes, and scaled what worked while abandoning what didn’t.
If you’re just starting your predictive analytics journey, these examples provide a roadmap for what’s possible. But remember: your mileage may vary, implementation will take longer than expected, and success requires as much organizational change as technological capability.
The future belongs to companies that can turn data into better decisions consistently over time. These examples prove it’s possible, but they also show it’s harder than the marketing materials suggest.
Similar to how businesses benefit from understanding market sizing guide business opportunity analysis, these supply chain transformations require careful evaluation of potential impact and realistic planning for long-term success.
Organizations looking to replicate these successes should consider how best ai search engine optimization tools can complement their analytical capabilities, ensuring they have the right technological foundation for data-driven decision making.
Just as effective roi calculator methodologies help quantify investment returns, these case studies demonstrate the importance of measuring concrete business outcomes rather than pursuing technology for its own sake.
The path forward requires patience, realistic expectations, and the discipline to focus on solving real problems rather than implementing impressive technology. Start small, measure everything, and don’t believe your own hype.
If you’re struggling to translate your operational excellence into market leadership, The Marketing Agency’s data-driven approach to digital marketing mirrors the same analytical rigor demonstrated in these supply chain success stories. We help companies showcase their innovations and generate demand through performance-focused strategies that deliver measurable ROI. Ready to turn your predictive analytics capabilities into competitive advantage? Our scientific approach to market analysis can amplify your success.
