


Table of Contents
-
Understanding Marketing ROI Fundamentals
-
Channel-Specific ROI Calculation Tools
-
Advanced ROI Analysis and Optimization
-
Strategic Implementation and Business Applications
-
Final Thoughts
TL;DR
-
ROI is basically asking: “For every dollar I threw at marketing, how much money actually came back?” It’s the difference between knowing your Facebook ads are working versus just hoping they are
-
The math is simple: (Revenue – Marketing Cost) / Marketing Cost × 100, but figuring out which touchpoints actually deserve credit gets messy fast
-
Email marketing is basically the overachiever of the marketing world – it typically brings back $36-42 for every dollar you spend. Yeah, I know that sounds too good to be true, but I’ve seen it happen over and over
-
You don’t need expensive software to start tracking this stuff – free calculators and Excel templates work just fine when you’re getting started
-
Multi-touch attribution sounds fancy, but it’s really just giving credit where credit is due across your customer’s messy journey from “never heard of you” to “take my money”
-
When presenting ROI data, remember your boss wants the big picture while your team needs the nitty-gritty details to actually improve things
Look, I’ve made my fair share of marketing mistakes over the years. There’s nothing quite like the sinking feeling of realizing you just blew $10,000 on a campaign that brought in zero sales. That’s exactly why I became obsessed with actually measuring what works. With over 7,000 agencies having ditched manual reports for automated ROI tracking, it’s clear that guessing just doesn’t cut it anymore.
Understanding Marketing ROI Fundamentals
Think of marketing ROI as your BS detector in a world full of marketing promises and shiny metrics that don’t mean squat. Without it, you’re basically playing darts blindfolded with your company’s money. I’ve watched too many businesses burn through budgets chasing “engagement” and “brand awareness” while their bank account stays stubbornly empty.
Here’s what drives me crazy: marketers who get excited about vanity metrics while their sales numbers look like a sad trombone. I’ve literally seen marketing managers throw parties for hitting 10,000 website visitors while their boss is wondering why revenue didn’t budge. Real ROI measurement cuts through that noise and focuses on actual money in your bank account – not likes, shares, or even leads that never buy anything.
The difference between successful marketers and those constantly defending their budget comes down to one thing: they can point to real dollars flowing back into the business. This becomes your lifeline when skeptical executives start questioning every marketing expense and wondering if they should just cut the whole department.
Understanding the importance of data-driven measurement aligns with comprehensive analytics auditing to ensure accurate ROI tracking across all marketing channels.

What Marketing ROI Really Means (And Why Most People Screw It Up)
Most marketers think they understand ROI, but they’re actually measuring feel-good metrics that have zero connection to revenue. I’ve watched countless teams celebrate increased website traffic like they just won the lottery while their actual sales stayed flatter than day-old soda.
True marketing ROI isn’t about getting more eyeballs on your content or boosting those engagement rates that look impressive in presentations. We’re talking about the direct financial impact of your marketing efforts – the real, measurable difference between money going out and money coming back in.
When you can walk into a meeting and say, “Every dollar we spent on marketing last month generated $3 in revenue,” suddenly those budget conversations get a whole lot easier. No more begging for resources or trying to explain why marketing “contributes to brand awareness.” You’ve got cold, hard numbers.
The Three Things You Absolutely Cannot Mess Up
Every accurate ROI calculation rests on three pillars, and if you screw up any of them, your numbers become worthless fairy tales. Revenue generated means the actual income directly tied to your marketing efforts – not website visits, not form submissions, but real money from real customers. Marketing costs include everything (and I mean everything) from ad spend to software subscriptions to the time your team spent creating content. The measurement period defines your timeframe, and this matters more than you think.
Here’s where people usually mess up the revenue tracking: they celebrate high conversion rates on their contact forms without checking if those “leads” ever actually bought anything. I worked with a company that was bragging about their 15% conversion rate until we discovered that 90% of those conversions were tire-kickers who never spent a dime.
Marketing costs go way beyond the obvious stuff. You need to factor in:
-
Your actual advertising spend (the easy part)
-
Marketing software and tools (those monthly subscriptions add up fast)
-
Staff time and salaries (yes, your time costs money)
-
Creative development costs (design, copywriting, video production)
-
Agency fees and contractor payments
Time periods can make or break your analysis. Measure too short and you’ll miss delayed conversions. Measure too long and you’ll muddy up your attribution. A local restaurant I helped spent $2,000 on Google ads and generated $8,000 in revenue over the month. Using the basic formula: ($8,000 – $2,000) / $2,000 × 100 = 300% ROI. That means they made $3 profit for every $1 invested – not bad for slinging burgers.
ROI vs ROAS: Don’t Make This Expensive Mistake
Here’s where many marketers shoot themselves in the foot without realizing it – they use ROI and ROAS like they’re the same thing when they’re completely different animals. ROAS (Return on Ad Spend) only looks at advertising costs versus revenue, giving you tunnel vision. ROI includes all your marketing expenses, showing you the complete financial picture.
Using the wrong metric is like judging a movie by just the special effects while ignoring the plot. You might think you’re killing it with a 4:1 ROAS on your Facebook ads, but once you factor in creative costs, management time, and software expenses, you might actually be losing money.
I’ve seen this happen more times than I can count. A campaign looks amazing with ROAS but delivers negative ROI when you account for the full cost picture. That’s not just bad math – it’s a business-killing mistake.
|
Metric |
What It Actually Measures |
When To Use It |
How To Calculate It |
|---|---|---|---|
|
ROI |
Complete marketing profitability |
Full campaign analysis |
(Revenue – Total Marketing Cost) / Total Marketing Cost × 100 |
|
ROAS |
Ad spend efficiency |
Quick campaign comparison |
Revenue / Ad Spend |
|
CLV |
Long-term customer value |
Strategic planning |
Average Purchase Value × Purchase Frequency × Customer Lifespan |
Marketing ROI Formula and Calculation Methods
The math behind marketing ROI isn’t rocket science, but the devil’s in the details of actually implementing it correctly. While the basic formula gives you a starting point, real-world marketing measurement gets complicated fast because customers don’t follow neat, predictable paths from ad to purchase.
Getting these calculations right means the difference between optimizing campaigns that actually make money and accidentally killing your best performers. I’ve watched teams pause their highest-ROI campaigns because they misunderstood their own data – don’t be that team.
The Simple Formula That’ll Change Your Life
Start with this: (Revenue – Marketing Cost) / Marketing Cost × 100. That percentage tells you exactly how much bang you’re getting for your marketing buck. A 200% ROI means you’re making $2 profit for every $1 spent on marketing. Negative ROI means you’re basically lighting money on fire and need to fix things immediately.
Here’s how this plays out in the real world:
-
Your campaign generates $25,000 in revenue
-
Total marketing costs hit $5,000
-
Calculation: ($25,000 – $5,000) / $5,000 × 100 = 400% ROI
That means you earned $4 profit for every $1 invested. Pretty sweet deal, right?
The beauty of this formula is its simplicity, but don’t let that fool you. When applied consistently across all your campaigns and channels, it becomes incredibly powerful. Marketing teams that track ROI consistently show measurably better performance because they can “translate marketing activities into business impact” – exactly what everyone actually cares about.
When Simple Math Isn’t Enough (Welcome to Attribution Hell)
Here’s where things get interesting – and frustrating. Customer journeys are messier than a toddler’s art project. People see your Facebook ad on their phone, ignore it, Google you three weeks later on their laptop, read your blog, forget about you exist, then finally buy after your email newsletter reminds them you’re still alive.
Simple “last-click” attribution gives all the credit to that final email, which is like giving the last person who touched a football all the credit for the touchdown. That’s where multi-touch attribution comes in – it’s basically trying to give credit where credit is due across the entire customer journey.
First-touch attribution says the Facebook ad deserves all the glory because it started the relationship. Last-touch attribution crowns the email as the hero. Linear attribution plays fair and splits credit equally among all touchpoints. Time-decay attribution is like a judge who thinks recent evidence matters more – it gives increasing credit to interactions closer to the purchase.
Each model tells a different story, and picking the wrong one can lead to some seriously bad budget decisions.

Customer Lifetime Value: Playing the Long Game
Here’s something that’ll blow your mind: focusing only on immediate ROI can actually hurt your business. A customer who spends $50 on their first purchase might seem less valuable than one who drops $200 right away. But what if that $50 customer comes back every month for two years and refers three friends?
Customer Lifetime Value (CLV) calculations help you see beyond the first transaction to understand the real long-term value of your marketing efforts. This perspective prevents you from making short-sighted decisions that optimize for quick wins while destroying sustainable growth.
Here’s how to think about CLV:
-
Average purchase value × Purchase frequency × Customer lifespan
Then factor this into your ROI calculations to understand long-term campaign profitability. This stops you from cutting campaigns that might have lower immediate returns but bring in customers who stick around and spend more over time.
Step-by-Step ROI Calculation Process
Implementing systematic ROI measurement isn’t just about good intentions and a calculator app. You need structured processes, consistent frameworks, and the discipline to track everything that actually matters. Half-hearted measurement is worse than no measurement because it gives you false confidence in bad decisions.
This systematic approach transforms ROI from a quarterly guessing game into a daily optimization tool that guides every marketing decision you make. I’ve helped dozens of businesses implement these processes, and the difference is night and day.
Getting Your Data Foundation Right (Or Everything Else Falls Apart)
Bad data will lie to you with a straight face. I’ve seen businesses double down on campaigns that were actually losing money because their tracking was garbage. Missing or inaccurate data doesn’t just mess up your calculations – it leads to strategic decisions that can tank your entire marketing operation.
Revenue tracking starts with proper UTM parameter implementation across all campaigns. Look, UTM codes sound fancy, but they’re just tiny tracking tags you add to your links. Think of them like putting a name tag on every visitor so you know exactly which door they came through.
If you’re not tracking your links properly, you’re flying blind. Every single link in every campaign needs tracking codes that identify traffic sources, campaigns, and content variations. No exceptions.
Expense tracking requires obsessive record-keeping of:
-
Monthly software subscriptions (they add up faster than you think)
-
Advertising spend across all platforms
-
Content creation and design costs
-
Team time allocation to specific campaigns
-
Third-party service fees and contractor payments
Customer acquisition costs need granular tracking by channel, campaign, and customer segment to identify your most efficient acquisition methods.
Proper data collection builds upon the same principles outlined in our market sizing methodology for accurate business opportunity assessment.
ROI Data Collection Checklist (Don’t Skip These):
-
☐ UTM parameters on every single campaign link
-
☐ Revenue attribution system that connects marketing to actual sales
-
☐ Complete expense tracking across all marketing activities
-
☐ Customer acquisition cost tracking by channel
-
☐ Conversion tracking pixels on key pages
-
☐ CRM integration for lead-to-customer attribution
-
☐ Regular data cleaning (because data gets messy fast)
Picking Your Attribution Model (Without Losing Your Mind)
Your attribution model choice dramatically impacts your ROI calculations and the budget decisions that follow. Here’s the thing: there’s no “perfect” attribution model, just different ways of looking at the same customer journey.
B2B companies with long sales cycles usually benefit from first-touch attribution because it gives credit to awareness-building efforts that might take months to pay off. E-commerce businesses with shorter purchase cycles might prefer last-touch attribution for its simplicity and focus on conversion drivers.
Complex, multi-channel businesses need sophisticated multi-touch models, but only if their teams can actually understand and act on the insights.
Consider your business reality:
-
How long is your typical sales cycle?
-
How many touchpoints do customers have before buying?
-
How diverse is your marketing channel mix?
-
Can your team handle complex attribution models?
Match your attribution model to your actual business situation, not the latest marketing trend. I’ve seen businesses implement overly complex attribution models that their teams couldn’t understand or use effectively. Simple and actionable beats complex and confusing every time.
Channel-Specific ROI Calculation Tools
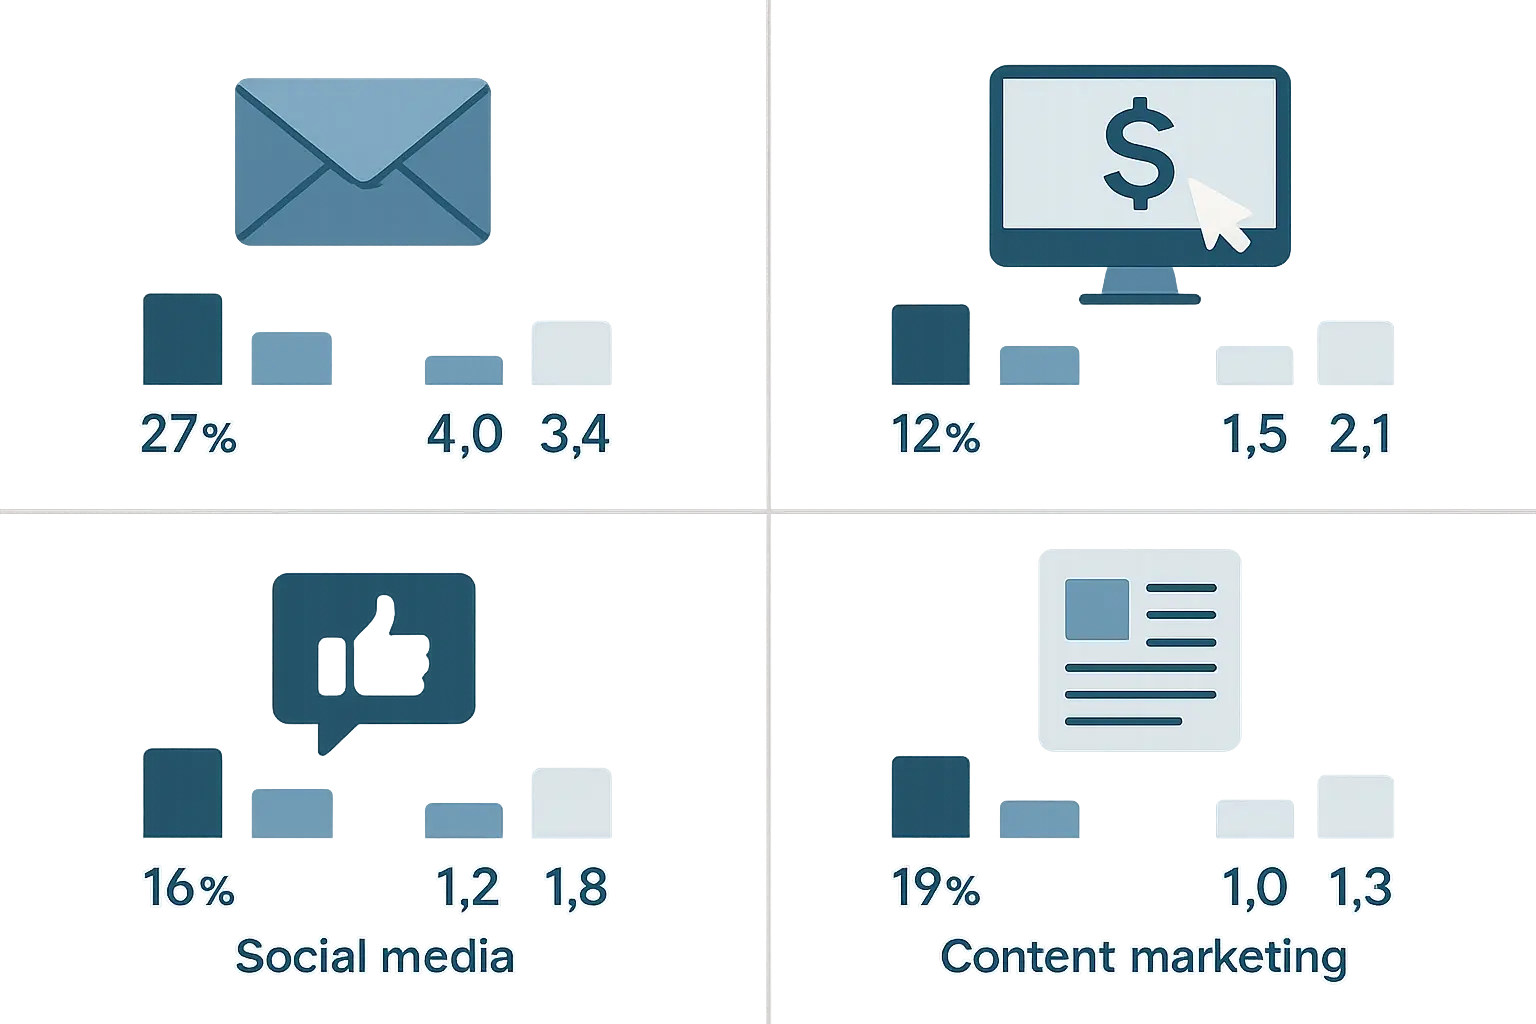
Different marketing channels are like different sports – they each have their own rules, scoring systems, and strategies. Email marketing delivers measurable, direct responses that make ROI calculation pretty straightforward. Social media marketing involves complex attribution challenges across multiple platforms where people browse, research, and eventually buy somewhere completely different.
Paid advertising gives you immediate data but requires sophisticated analysis to account for people who see your ad, don’t click, but buy later. Understanding these channel-specific quirks ensures you’re measuring what actually matters instead of vanity metrics
that look impressive in reports but don’t drive business results.
Email Marketing ROI Calculator
Email marketing is basically the overachiever of the digital marketing world, consistently delivering ROI rates between 3600% and 4200%. That means for every dollar you spend, you’re getting back $36-42. I know that sounds too good to be true – I was skeptical too until I saw it happen over and over again.
This exceptional performance comes from email’s direct nature, ridiculously low costs, and ability to nurture relationships over time. But here’s the thing: calculating email ROI requires tracking specific metrics that actually matter, not just those feel-good open and click rates that everyone obsesses over.
I’ve worked with companies that threw parties for hitting 30% open rates while their email campaigns generated exactly zero dollars in revenue. Don’t be those people.
The Email Metrics That Actually Pay Your Bills
Open rates and click-through rates are like applause at a comedy show – nice to have, but they don’t pay the rent. Revenue per email, conversion rate by segment, and subscriber lifetime value tell you which emails actually drive purchases, which segments respond to different messaging, and how email marketing contributes to your bottom line.
These are the metrics that matter:
-
Revenue per email sent (the big one)
-
Conversion rate by email type (promotional vs. educational vs. automated)
-
Average order value from email traffic
-
Subscriber lifetime value by acquisition source
-
List growth rate and churn analysis
Revenue per email calculation is simple: Total email revenue ÷ Number of emails sent
This metric immediately shows which campaigns generate actual income versus those that just boost engagement metrics. An online retailer I worked with sent 15,000 promotional emails and generated $18,000 in revenue. Their revenue per email was $1.20 ($18,000 ÷ 15,000). With email platform costs of $150 monthly and 3 hours of staff time ($150), their total cost was $300, delivering an ROI of 5,900% (($18,000 – $300) / $300 × 100).
Not too shabby for hitting “send” on an email.
Why Segmentation Makes or Breaks Your ROI
Here’s something that’ll blow your mind: not all email subscribers are created equal, and treating them the same is leaving money on the table. Segmented campaigns consistently crush broadcast emails, but the ROI varies dramatically between different groups.
New subscribers might have lower immediate ROI but higher long-term value. VIP customers generate higher per-email revenue but need more sophisticated messaging. Analyzing ROI across different segments reveals optimization opportunities that can literally double or triple your email marketing returns.
Break down your ROI analysis by:
-
How subscribers joined your list
-
Purchase history and frequency
-
Engagement level and recency
-
Geographic location and demographics
-
Product preferences and browsing behavior
Calculate segment-specific ROI to identify your most valuable subscriber groups and tailor campaigns accordingly. This granular approach prevents you from treating all subscribers the same when they clearly have different value profiles and behaviors.
Free Marketing ROI Calculator Resources
You don’t need to blow your budget on expensive enterprise software to start measuring marketing ROI effectively. There are tons of free online calculators and downloadable templates that provide sophisticated calculation capabilities without the eye-watering price tags.
These tools level the playing field, letting small businesses and startups implement data-driven marketing strategies that used to be available only to companies with massive analytics budgets. Sometimes the best solutions are the simplest ones.
Online Calculator Platforms
Web-based ROI calculators give you immediate results with simple input fields for revenue, costs, and time periods. While they won’t handle complex attribution modeling, these tools provide quick insights for campaign evaluation and budget planning without requiring a PhD in data science.
Most platforms offer basic calculations for free, with premium features available if you need more sophisticated analysis.
Popular free calculator features include:
-
Basic ROI percentage calculations
-
ROAS comparisons across campaigns
-
Break-even analysis tools
-
Simple forecasting capabilities
-
Export options for further analysis
These calculators work best for straightforward campaigns with clear attribution paths and single-channel measurement needs. Perfect for getting started without overwhelming yourself.
Recent innovations are changing the game entirely. “Adam Expo Stand’s AI-powered Exhibition ROI Calculator” now delivers ROI predictions with up to 89% accuracy by analyzing over 50 variables, showing how machine learning is revolutionizing marketing measurement across industries.
Template-Based Solutions (For Control Freaks Like Me)
Downloadable Excel and Google Sheets templates give you customizable frameworks while keeping complete control over your data. These templates often include pre-built formulas, dashboard visualizations, and multiple calculation methods that you can tweak for your specific business needs.
The flexibility of template-based solutions makes them perfect for businesses with unique measurement requirements or complex attribution models that don’t fit into standard calculator boxes.
Template advantages include:
-
Complete data ownership and privacy (no third-party access)
-
Customizable formulas and calculations
-
Integration with existing business systems
-
No ongoing subscription costs
-
Offline accessibility and backup options
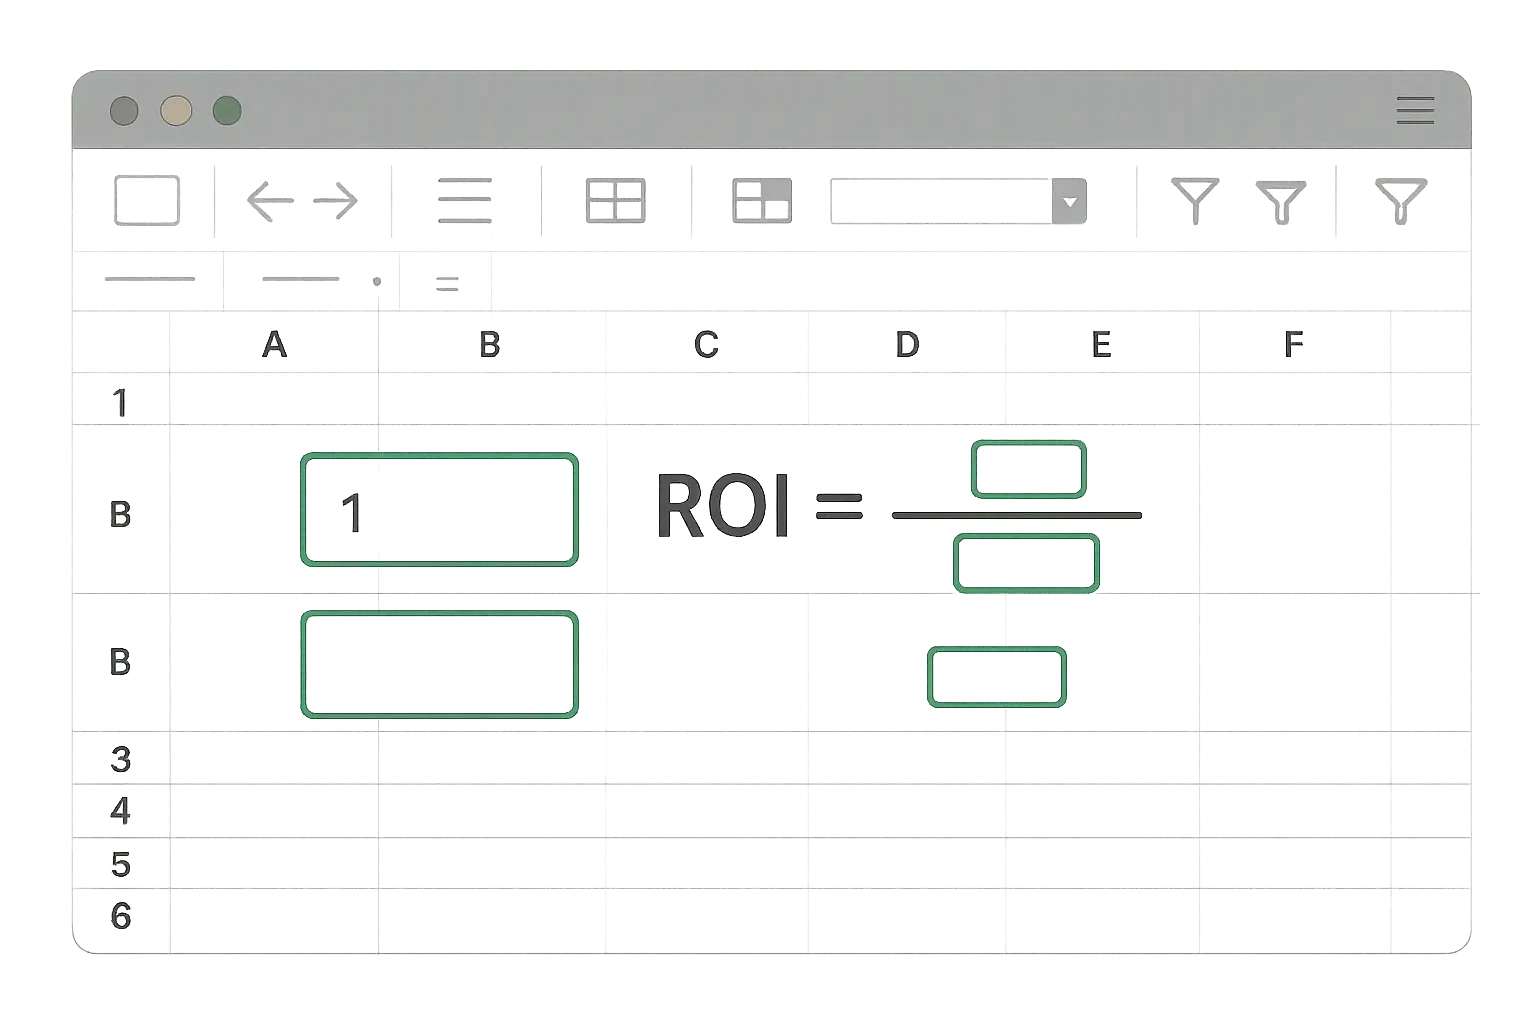
Marketing ROI Calculator Excel Implementation
Excel might not be sexy, but it’s like the reliable Honda Civic of marketing tools – it gets the job done, everyone knows how to use it, and you don’t need to sell a kidney to afford it. Building your own Excel-based calculator gives you complete customization control while maintaining familiar interfaces that most team members can actually use.
The key is developing dynamic formulas and automated processes that update calculations as new data comes in, turning static spreadsheets into powerful analytical tools.
Excel Formula Development (Don’t Panic, It’s Easier Than It Looks)
Creating dynamic ROI calculations in Excel requires mastering a few key functions that automate data processing and eliminate manual calculation errors. SUMIF functions aggregate revenue by campaign or channel, VLOOKUP formulas connect cost data with performance metrics, and pivot tables provide flexible analysis capabilities.
These formulas transform boring spreadsheets into analytical powerhouses that update automatically as you add new data.
Essential Excel formulas for ROI calculation:
SUMIF for revenue aggregation:=SUMIF(Campaign_Column,"Campaign_Name",Revenue_Column)
VLOOKUP for cost matching:=VLOOKUP(Campaign_Name,Cost_Table,Cost_Column,FALSE)
ROI calculation with error handling:=IF(Marketing_Cost=0,"No Cost Data",(Revenue-Marketing_Cost)/Marketing_Cost*100)
These formulas create the foundation for automated ROI tracking across multiple campaigns and channels without manual number-crunching every time.
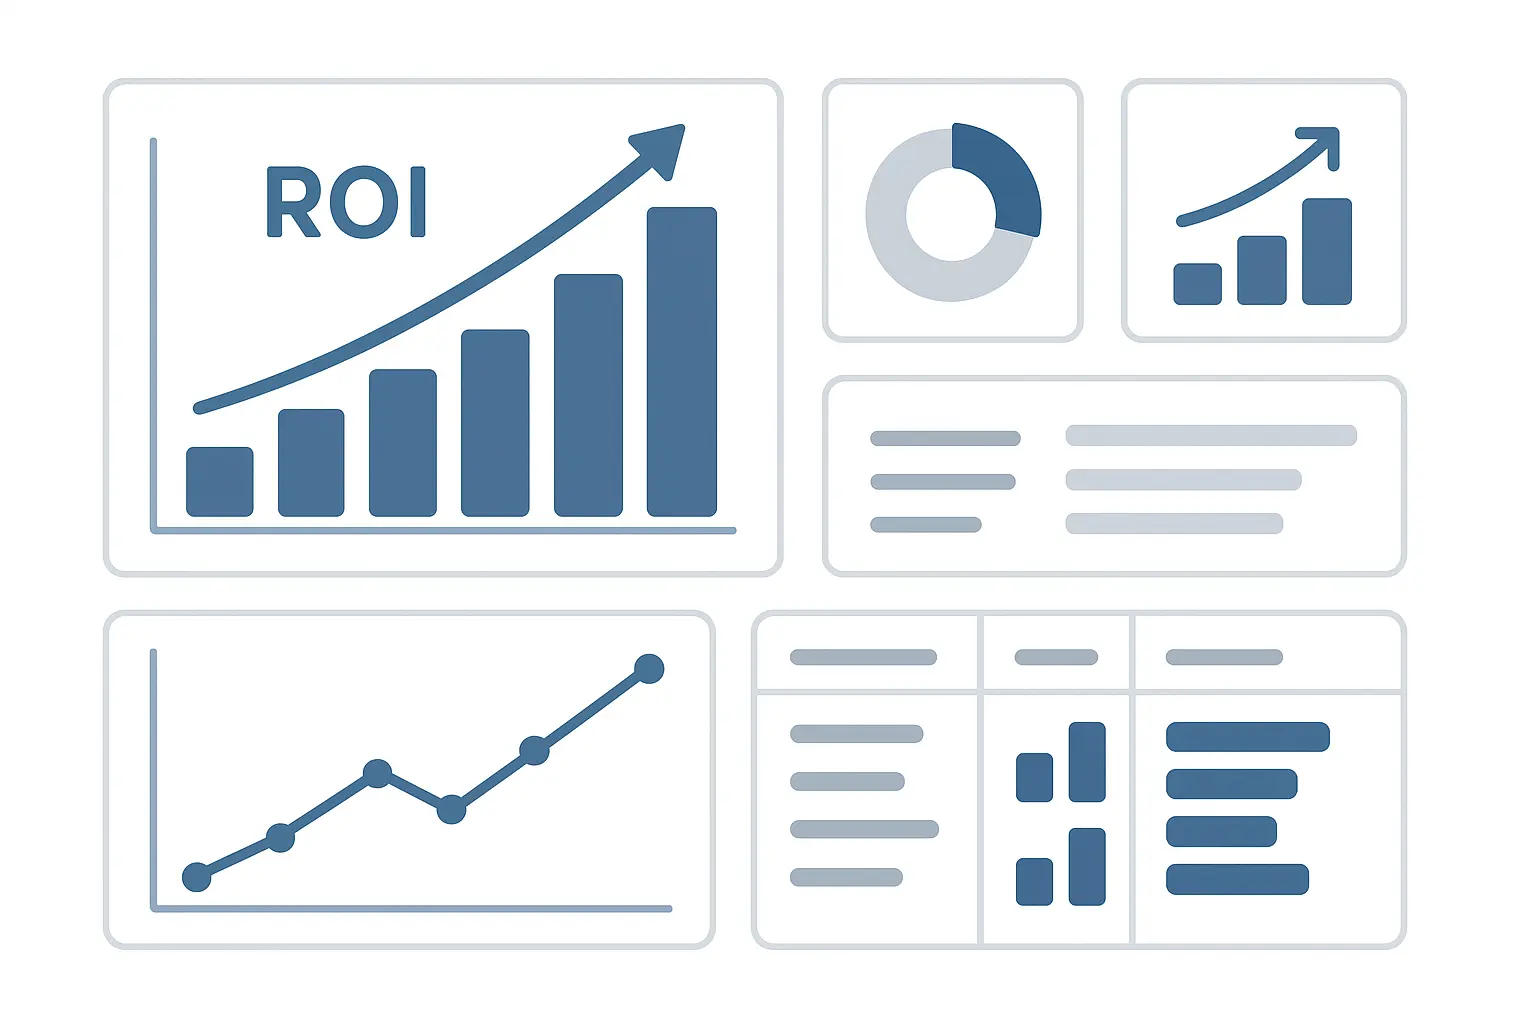
Dashboard Creation (Making Your Data Look Professional)
Visual dashboards transform raw ROI data into actionable insights that stakeholders can quickly understand and act upon. Excel’s charting capabilities, conditional formatting, and dashboard design features let you create professional-looking reports that highlight key performance indicators, trend analysis, and optimization opportunities.
The goal is balancing comprehensive data with clear visual hierarchy that guides viewers to the most important insights without overwhelming them with spreadsheet chaos.
Dashboard elements that actually drive action:
-
ROI trend charts showing performance over time
-
Channel comparison bar graphs
-
Traffic light indicators for performance thresholds
-
Top performer tables highlighting your best campaigns
-
Budget allocation recommendations based on ROI data
Use conditional formatting to automatically highlight campaigns exceeding or falling below ROI targets – it’s like having a built-in alert system.
Advanced Excel Features (For When You’re Ready to Level Up)
Power Query transforms Excel into a data integration powerhouse, automatically importing and cleaning data from multiple sources including advertising platforms, CRM systems, and e-commerce platforms. Scenario analysis tools enable ROI forecasting under different budget and performance assumptions.
Macro automation streamlines repetitive reporting tasks, saving hours of manual work while ensuring consistency across reporting periods.
Power Query capabilities include:
-
Automated data imports from web sources
-
Data cleaning and transformation processes
-
Scheduled refresh for real-time updates
-
Multiple source consolidation
-
Error handling for missing or corrupted data
Scenario analysis helps answer the big questions:
-
What ROI can we expect with 20% budget increases?
-
How would performance change with improved conversion rates?
-
Which channels should get additional investment?
Advanced ROI Analysis and Optimization
Basic ROI calculations are just the beginning – they’re like learning to walk before you run a marathon. Advanced techniques reveal hidden patterns, predict future performance, and identify optimization opportunities that can dramatically improve your marketing efficiency.
This sophisticated approach separates marketing leaders from followers, enabling strategic decisions based on deep insights rather than surface-level metrics. The complexity increases, but so does your competitive advantage and ability to squeeze maximum value from every marketing dollar.
Advanced optimization techniques parallel the systematic approaches we use in content optimization strategies to maximize performance across all marketing channels.

Multi-Channel Attribution Modeling
Modern customers are like pinballs bouncing between touchpoints before finally making a purchase decision. They see your Facebook ad, ignore it, Google you three weeks later, read your blog, forget you exist, then buy after your email reminds them you’re still alive. Single-touch attribution models are about as useful as a chocolate teapot for understanding this messy reality.
Multi-channel attribution modeling distributes revenue credit across the entire customer journey, revealing the true contribution of each marketing channel and touchpoint. This comprehensive view prevents you from accidentally cutting funding to channels that play crucial supporting roles in your conversion process.
Attribution Model Types (And When Each One Actually Makes Sense)
Each attribution model tells a different story about your marketing performance, and picking the wrong one can lead to budget decisions that’ll make you want to hide under your desk. First-touch attribution gives all the glory to whichever channel first brought someone into your world, but completely ignores all the nurturing that happened afterward.
Last-touch attribution crowns the final touchpoint before conversion as the hero while pretending the entire customer journey leading up to that moment never happened. It’s like giving the person who scored the winning goal all the credit while ignoring the entire team that made it possible.
First-touch attribution works best for:
-
Brand awareness campaign evaluation
-
Top-of-funnel channel assessment
-
Long sales cycle businesses
-
Content marketing ROI measurement
Last-touch attribution makes sense for:
-
Direct response campaign optimization
-
Short sales cycle products
-
E-commerce conversion tracking
-
Performance marketing evaluation
Linear attribution provides:
-
Balanced credit distribution across all touchpoints
-
Comprehensive journey analysis
-
Fair channel comparison
-
Complex funnel insights
Time-Decay Attribution (Because Recent Stuff Usually Matters More)
Time-decay attribution acknowledges something we all know intuitively: the marketing touchpoints closer to someone’s purchase decision typically carry more weight than stuff that happened months ago. This model assigns increasing credit to recent interactions while still recognizing earlier touchpoints that started the relationship.
It’s like a judge who thinks recent evidence matters more in making a decision, which honestly makes a lot of sense when you think about how people actually make buying decisions.
Time-decay attribution benefits include:
-
Realistic influence weighting based on recency
-
Balanced journey recognition
-
More accurate budget allocation
-
Better understanding of what actually tips people over the edge
Implementation requires defining decay rates that match your typical sales cycle length and customer behavior patterns – there’s no one-size-fits-all approach here.
According to Lead Booster Pro’s research, companies using smart forms and attribution modeling have increased conversion rates by over 80%, demonstrating the significant impact of proper attribution on marketing performance.
ROI Optimization Strategies
Measuring ROI is just the beginning – optimization is where the real money gets made. Systematic optimization approaches leverage ROI data to improve campaign performance, reallocate budgets for maximum efficiency, and identify high-value opportunities for growth.
This process requires disciplined analysis, strategic thinking, and sometimes the courage to make difficult decisions about underperforming campaigns and channels. It’s not always fun, but it’s necessary.
Budget Reallocation Framework (Or How to Move Money Without Screwing Everything Up)
Smart budget reallocation requires more than just moving money from low-ROI to high-ROI channels like you’re playing musical chairs. You need a systematic framework that considers channel capacity, audience overlap, and strategic diversification to avoid putting all your eggs in one basket.
The most profitable channel today might hit a saturation point tomorrow, making balanced portfolio management essential for sustainable growth. I’ve seen businesses go all-in on their best-performing channel only to watch returns plummet when they scaled too aggressively.
Your reallocation strategy should involve:
-
Identifying channels with expansion capacity
-
Testing incremental budget increases before making major shifts
-
Maintaining minimum viable presence across key channels
-
Monitoring performance changes as budgets scale
-
Planning for seasonal fluctuations and market changes
Start with 10-20% budget shifts to test channel response before making dramatic reallocations. Think of it like testing the water temperature before jumping in the pool.
A SaaS company I worked with discovered their Google Ads delivered 150% ROI while Facebook Ads only achieved 75% ROI. Instead of killing Facebook entirely, they reduced Facebook spend by 30% and increased Google Ads budget by 25%, while keeping Facebook running for brand awareness. This balanced approach improved overall ROI from 112% to 134% while preserving channel diversification.
Performance Benchmarking (Know Where You Stand)
Without benchmarks, you’re basically flying blind through ROI optimization. Industry-specific benchmarks provide context for your performance levels, while internal historical data reveals trends and seasonal patterns that can guide your strategy.
Establishing clear performance standards helps you identify when campaigns need immediate attention versus when they’re performing within
acceptable ranges. It’s the difference between panicking over normal fluctuations and recognizing actual problems.
Benchmark categories include:
-
Industry average ROI by channel
-
Your own historical performance trends
-
Competitive analysis insights (when you can get them)
-
Seasonal performance patterns
-
Customer segment variations
Understanding competitive benchmarks requires the same analytical rigor we apply in comparative tool analysis to identify the best solutions for your business needs.
Use benchmarks as guides, not absolute rules. Your unique business model, target audience, and market position might justify different performance expectations than industry averages.
|
Industry |
Average Email ROI |
Average PPC ROI |
Average Social ROI |
Reality Check |
|---|---|---|---|---|
|
E-commerce |
3800% |
200% |
95% |
Your mileage may vary |
|
B2B Software |
4200% |
300% |
150% |
Long sales cycles help |
|
Healthcare |
3600% |
250% |
120% |
Trust matters more |
|
Financial Services |
4000% |
180% |
85% |
Compliance complicates things |
Predictive ROI Modeling (Your Crystal Ball for Marketing)
Historical data becomes your crystal ball for future performance when properly analyzed through predictive modeling techniques. These models identify patterns in your ROI data that enable proactive budget planning and strategic decision-making for upcoming campaigns.
Instead of constantly reacting to performance changes after they happen, you can anticipate them and adjust strategies accordingly. It’s like having a weather forecast for your marketing performance.
Predictive modeling elements include:
-
Seasonal trend analysis
-
Channel saturation point identification
-
Customer lifetime value forecasting
-
Market condition impact assessment
-
Budget scenario planning
Use these insights to build quarterly and annual marketing plans with realistic ROI expectations instead of pulling numbers out of thin air.

Strategic Implementation and Business Applications
Translating ROI calculations into actionable business strategies requires understanding organizational dynamics, stakeholder communication preferences, and long-term value creation beyond immediate returns. The most sophisticated ROI analysis in the world means nothing if you can’t communicate insights effectively or align marketing metrics with broader business objectives.
This section bridges the gap between marketing measurement and business impact, ensuring your ROI work actually drives organizational change instead of just creating pretty reports that nobody acts on.
ROI Reporting and Communication
The way you present ROI data determines whether stakeholders view marketing as a strategic growth driver or just another expense line item. Different audiences need different information – executives want strategic insights and bottom-line impact, while marketing teams need operational details for campaign optimization.
Mastering stakeholder communication transforms ROI reporting from a quarterly obligation into a powerful tool for securing resources and driving organizational alignment. It’s the difference between being seen as a cost center and being recognized as a profit driver.
Executive Dashboard Development (What Your Boss Actually Wants to See)
C-suite executives don’t have time for detailed campaign metrics – they need high-level insights that connect marketing performance to business outcomes. Executive dashboards focus on key performance indicators, trend analysis, and strategic recommendations that enable quick decision-making.
The goal is providing enough information for informed decisions without overwhelming busy executives with operational details they don’t need and won’t use anyway.
Executive dashboard essentials:
-
Overall marketing ROI trends (the big picture)
-
Revenue attribution by major channel
-
Budget efficiency comparisons
-
Growth opportunity identification
-
Competitive positioning insights
Keep executive reports to one page with clear visual hierarchy and actionable recommendations. Think executive summary, not encyclopedia.
Stakeholder-Specific Reporting (Give People What They Actually Need)
Finance teams care about cost control and budget accuracy – show them variance analysis and forecasting data. Sales teams want to understand lead quality and conversion support – give them pipeline contribution metrics. Marketing teams need operational details for campaign optimization – provide them with granular performance data.
Customizing ROI presentations for different audiences ensures each stakeholder gets relevant information that helps them make better decisions within their area of responsibility.
Finance-focused reports should emphasize:
-
Budget variance analysis
-
Cost per acquisition trends
-
ROI by spending category
-
Forecasting accuracy
-
Risk assessment metrics
Sales-focused reports should highlight:
-
Lead quality scores
-
Conversion rate support
-
Pipeline contribution analysis
-
Customer acquisition costs
-
Revenue attribution details
Marketing-focused reports need to include:
-
Campaign-level performance
-
Channel optimization opportunities
-
Creative performance analysis
-
Audience segment insights
-
Testing results and recommendations
Effective reporting strategies build upon the content optimization principles we discuss in high-impact content creation to ensure maximum stakeholder engagement.
ROI Reporting Template Checklist:
-
☐ Audience-specific metrics selection
-
☐ Clear visual hierarchy and data presentation
-
☐ Actionable insights and recommendations
-
☐ Trend analysis and historical context
-
☐ Performance against benchmarks and targets
-
☐ Next steps and optimization opportunities
-
☐ Executive summary for quick decision-making
Long-Term ROI Strategy Development
Sustainable marketing success requires balancing short-term ROI optimization with long-term brand building and customer relationship development strategies. While immediate returns grab attention and justify budgets, the most successful businesses invest in marketing activities that build lasting competitive advantages and customer loyalty.
This long-term perspective prevents the myopic focus on quick wins that can actually undermine sustainable growth. Sometimes the best ROI comes from investments that don’t pay off immediately.
Customer Lifetime Value Integration (Playing the Long Game)
Customer Lifetime Value calculations justify higher acquisition costs for valuable customer segments and shift focus from transaction-based thinking to relationship-based strategy. When you understand that a customer will generate $3,000 in profit over two years, spending $300 to acquire them becomes a smart investment rather than an expensive gamble.
CLV integration transforms ROI measurement from short-term campaign evaluation to long-term business building. It’s the difference between optimizing for this quarter’s numbers and building a sustainable business.
CLV-enhanced ROI considerations include:
-
Acquisition cost tolerance by customer segment
-
Retention marketing investment justification
-
Referral program ROI calculation
-
Upselling and cross-selling opportunity value
-
Churn prevention campaign evaluation
Factor CLV into all acquisition channel ROI calculations to avoid underinvesting in high-value customer segments just because they don’t convert immediately.
Research shows that marketing teams leveraging comprehensive ROI measurement consistently outperform competitors because they can “show clients exactly what’s working” and focus efforts where they make the most impact.

The Marketing Agency’s data-driven approach directly addresses these ROI measurement complexities through their systematic methodology that goes beyond basic calculations. Their transparent pricing structure – from PPC management ($750-$5,000/month) to comprehensive Email Marketing campaigns ($1,200-$10,000/month) – enables accurate ROI forecasting before campaign launch.
With expertise spanning attribution modeling, multi-channel optimization, and performance analytics, The Marketing Agency transforms ROI measurement from a quarterly reporting exercise into a daily optimization tool. Their focus on “strategies rooted in data and science” ensures your marketing investments deliver measurable returns rather than hoping for the best with unproven tactics.
If you’re feeling overwhelmed by all this (and honestly, you should be – there’s a lot here), that’s exactly why agencies like The Marketing Agency exist. Sometimes it’s worth paying someone else to handle the headache while you focus on running your business. Contact The Marketing Agency to implement ROI measurement systems that drive real business growth.
Final Thoughts
Here’s the bottom line: measuring ROI isn’t about becoming a data nerd (though some of us enjoy that). It’s about sleeping better at night knowing your marketing dollars aren’t disappearing into a black hole. The businesses that master ROI measurement and optimization consistently outperform competitors who rely on gut feelings and “best practices” that may or may not work for their specific situation.
Start simple with basic ROI calculations using the formula we covered, then gradually implement more sophisticated attribution models as your measurement capabilities mature. The key is consistent measurement and continuous optimization rather than perfect calculations from day one.
Now, before you get all excited about Excel templates and fancy calculators, let me be real with you: most businesses I work with can’t even tell me how much they spent on marketing last month, let alone track which campaigns drove sales. If that’s you, don’t worry – start with the basics and build from there.
Remember that ROI optimization is an ongoing process, not a one-time project. Market conditions change, customer behavior evolves, and new channels emerge constantly. Your measurement systems need to adapt accordingly while maintaining the discipline of data-driven decision making that separates successful marketers from those burning through budgets without clear returns.
Listen, even knowing your ROI is terrible is better than not knowing at all. At least then you know what needs fixing.
