
Table of Contents
-
Why Market Sizing Actually Matters for Your Business
-
The Foundation: Understanding TAM, SAM, and SOM
-
Top-Down vs Bottom-Up: Which Method Works Best
-
Advanced Market Sizing Techniques That Actually Work
-
Getting Your Hands Dirty: Practical Execution Steps
-
Data Sources That Won’t Let You Down
-
Complex Markets and Edge Cases
-
International Market Sizing Challenges
-
How The Marketing Agency Transforms Market Analysis Into Growth
TL;DR
-
Market sizing isn’t just academic theory—it directly impacts your funding, resource allocation, and whether investors take you seriously
-
Learn the three market categories: TAM (the dream scenario), SAM (what you can actually target), and SOM (what you’ll probably get)
-
Top-down gives you the big picture fast, bottom-up gives you the real numbers—use both
-
Don’t rely on one source for your data—check your numbers against multiple sources so you’re not completely wrong
-
Talk to real customers whenever possible, but industry reports work when you’re starting out
-
Complex markets like platforms need creative approaches (and a lot more patience)
-
International markets aren’t just currency conversions—culture and regulations change everything
Why Market Sizing Actually Matters for Your Business
Last month, I sat through a pitch where the founder confidently declared they were going after a “$47 billion market.” When I asked how they got that number, they just stared at me. Turns out they’d grabbed the first big number they found on Google.
What is market sizing? Think of it like getting directions before a road trip—you wouldn’t just start driving without knowing where you’re going, right? Market sizing is figuring out how much money people might actually spend on what you’re selling. It’s the difference between having a plan and just hoping things work out.
Market sizing questions pop up everywhere, especially in consulting interviews where you’ve got about 3-6 minutes to calculate a market size according to McKinsey case interview preparation. That time crunch shows you why having a system matters.

The Real Business Impact You Can’t Ignore
Here’s the thing: investors don’t want to see big numbers—they want to know you actually understand your business. I’ve watched funding rounds crash and burn because founders couldn’t explain how they calculated their market opportunity. When you can walk someone through your thinking, you’re showing them you’ve done your homework.
Your competitive positioning depends on knowing where the opportunities are. Which segments are crowded? Where are the gaps? Market sizing helps you figure out where to focus instead of just copying what everyone else is doing.
And resource allocation? That becomes way less stressful when you have actual data. Should you hire more developers or invest in marketing? Which cities should you launch in first? Market sizing gives you a framework for making these decisions without just guessing.
Strategic Applications That Actually Work
Product teams use market sizing to decide what to build next. If you’re choosing between a feature for a $10 million segment versus a $100 million segment, that’s not really a choice, is it? When you’re identifying high-impact blog topics for content marketing, understanding your market size helps you focus on subjects that’ll reach the most people.
Market entry becomes less scary when you can quantify what you’re walking into. You can actually compare the opportunity cost of different markets instead of just going with your gut.
The smartest businesses I work with treat market sizing like a living document. They update it regularly because markets change, customers change their minds, and new competitors show up. Your market analysis should evolve with these changes, not sit in a drawer gathering dust.
The Foundation: Understanding TAM, SAM, and SOM
Okay, so you need to understand these three acronyms. I see people mix them up all the time, which leads to some pretty embarrassing moments in meetings. Think of them as layers—each one gets more realistic about what you can actually achieve.

Breaking Down the Market Categories
Let’s say you want to open a pizza shop. Your Total Addressable Market (TAM) is everyone in your city who eats pizza. It’s the dream scenario where you somehow capture every pizza sale. Obviously not realistic, but it gives you the big picture.
Serviceable Addressable Market (SAM) is more practical—people within delivery range who actually order pizza for delivery. You’re not counting the folks who only eat pizza at restaurants or live too far away for you to reach.
Serviceable Obtainable Market (SOM) is your slice of reality. That’s the customers you can realistically steal from Domino’s and Pizza Hut, considering they’ve got brand recognition, marketing budgets, and a head start.
|
Market Category |
What It Actually Means |
Why It Matters |
When To Use It |
|---|---|---|---|
|
TAM (Total Addressable Market) |
Everyone who could theoretically buy your thing |
Shows the big picture opportunity |
Investor presentations, long-term planning |
|
SAM (Serviceable Addressable Market) |
People you can actually reach with your current setup |
Helps with go-to-market planning |
Resource allocation, market entry decisions |
|
SOM (Serviceable Obtainable Market) |
What you’ll probably actually get |
Sets realistic expectations |
Revenue forecasting, budget planning |
Calculating Each Market Layer
Start with TAM by finding the biggest relevant market you can. If you’re selling project management software, maybe that’s all business software spending. Then start narrowing it down—what size companies? Which countries? What’s their budget situation?
SAM gets more specific. Now you’re thinking about your actual constraints—your distribution channels, pricing model, and any regulations you need to deal with. For that project management software, maybe you focus on mid-sized companies in English-speaking countries that already buy software.
SOM is where reality hits. What market share can you actually capture? Most startups are thrilled to get 1-5% of their SAM in the first few years. If your calculations show you’ll dominate 20% of the market right away, you’re probably being too optimistic.
Real Example:
-
TAM: Global business software market = $500B annually
-
SAM: Mid-market companies (100-1000 employees) in English-speaking countries with software budgets = $15B annually
-
SOM: Realistic 3% penetration over 5 years considering you’re competing with established players = $450M annually
Top-Down vs Bottom-Up: Which Method Works Best
Here’s the truth: both approaches have their place, and the best analysis uses both. I’ve seen people get religious about one method or the other, but that’s missing the point.
Top-Down Market Sizing: Start Big, Then Narrow Down
Top-down is like using a funnel. You start with the biggest market number you can find, then apply filters to narrow it down to your specific opportunity.
The process goes like this:
-
Find the broadest relevant market (like “all food spending”)
-
Apply filters (urban areas only, working professionals, etc.)
-
Keep narrowing until you get to your target customer
-
Check your assumptions against industry benchmarks
For a meal delivery service, you might start with total food spending, filter for urban areas, narrow to working professionals, and focus on people willing to pay for convenience. It’s fast and gives you good context for whether you’re looking at a $10 million or $10 billion opportunity.
The downside? Each filter introduces assumptions, and those errors can compound. You might end up way off if your initial market definition was wrong.
Bottom-Up Market Sizing: Build From the Ground Up
Bottom-up flips the script. Instead of starting with big market numbers, you begin with individual customers and build up.
Here’s how it works:
-
Figure out your smallest unit (one customer, one transaction)
-
Estimate what each unit is worth
-
Count how many units exist
-
Account for how many you can realistically capture
Using the meal delivery example, you’d estimate average order value, how often people order, count potential customers in your area, and figure out realistic market penetration. It takes more work, but you often discover insights that top-down analysis misses.
The challenge is getting reliable data on customer behavior. But when you nail it, bottom-up gives you much more accurate numbers.

Why You Should Use Both (And What To Do When They Don’t Match)
Smart people use both methods and compare results. If top-down says $100 million but bottom-up says $50 million, you need to figure out why.
Common reasons for differences:
-
Your top-down market definition was too broad
-
Your bottom-up penetration assumptions were too conservative
-
You missed market segments in one approach
-
Your data sources were outdated or just wrong
The goal isn’t perfect alignment—it’s understanding the differences and figuring out which method gives you better insights for your situation. When you can explain why the numbers differ, your analysis becomes much more credible.
Quick Checklist:
-
☐ Define your market boundaries clearly (no fuzzy edges)
-
☐ Use multiple data sources (don’t just trust one report)
-
☐ Try both top-down and bottom-up approaches
-
☐ Compare results and investigate differences
-
☐ Document your assumptions (you’ll forget them later)
-
☐ Test key variables to see how sensitive your results are
-
☐ Update regularly as you get new data
Advanced Market Sizing Techniques That Actually Work
Once you’ve got the basics down, these techniques can make your analysis way more accurate. They take more effort, but they separate professional analysis from amateur guesswork.
Data Triangulation (Or: Don’t Put All Your Eggs in One Basket)
I once spent three weeks building this beautiful model for a client, complete with fancy spreadsheets and color-coded assumptions. Then we talked to five actual customers and realized we’d been targeting the wrong market entirely. Sometimes the best market research is just picking up the phone.
Triangulation means checking your numbers against multiple sources:
-
Primary research (surveys, interviews, focus groups)
-
Industry reports and government data
-
Digital signals (web traffic, app downloads, social media)
-
Financial data (public company revenues, funding announcements)
Each source has biases. Industry reports might inflate numbers to justify their research costs. Surveys can be skewed by who actually responds. Digital data might miss offline behavior.
When multiple sources point to similar conclusions, you can feel more confident. When they’re all over the place, you need to dig deeper.
Dynamic Market Modeling (Because Markets Don’t Stand Still)
Static market sizing gives you a snapshot, but markets are constantly moving. Dynamic models update automatically as new data comes in and adjust estimates based on changing conditions.
Key components include:
-
Automated data feeds from multiple sources
-
Adjustments for seasons and trends
-
Scenario modeling for different growth assumptions
-
Regular validation and recalibration
For example, a dynamic model for rideshare might incorporate real-time gas prices, population growth, public transit changes, and competitor pricing. Just like continuously learning systems in AI adapt to new patterns, dynamic market models evolve with changing conditions.
The investment pays off when you’re making ongoing strategic decisions rather than just one-time market entry choices.
Getting Your Hands Dirty: Practical Execution Steps
Alright, enough theory. Here’s the actual math you need to know. Don’t worry—it’s not scary calculus or anything. Just basic arithmetic with a purpose.
Essential Market Sizing Formulas (That Actually Make Sense)
Here’s the math (seriously, it’s not intimidating):
Basic Market Size:
TAM = Total Population × Average Spend per Person
Market Penetration:
SAM = TAM × Market Penetration Rate
Revenue Potential:
Revenue Potential = Market Size × Average Price × Purchase Frequency
Growth Rate:
Growth Rate = (This Year – Last Year) / Last Year × 100
Customer Lifetime Value Market Sizing:
Market Value = Number of Customers × Average Customer Lifetime Value
The key is knowing which formula fits your situation. B2B markets work differently than B2C. Subscription businesses need different approaches than one-time purchases.
Pro tip from consulting interviews: use round numbers to keep calculations manageable. Use 320 million for US population instead of 328 million, as recommended by Hacking the Case Interview. It reduces errors while keeping reasonable accuracy.
Segmentation (Or: Why Generic Numbers Don’t Help Anyone)
Generic market sizing misses the good stuff. Segmentation shows you where the real opportunities are by accounting for how different customers actually behave.
Think about:
-
Demographics (age, income, company size)
-
Geography (urban vs rural, regional differences)
-
Behavior (how often they buy, price sensitivity)
-
Psychographics (values, lifestyle, attitudes)
Calculate market size for each segment separately. A productivity software company might segment by company size:
-
Enterprise (1000+ employees): High budgets, complex sales
-
Mid-market (100-999 employees): Moderate pricing, shorter sales cycles
-
Small business (<100 employees): Price-sensitive, want self-service
Each segment has different dynamics, competition, and growth potential. When you add up segmented analysis, you get much more actionable insights than broad calculations.
Real SaaS Example:
A cloud accounting software company segments their market:
-
Freelancers: 15M potential × $10/month × 12 months × 5% penetration = $90M
-
Small businesses: 6M potential × $50/month × 12 months × 8% penetration = $288M
-
Mid-market: 200K potential × $200/month × 12 months × 3% penetration = $144M
-
Total market: $522M annually
|
Formula Type |
When To Use It |
Key Numbers You Need |
Real Example |
|---|---|---|---|
|
Basic Market Size |
Simple consumer stuff |
Population × Average Spend |
100M people × $50/year = $5B market |
|
Penetration-Based |
New technology adoption |
TAM × Penetration × Price |
$10B × 15% × $100 = $150M |
|
Unit Economics |
Subscriptions/SaaS |
Customers × Monthly Revenue × 12 |
50K × $20/month × 12 = $12M |
|
Replacement Cycle |
Stuff that wears out |
Total Units ÷ Years Until Replacement |
300M phones ÷ 3 years = 100M annual |
Data Sources That Won’t Let You Down
Your market sizing is only as good as your data. I’ve learned to mix different sources and understand what each one’s good for (and what it’s not).
Primary Research (AKA: Actually Talking to People)
Primary research gives you data that doesn’t exist anywhere else. You’re getting information straight from your target market instead of relying on someone else’s interpretation.
Here’s how to do it right:
-
Design your sample so it actually represents your market
-
Write survey questions that don’t lead people to the answer you want
-
Get enough responses to actually mean something
-
Analyze results with confidence intervals (fancy way of saying “how sure are we?”)
Survey design is crucial. Bad questions give you bad data. I always test surveys with a small group before going wide.
Sample size matters for credibility. You need enough responses to draw real conclusions, but the exact number depends on your market size and how confident you want to be.
Interviews give you deeper insights than surveys but take more time. Focus groups can reveal unexpected dynamics but watch out for groupthink. Mix multiple methods when you can.

Secondary Data (The Stuff That Already Exists)
Secondary data gives you baseline information without the time and cost of primary research. Government stats, industry reports, and academic research provide broad context.
Good secondary sources include:
-
Government agencies (Census, Bureau of Labor Statistics)
-
Industry associations and trade groups
-
Research firms (Gartner, Forrester, McKinsey)
-
Public company reports and investor presentations
-
Academic research and peer-reviewed studies
But evaluate sources carefully. Who paid for the research? What methodology did they use? How recent is the data? Industry reports funded by companies in that industry might overestimate market size to make their sector look more attractive.
Cross-reference multiple secondary sources when possible. If three different research firms give similar market size estimates using different methods, you can feel more confident in those numbers.
Key baseline numbers to remember: US population of 320 million, household size of 2.5 people, and median household income of $50,000, as noted by market sizing preparation resources. These help anchor your calculations and keep them realistic.
Digital and Alternative Data Sources (The New Stuff)
Digital data shows you what people actually do, not what they say they do. Web traffic, social media engagement, app downloads, and location data reveal real behavior patterns.
Useful digital sources include:
-
Google Trends for search volume and interest patterns
-
Social media analytics for engagement and sentiment
-
App store data for downloads and user ratings
-
Web scraping for pricing and competitive intelligence
-
Mobile location data for foot traffic and behavior
But be careful with interpretation. High search volume doesn’t automatically mean market demand. Social media buzz might not represent your actual customers. App downloads don’t equal active users or revenue.
The advantage is timeliness and scale—you can analyze millions of data points in real-time instead of waiting months for survey results. The challenge is separating signal from noise. When doing competitive analysis, comparing tools like Ahrefs vs SEMrush can provide valuable signals about market demand and competitive positioning.
Complex Markets and Edge Cases
Real markets don’t always fit neat formulas. Platform businesses, emerging tech, and multi-sided markets need creative approaches that traditional methods can’t handle.
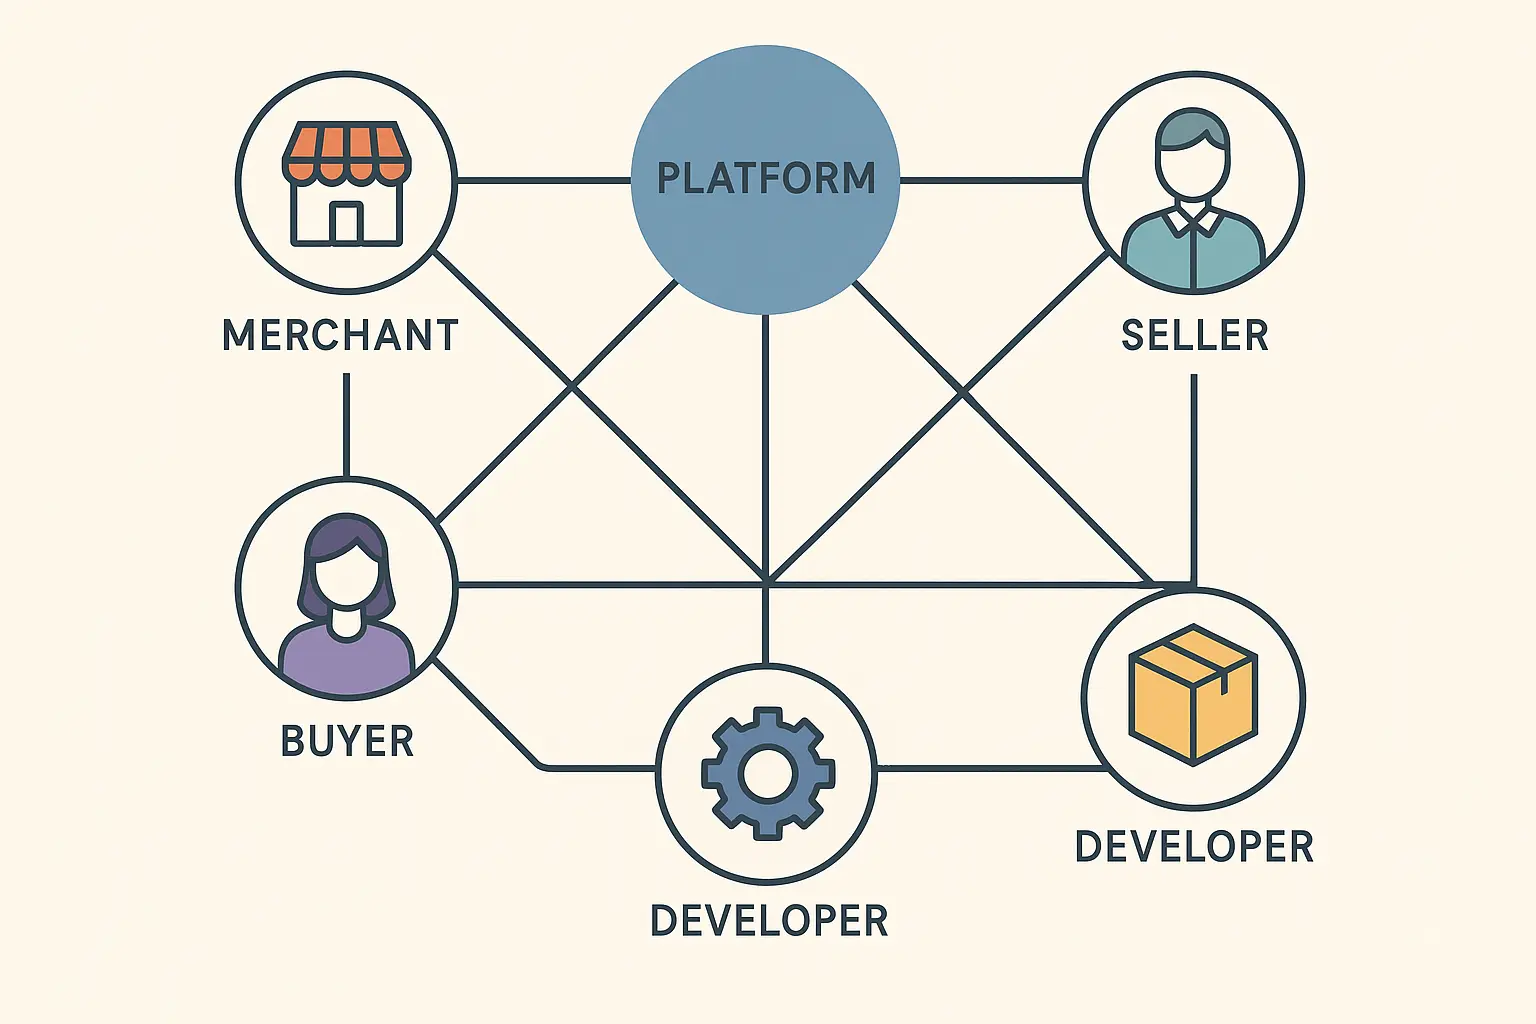
Multi-Sided and Platform Markets (Where Everything Gets Complicated)
Platform businesses connect different user groups—think Uber (drivers and riders), Airbnb (hosts and guests), or LinkedIn (job seekers and recruiters). You can’t size these markets like traditional single-sided businesses.
Each side represents a separate market:
-
Different value propositions and pricing
-
Different adoption rates and growth patterns
-
Different competitive landscapes and barriers
-
Network effects that amplify value as each side grows
For rideshare, you need to size both the driver supply market (people willing to drive for income) and passenger demand market (people needing transportation). The interaction between these creates the total platform value.
Network effects complicate everything. More drivers attract more passengers, which attracts more drivers. This creates exponential rather than linear growth that traditional formulas don’t capture.
Model platform markets by sizing each side separately, then analyzing how they interact and where supply meets demand at sustainable prices.
Emerging Technology Markets (Where You’re Flying Blind)
Emerging markets are the ultimate challenge—no historical data, unclear adoption patterns, and rapidly changing competitive landscapes.
Here’s the process:
-
Find similar historical technology adoptions to use as guides
-
Map out potential customer journey and conversion funnels
-
Model different adoption scenarios (conservative, moderate, aggressive)
-
Build in regular revision cycles as real data becomes available
For autonomous vehicles, you might look at historical adoption of major transportation innovations (cars replacing horses, GPS navigation, ride-sharing), understand customer decision-making, and model scenarios based on regulatory approval, technology maturity, and consumer acceptance.
Proxy methods become essential. If you’re sizing VR fitness, you might use traditional fitness equipment sales, video game adoption rates, and home fitness trends to triangulate potential demand.
Scenario modeling is crucial. Build conservative, moderate, and aggressive adoption scenarios with different assumptions about tech maturity, regulations, and competitive dynamics.
The cybersecurity market shows how emerging tech creates new categories. According to recent analysis, “the global grid cybersecurity market size was calculated at USD 9.26 billion in 2025 and is predicted to increase to approximately USD 29.70 billion by 2034, expanding at a CAGR of 13.82%” Precedence Research. This demonstrates how new security needs in critical infrastructure create entirely new addressable markets.
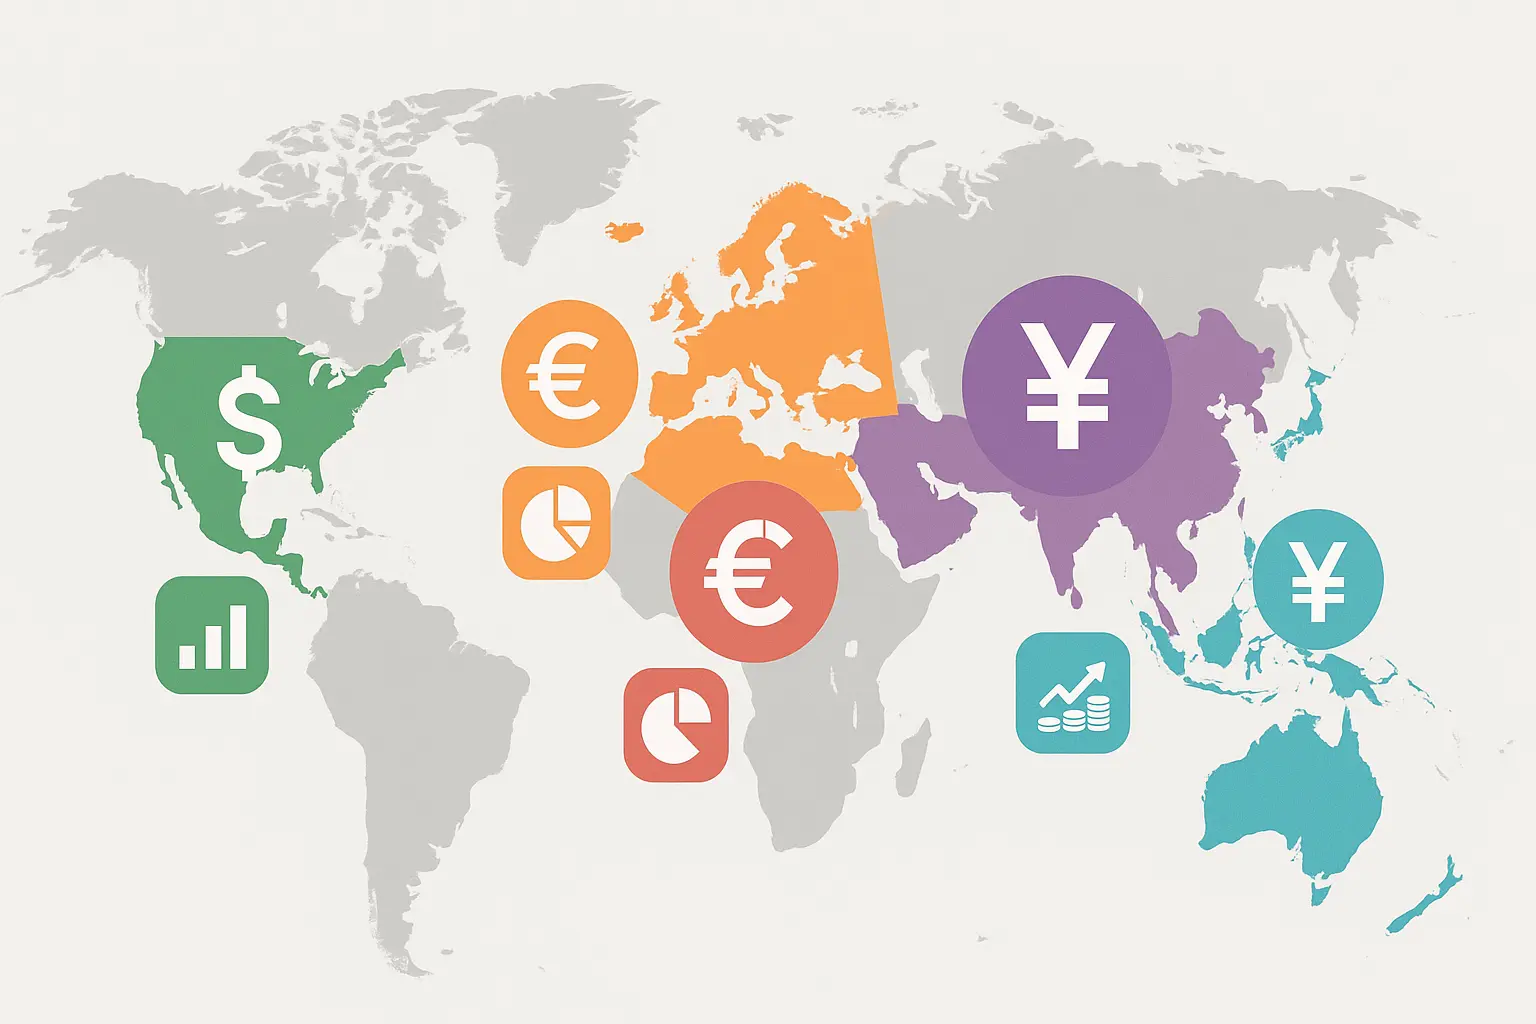
International Market Sizing Challenges
Taking market sizing international adds complexity that domestic analysis doesn’t face. Cultural preferences, economic conditions, and regulations vary dramatically across markets.
Currency and Economic Reality Checks
Raw currency conversion doesn’t tell the whole story. A $100 product might be affordable for middle-class US consumers but luxury-priced in many other markets.
Purchasing Power Parity (PPP) adjustments give you more accurate sizing by accounting for local cost of living and spending power. A market that looks small in dollar terms might be substantial when adjusted for local purchasing power.
Economic factors to consider:
-
GDP per capita and income distribution
-
Local pricing expectations and willingness to pay
-
Currency stability and exchange rate trends
-
Economic growth rates and future projections
-
Government policies affecting consumer spending
For subscription software, you might need to cut pricing by 50-80% in emerging markets to achieve similar adoption rates. This dramatically affects revenue calculations even if user numbers stay the same.
Cultural and Regulatory Curveballs
Cultural preferences can make or break your assumptions. Products that work in one market might face resistance in others due to cultural values, usage patterns, or aesthetic preferences.
Regulations create hard limits on market size. Data privacy laws, content restrictions, licensing requirements, and import regulations can eliminate entire market segments or require major product changes.
Market maturity affects adoption rates and competitive dynamics. Entering a mature market with established competitors requires different strategies and market share assumptions than pioneering a new category.
Research local conditions through:
-
In-country partnerships and local expertise
-
Regulatory analysis and compliance requirements
-
Cultural research and consumer behavior studies
-
Competitive landscape and market positioning analysis
-
Distribution channel availability and effectiveness
Don’t assume your domestic success translates directly. Each market needs separate analysis with local context and constraints.
Real International E-commerce Example:
A US online retailer sizing Europe:
-
Germany: €50B e-commerce market × 2% realistic penetration = €1B opportunity
-
France: €45B market × 1.5% penetration (higher competition) = €675M opportunity
-
UK: £40B market × 3% penetration (language advantage) = £1.2B opportunity
-
Reality check: GDPR compliance costs reduce margins by 15%
-
Currency risk: Brexit volatility affects UK projections ±20%
International Entry Checklist:
-
☐ Research local regulations and compliance costs
-
☐ Analyze purchasing power and local pricing expectations
-
☐ Study cultural preferences and consumer behavior
-
☐ Evaluate competitive landscape and market maturity
-
☐ Assess distribution channels and partnership opportunities
-
☐ Calculate currency risk and exchange rate impacts
-
☐ Identify market entry barriers and mitigation strategies
How The Marketing Agency Transforms Market Analysis Into Growth
Market sizing becomes really powerful when it drives actual marketing decisions and growth strategies. At The Marketing Agency, we don’t just calculate market sizes—we use that analysis to identify the highest-value opportunities and optimize your marketing investment.
Our approach starts with comprehensive market analysis during our Discovery Call and Strategy Questionnaire process. We’re essentially doing real-time market sizing for your specific business, analyzing your current position and identifying untapped segments with the highest revenue potential.
This analysis directly informs our service recommendations. When we find large, underserved segments with high lifetime value, we might recommend leading with SEO for long-term market capture. For markets showing immediate opportunity but high competition, PPC becomes the priority for rapid penetration.
We leverage the best SEO analysis tools to validate market opportunities and competitive positioning, ensuring our market sizing translates into measurable results.
Our systems continuously analyze market dynamics in real-time, adjusting targeting and budget allocation as conditions evolve. This transforms market sizing from a quarterly planning exercise into a continuous competitive advantage.
When developing content strategies, we apply market sizing principles to identify how to come up with blog topics that address the largest market segments while maintaining competitive differentiation.
Market sizing importance in strategic planning spans industries. Recent analysis shows that “market sizing in the MedTech sector estimates the total revenue potential or demand for a device or diagnostic solution, helping companies understand total addressable market (TAM), serviceable available market (SAM), and serviceable obtainable market (SOM)” IQVIA. This demonstrates how proper market analysis guides critical investment and strategic decisions across sectors.

Ready to turn your market opportunity into measurable growth? We can discuss how our data-driven market analysis can identify your highest-value opportunities and optimize your marketing strategy accordingly.
Final Thoughts
Look, market sizing isn’t rocket science, but it’s not guesswork either. It’s somewhere in between—like cooking without a recipe when you kind of know what you’re doing.
The methodologies I’ve covered give you the tools for credible market analysis, but remember that this is as much art as science. Your assumptions, data sources, and approach all influence the final numbers. The goal isn’t perfection—it’s building a reasonable, defensible estimate that helps you make better decisions.
Here’s what no business school teaches you: sometimes the best market sizing comes from standing in a Starbucks for an hour and counting how many people buy the thing you’re trying to sell.
When preparing for interviews or business planning, having a structured framework becomes essential. Market sizing cases test your ability to break down complex problems systematically. Sample questions might ask you to estimate the market for food delivery apps in NYC or calculate the addressable market for enterprise software.
Regular practice through market sizing drills helps you develop intuition for reasonable estimates and common patterns. Even hard questions become manageable when you understand they’re really testing your analytical thinking and business judgment.
For those seeking market sizing questions with answers, remember that methodology matters more than exact numbers. Two analysts might reach different conclusions using valid approaches, and that’s fine as long as the reasoning is sound.
Start with the basics: understand TAM, SAM, and SOM, master both top-down and bottom-up approaches, and always check your findings with multiple data sources. As you gain experience, add advanced techniques like dynamic modeling and segmentation to improve accuracy and insights.
Most importantly, treat market sizing as an ongoing process, not a one-time exercise. Markets evolve, customer behaviors shift, and competitive landscapes change. Your analysis should evolve too.
Here’s a practical example that brings it all together: A startup developing AI-powered recruiting software might find a TAM of $15B (global HR tech market), SAM of $2B (mid-market companies in English-speaking countries), and SOM of $60M (realistic 3% penetration over 5 years). This shows how the framework scales from broad opportunity to specific business targets.
Quick reality check: If your market sizing shows you’ll capture 20% market share in year one, you’re probably being too optimistic. Most successful startups are thrilled to get 1-2% in their first few years.