


Look, I’m gonna be real with you here. Every minute, people watch 139 million Instagram Reels. And you’re seeing basically none of that traffic. So you Google “free Instagram views” at 11pm on a Tuesday, because surely there’s a hack everyone else knows about, right?
I’ve audited over 200 Instagram accounts this year, and the pattern is always the same. Creators chase free views like they’re chasing a high. They watch their view counter climb and feel like they’re finally making progress. Meanwhile, their engagement rate is tanking, Instagram’s algorithm is quietly throttling their reach, and they’re training themselves to optimize for metrics that generate exactly zero dollars.
Here’s what nobody tells you: free Instagram views aren’t just useless. They’re actively destroying your account.
Table of Contents
-
The Real Currency Behind Instagram Views
-
What “Free” Actually Means (Spoiler: You’re Still Paying)
-
Why High View Counts Tank Your Engagement Rate
-
What Instagram’s Algorithm Actually Tracks (It’s Not Views)
-
When Free Views Signal Low-Quality Content
-
The Psychological Trap Nobody Talks About
-
What to Do Instead
-
How to Audit Your Current Strategy
-
Building Something That Actually Converts
TL;DR
Short version: Free Instagram views come from disengaged audiences that tank your engagement rate. Instagram’s algorithm doesn’t care about view counts anyway (it cares about completion rate, saves, and shares). High views with low engagement tell the platform your content is garbage, which kills your organic reach. The psychological focus on views distracts from metrics that actually make you money. Strategic content for smaller, targeted audiences beats mass view accumulation every time. Track your engagement patterns to see if your strategy is sustainable. Quality views from invested followers create compounding returns through algorithm favorability.
The Real Currency Behind Instagram Views
Okay, real talk: views aren’t the achievement. I know they feel like it. Watching that counter climb hits different. But Instagram? Instagram sees views as data. That’s it. Every view tells the algorithm something about whether your content deserves to be shown to more people.
And here’s the part that sucks: high view counts can actually tell the algorithm your content is garbage.
According to Hootsuite’s research, Reels is Instagram’s fastest-growing feature, offering enterprise brands the highest engagement rates among all post types. But (and this is crucial) the platform only prioritizes video content when it demonstrates genuine audience connection through behavioral signals beyond simple view counts.
Views as Data Points, Not Destinations
Every view generates metadata. How long did someone watch? Did they replay sections? Did they exit immediately or watch through to the end? Instagram captures all of it, and that behavioral data matters exponentially more than the binary fact that a view occurred.
I had a client last month. Let’s call her Maya because I can’t use her real name. She was getting 15,000 views per workout tutorial. Solid numbers, right? Except most viewers bounced after 3 seconds when they realized it wasn’t what they expected. Meanwhile, another client was pulling maybe 2,000 views per tutorial, but 70% of viewers watched the entire 45-second video and 15% replayed it to follow along with the exercises.
Guess which one Instagram started pushing harder?
The platform doesn’t reward you for accumulating free views. It rewards you for creating content that generates specific behavioral patterns from viewers. High view counts without those patterns? You’ve just told Instagram your content isn’t worth showing to more people.
The Completion Rate Reality
Most creators obsess over getting eyes on their content. Few obsess over keeping those eyes engaged through the final second.
Completion rate (the percentage of viewers who watch your entire video) is one of Instagram’s most powerful quality signals. A Reel with 1,000 views and an 80% completion rate will outperform a Reel with 10,000 views and a 20% completion rate in future algorithmic distribution.
Sometimes fewer Instagram views from the right people beat massive view counts from disinterested audiences. The algorithm interprets low completion rates as evidence that your content missed the mark, regardless of how many people initially clicked.
This is where things get messy for creators trying to game the system. Many discover this reality when they examine their Instagram engagement rate calculations, which reveal the disconnect between view counts and actual audience connection. Understanding how to get views that actually convert requires focusing on these deeper engagement metrics rather than surface-level numbers.
What “Free” Actually Means (Spoiler: You’re Still Paying)
Free services don’t operate on generosity. They operate on exchange models where you’re trading something valuable, even if you don’t recognize what.
The Exchange You’re Making Without Realizing It
Most free Instagram views services work through engagement pods, follow-for-follow networks, or bot traffic. You’re either providing your own engagement to other users’ content, exposing your account to follow/unfollow schemes, or accepting views from fake accounts. Each option carries costs that compound over time.
|
Free View Method |
What You Trade |
Hidden Cost |
Long-Term Impact |
|---|---|---|---|
|
Engagement Pods |
Your time engaging with unrelated content |
2-5 hours weekly + diluted account theme |
Algorithm confusion about your niche |
|
Follow Networks |
Account credibility via follow/unfollow patterns |
Damaged follower ratio + suspicious activity flags |
Reduced organic reach |
|
Bot Traffic |
Account security and algorithmic trust |
Penalty risk + suppressed distribution |
Possible shadow ban |
|
View Exchange Apps |
Personal data + app permissions |
Privacy exposure + spam risk |
Account vulnerability |
Engagement pods force you to spend hours engaging with content outside your niche, diluting your own account’s thematic consistency in Instagram’s eyes. Follow networks attract users who’ll unfollow within days, tanking your follower-to-following ratio. Bot traffic? That’s the fastest route to algorithm penalties and reduced organic reach.

The promise of free Instagram Reels views through these methods might seem appealing, but you’re paying with something far more valuable than money: your account’s credibility and algorithmic standing.
How Instagram Identifies and Penalizes Artificial Inflation
Instagram’s detection systems have evolved significantly. The platform doesn’t just look at whether an account is fake (though it does that too). It analyzes engagement patterns, timing, and behavioral consistency across your audience.
When 500 accounts suddenly view your content within minutes, all from similar geographic locations or with similar account characteristics, Instagram’s systems flag it. The penalty isn’t always immediate account suspension. More often, it’s a quiet reduction in your content’s distribution to real users.
A recent analysis published in Daily Illini examined providers like Viralyft, GetViral, and Buzzoid, noting that while some services claim to deliver “real” views from active accounts, Instagram’s systems have become adept at identifying artificial patterns. The report emphasizes that Instagram often detects fake activity and removes those views, with the platform becoming increasingly sophisticated at identifying artificial inflation even from providers claiming to deliver legitimate engagement.
You might not even notice the penalty at first. Your inflated view counts from artificial sources mask the fact that your organic reach has been throttled. By the time you realize real users aren’t seeing your content anymore, you’ve wasted weeks or months building on a compromised foundation.
Why High View Counts Tank Your Engagement Rate
Engagement rate gets calculated by dividing total engagements (likes, comments, shares, saves) by total reach or views, then multiplying by 100. Simple math, massive implications.
The Engagement Rate Formula Working Against You
When you artificially inflate your view count, you’re dramatically increasing the denominator without increasing the numerator. A video with 100 views and 20 likes has a 20% engagement rate. That same video with 1,000 inflated views and 20 likes? Now it’s 2%.
Instagram’s algorithm uses engagement rate as a quality signal. Lower engagement rates suggest your content isn’t resonating, which triggers reduced distribution. You’ve essentially told the platform your content is ten times less engaging than it actually is.
This is where services promising 100 free Instagram views become particularly dangerous. They might boost your numbers temporarily, but they’re simultaneously destroying the metric that determines your future reach.
Why Brands Care More About Engagement Than Views
Brand partnerships evaluate creators based on engagement rate, not view counts. Experienced marketing teams know that views can be manipulated easily while genuine engagement remains difficult to fake at scale.
A beauty brand looking for micro-influencers to promote their new skincare line evaluates two creators. Creator A has 50,000 average views per Reel with a 1.8% engagement rate. Creator B has 8,000 average views per Reel with a 12% engagement rate.
The brand chooses Creator B because their 960 engaged viewers (who actively like, comment, save, and share) represent a more invested audience than Creator A’s 900 scattered engagements across a much larger but disinterested viewership. Creator B’s audience demonstrates purchase intent through their engagement behavior, while Creator A’s numbers suggest artificial inflation or content that fails to connect.
Your inflated view counts aren’t impressing the people who cut checks. They’re actively harming your perceived value in the creator economy.
What Instagram’s Algorithm Actually Tracks (It’s Not Views)
Instagram’s algorithm evaluates hundreds of signals, but several carry disproportionate weight in determining whether your content gets distributed broadly.
Ranking Signals That Determine Your Reach
Saves rank among the most powerful signals. When someone saves your content, they’re telling Instagram it has lasting value worth revisiting. Shares (particularly sends via DM) signal that your content is worth recommending to others. Replays indicate your content delivers value that warrants multiple viewings.
Notice what’s missing from that list?
Views.
Raw view counts function as a baseline metric, but they don’t carry algorithmic weight in distribution decisions. The algorithm cares what people do after viewing, not that they viewed at all.

This is why chasing any arbitrary view target misses the point entirely. You’re optimizing for a metric the algorithm barely considers.
The Three-Second Rule and Why It Matters
Instagram evaluates whether viewers watch at least three seconds of your video. This threshold determines whether a view counts at all, but more importantly, it’s the first quality checkpoint in the algorithm’s evaluation process.
Content that can’t retain viewers past three seconds gets categorized as low-quality and receives minimal distribution. You could have 10,000 total views, but if 8,000 of those viewers bounced before three seconds, the algorithm interprets your content as failing to deliver on its promise.
Here’s where free Instagram views without genuine engagement destroy your performance. Bot accounts and disengaged pod members often don’t watch past the minimum threshold (or skip through content to fulfill pod requirements quickly). You’re accumulating views that actively signal poor content quality to the platform.
Comment Quality Over Quantity
Instagram’s natural language processing systems analyze comment content, not just comment counts. Five thoughtful comments that spark conversation carry more algorithmic weight than fifty emoji-only comments.
Engagement pods typically generate low-quality comments. “Great post!” “Nice content!” “🔥🔥🔥” These patterns are easily identifiable and contribute minimally to your algorithmic performance. Worse, they train your actual followers that shallow engagement is the norm, reducing the likelihood that they’ll leave substantive comments.
The algorithm wants to surface content that generates genuine community interaction. Pod comments signal the opposite.
When Free Views Signal Low-Quality Content
Instagram’s systems don’t evaluate individual views in isolation. They analyze patterns across your audience’s behavior, looking for consistency with organic growth trajectories.
Behavioral Pattern Recognition
Organic growth follows predictable patterns. Views accumulate gradually, with natural peaks corresponding to when your followers are most active. Engagement trickles in over hours or days. Geographic distribution matches your follower base. Viewer account ages, activity levels, and following patterns show diversity.
Free Instagram views services create the opposite pattern. Views spike unnaturally. Engagement arrives in clusters. Geographic distribution shows suspicious concentration. Viewer accounts often share similar characteristics (new accounts, low follower counts, high following counts, minimal content). Every deviation from organic patterns adds evidence to Instagram’s assessment that something’s wrong.
Organic vs. Artificial View Pattern Checklist
Use this checklist to evaluate whether your view sources appear organic to Instagram’s detection systems:
-
Views accumulate gradually over 24-72 hours rather than spiking in the first hour
-
Peak viewing times align with your followers’ typical active hours
-
Geographic distribution of viewers matches your existing follower base locations
-
Viewer accounts show varied follower counts (mix of small, medium, and large accounts)
-
Viewer accounts have diverse posting histories and account ages
-
Engagement (likes, comments, saves) arrives sporadically, not in synchronized batches
-
Comment quality varies and references specific content elements
-
View-to-engagement ratio remains consistent with your historical performance
-
No sudden changes in audience demographics or interests
-
Follower growth correlates proportionally with view increases
Look, this isn’t exhaustive. Use common sense.
The Shadow Ban Reality
Shadow banning (Instagram calls it “content suppression”) doesn’t mean your account gets deleted or suspended. It means your content stops appearing in hashtag feeds, Explore pages, and even in some followers’ feeds.
You can still post. Your followers can still find your content if they visit your profile directly. But the algorithmic distribution that drives growth? It’s been throttled or eliminated entirely.

Most creators don’t realize they’ve been shadow banned until weeks later when they notice their organic reach has collapsed. The platform would rather suppress potentially manipulated content than risk degrading user experience by showing low-quality posts in recommendation feeds.
The Psychological Trap Nobody Talks About
View counts trigger dopamine responses in your brain. Watching numbers climb feels like progress, even when those numbers don’t correlate with business outcomes.
Why Your Brain Lies to You About Growth
This psychological response creates a dangerous feedback loop. You post content, see views increase, feel validated, and repeat the same approach regardless of whether it’s building toward your actual goals. The dopamine hit from rising view counts becomes the goal itself, replacing whatever business objective you originally had.
Free views services exploit this psychological vulnerability. They provide the dopamine hit without the underlying value, training you to optimize for feelings rather than results. You’re essentially paying (even if not with money) to feel productive while accomplishing nothing.
The Comparison Trap That Distorts Your Strategy
You see other creators with massive view counts and assume they’ve figured something out that you haven’t. This assumption drives you toward tactics (including free views services) that promise to close the gap.
What you don’t see: their engagement rate, their conversion rate, their business outcomes, or whether they’re using the same artificial inflation tactics you’re considering. You’re comparing your behind-the-scenes reality to someone else’s highlight reel, then making strategic decisions based on incomplete information.
The creators building sustainable businesses aren’t optimizing for view counts. They’re optimizing for the metrics that actually generate revenue.
What to Do Instead
Stop trying to reach everyone. Start trying to deeply connect with someone specific.
The Micro-Targeting Approach
Create content for a precisely defined audience segment. Use niche hashtags (5,000 to 50,000 posts, not millions). Engage genuinely with 10-15 accounts in your niche daily. Respond to every comment on your posts within the first hour. This approach generates fewer initial views but dramatically higher engagement rates.
Instagram’s algorithm rewards content that resonates deeply with a specific audience. A video that gets 500 views with 40% engagement will receive more future distribution than a video with 5,000 views and 2% engagement. You’re building algorithmic favorability that compounds over time.
The Hook-Value-CTA Framework
Your first three seconds determine whether viewers stay. Your middle section determines whether they engage. Your final moment determines whether they take action.
Hook with pattern interruption (visual, audio, or conceptual). Deliver value that matches the hook’s promise. End with a specific, low-friction call to action (comment a specific word, share with someone who needs this, save for later).
This structure optimizes for the metrics Instagram cares about: completion rate, saves, shares, and comments. You’re creating content that the algorithm wants to distribute because it generates positive user experiences.
Hooks that work: “I spent $5K learning this so you don’t have to” or “This mistake cost me 6 months of growth” or “Nobody talks about this but it’s the most important thing.” Your first frame should make people think “wait, what?” Not “oh, another tips video.”
Collaboration Over Competition
Partner with creators at similar follower counts in complementary niches. Create content together, tag each other, and introduce your audiences to each other.
This strategy exposes your content to audiences that are predisposed to engage (they already follow someone with similar content preferences). The views you gain come from real accounts with genuine interest, generating the behavioral signals that improve your algorithmic performance.
DM 5 creators at your follower count this week. Propose a simple collab: you both make a Reel about the same topic and tag each other. That’s it. The best collabs are with creators in adjacent niches, not identical. Fitness + nutrition, not fitness + fitness.
How to Audit Your Current Strategy
Research from Inflact’s Profile Analyzer tool reveals that their platform tracks 13 key metrics including engagement rate, average user activity, posts per day/week/month, most popular posting time, most popular hashtags used, and audience interests. This comprehensive approach to analytics demonstrates that professional growth strategies require examining multiple data points simultaneously rather than fixating on any single metric like views.
The Engagement Rate Diagnostic
Calculate your engagement rate for your last 10 posts. Add up all likes, comments, shares, and saves, divide by total views, multiply by 100.
If your engagement rate is below 2%, you have a quality problem. Your views aren’t coming from invested audiences. If your engagement rate varies wildly between posts (one at 8%, the next at 1%), you’re likely experiencing algorithmic inconsistency caused by mixed quality signals.
Consistent engagement rates above 5% indicate healthy audience connection. The views you’re getting come from people who care about your content. That’s the foundation for sustainable growth.
For business/educational content, aim for 5-8% engagement rate. Under 3% means something’s wrong. Over 10% is exceptional. B2B creators: your engagement rate will always be lower. 3-4% is solid. Don’t compare yourself to lifestyle creators hitting 12%.
Follower Growth Pattern Analysis
Examine your follower growth over the past 90 days. Organic growth follows a relatively steady trajectory with gradual acceleration as your algorithmic favorability improves.
Sudden spikes followed by significant unfollows indicate artificial inflation (follow-for-follow schemes, engagement pods, or purchased followers). Flat growth despite increasing view counts suggests your views aren’t coming from your target audience. Steady growth that correlates with your posting consistency indicates healthy, organic expansion.
Your follower growth pattern tells you whether your views are attracting people who want to follow you or just passing through for artificial engagement exchanges.
Comment Quality Assessment
Read through your last 20 comments. Are they specific to your content, or could they be copied and pasted on any post?
Generic comments (“Great post!” “Love this!” “Amazing!”) without specific references to your content indicate engagement pod participation or bot activity. Thoughtful comments that reference specific elements of your content signal genuine engagement from invested viewers.
If more than 30% of your comments are generic, you’re accumulating views from disengaged sources that are hurting your algorithmic performance rather than helping it.
Building Something That Actually Converts
According to Hootsuite’s Instagram research, the overall best times to post on Instagram are 3 pm to 9 pm on Mondays, 5 am to 8 am and 3 pm to 7 pm on Tuesdays, and 5 pm to 7 pm on Thursdays. However, these general benchmarks matter far less than understanding your specific audience’s active hours. Check your Instagram insights (it tells you exactly when your followers are online) and post then.
Designing Content With Conversion Pathways
Every piece of content should move viewers toward a specific action that matters to your business goals. Views are entry points, not destinations.
Map out what you want viewers to do after watching. Visit your profile? Click a link? Comment with specific information? Purchase a product? Each goal requires different content design. A video optimized for profile visits needs a compelling bio preview in the caption. A video driving link clicks needs clear value articulation and explicit direction.
Most creators design content to be watched, then hope conversion happens accidentally. Strategic creators design content where conversion is the natural next step. The view count becomes less important than the percentage of viewers who take the intended action.
Content Conversion Pathway Template
Figure out what you actually want people to DO after watching. Not “engage.” Not “connect.” Like, literally what action? Write it down:
Content Goal: What business outcome does this content serve?
Target Viewer: Who specifically needs to see this?
Hook (0-3 seconds): What stops the scroll?
Value Delivery (middle section): What specific problem does this solve or insight does this provide?
Call-to-Action: What specific action should viewers take?
-
Primary CTA: _______________
-
Why they should act: _______________
-
Friction reducers: _______________
Success Metrics: How will you measure if this worked?
-
Views: _______________ (baseline awareness)
-
Engagement rate: _______________ (interest indicator)
-
Conversion action: _______________ (actual goal)
-
Conversion rate: _______________ (views to action percentage)
Follow-up: What happens after they take the action?
Yeah, this feels like homework. Do it anyway.
Segmenting Audiences Based on Viewing Behavior
Instagram provides data about who’s watching your content. People who watch 100% of your videos are more valuable than people who watch 20%, regardless of total view counts.
Create content specifically for your high-completion viewers. These are your invested audience members who’ll convert. Use Instagram’s “share to story” feature to create content that only gets seen by people who’ve engaged with your previous posts. This targets your most valuable viewers with conversion-focused content.
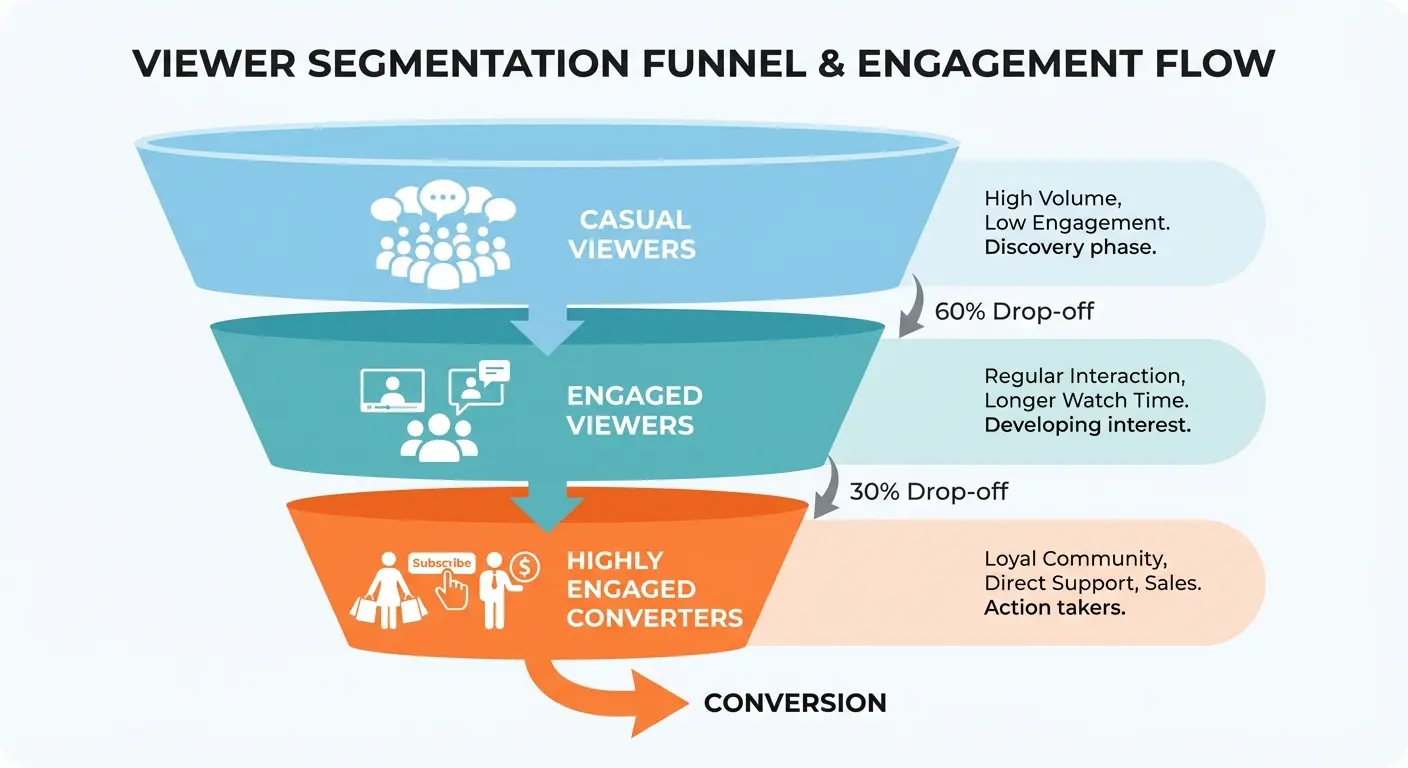
You’re building a funnel where casual viewers get awareness content, engaged viewers get value content, and highly engaged viewers get conversion content. View counts matter less than moving people through this progression.
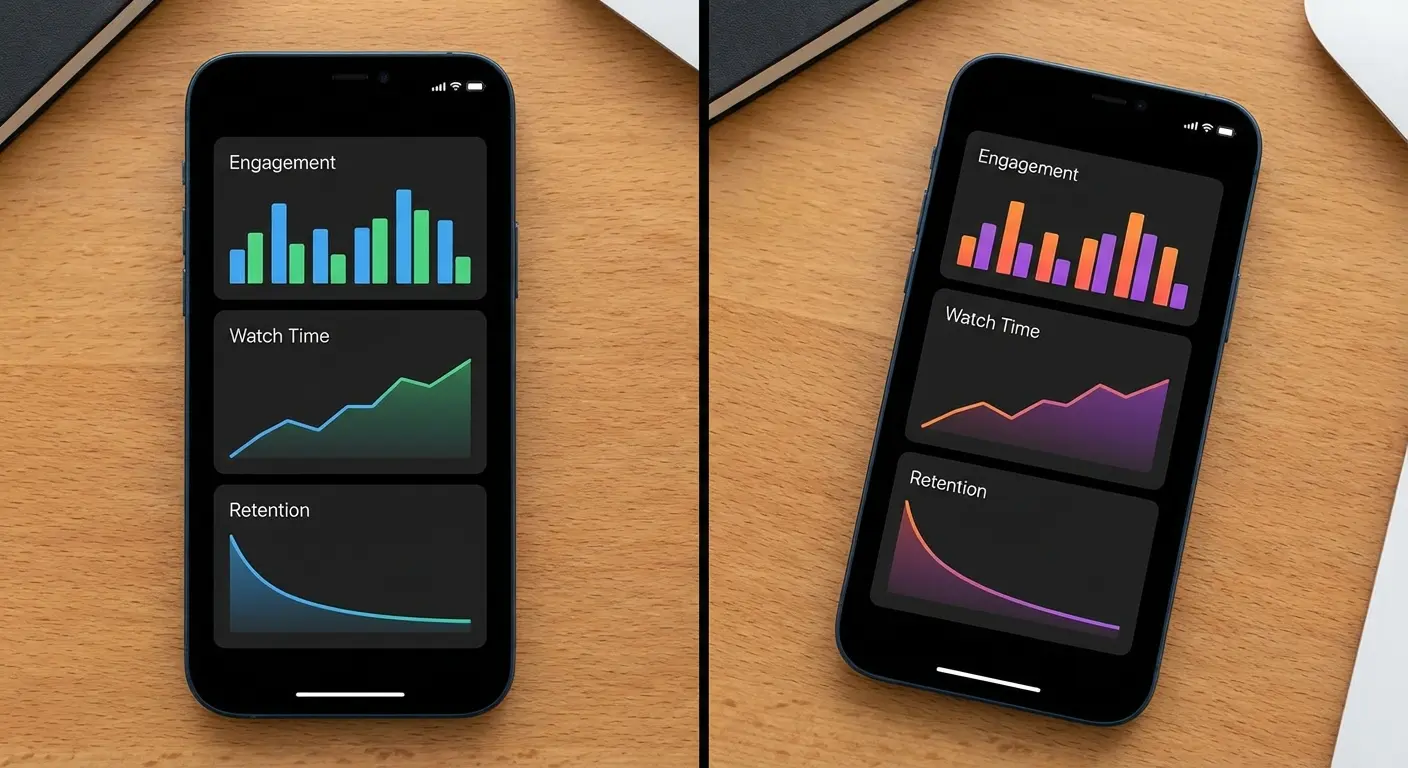
The Retention Analytics That Actually Matter
Instagram’s retention graphs show you exactly where viewers drop off. This data is exponentially more valuable than total view counts.
You can find your retention graphs in Instagram Insights. Tap any Reel, swipe up, scroll down. They’re the little line graphs that show when people dropped off.
If 60% of viewers drop off at the 5-second mark, your hook isn’t working. If viewers consistently rewatch a specific section, that content format resonates. If completion rates are high but engagement is low, your call-to-action needs work.
|
Retention Pattern |
What It Means |
Action to Take |
|---|---|---|
|
Drop-off at 0-3 seconds |
Hook failure |
Test different opening frames, audio, or text overlays |
|
Drop-off at 25-50% |
Value delivery mismatch |
Ensure middle content matches hook promise |
|
High completion, low engagement |
Weak or missing CTA |
Add clear, specific call-to-action in final seconds |
|
Multiple replays of specific section |
High-value segment identified |
Create more content in this format/topic |
|
Steady decline throughout |
Content too long or pacing issues |
Tighten editing, increase pace, or shorten duration |
|
Spike at end |
Strong finish/payoff |
Front-load this element in future content |
Use this data to iterate. Test different hooks, content structures, and CTAs. Track which variations improve retention and engagement. You’re building a content system optimized for the behaviors that drive algorithmic distribution and business outcomes, not just view accumulation.
Creating Feedback Loops Between Content and Conversion
Track which content types drive the most profile visits, link clicks, or purchases. Double down on those formats regardless of their view counts.
I had a meal prep coaching client who posted two types of Reels: quick recipe videos that got 12,000 average views with 2% engagement, and “meal prep mistake” educational content that got 3,500 average views with 9% engagement. When we tracked conversions, the recipe videos generated 8 profile visits and 1 consultation booking per post, while the educational content generated 45 profile visits and 7 consultation bookings per post.
Despite getting one-third the views, the educational content drove 7x more business outcomes. We shifted the content strategy to 70% educational content and 30% recipe videos, resulting in a 340% increase in monthly bookings despite average view count decreasing by 28%.
Would you rather have 10K views and make $0, or 1K views and make $500? Because that’s the actual tradeoff.
Your content strategy should evolve based on conversion data, not view counts. This requires tracking beyond Instagram’s native analytics (using link tracking, promo codes, or direct customer surveys), but it’s the only way to ensure your views contribute to your goals.
If a Reel hits 8%+ engagement rate, remake it with a different hook. Test variations. Double down on what works. Your best content from 6 months ago? Most of your current followers haven’t seen it. Repost it.
Making the Shift From Vanity to Value
A recent analysis published in Daily Illini examined providers like Viralyft, GetViral, and Buzzoid, noting that while some services claim to deliver “real” views from active accounts, Instagram’s systems have become adept at identifying artificial patterns. The report emphasizes that Instagram’s detection systems have evolved significantly and that the penalty isn’t always immediate account suspension but rather a quiet reduction in your content’s distribution to real users, making it difficult for creators to even realize they’ve been penalized until significant damage has occurred.
What Success Looks Like Without View Count Obsession
Success metrics shift when you stop optimizing for free Instagram views. You start measuring audience quality over audience size.
Track saves per post (indicates lasting value). Monitor DM responses to your CTAs (indicates genuine connection). Measure how many viewers visit your profile after watching (indicates curiosity and intent). Count how many followers consistently engage with multiple pieces of content (indicates invested community).
These metrics move slowly compared to view counts. You won’t see the same dopamine-triggering spikes. But they correlate with business outcomes in ways that free views never will. A creator with 500 engaged followers who save, share, and purchase has built something more valuable than a creator with 50,000 passive viewers.
One client went from 15K average views to 4K after we cleaned up her strategy. Her email list growth went from 20/month to 200/month. That’s what matters. Lower views, higher revenue. That’s the pattern I see over and over.
The Uncomfortable Middle Period
When you shift from artificial inflation to organic growth, your numbers will likely drop initially. This is uncomfortable but necessary.
Your inflated view counts disappear when you stop using free Instagram views services. Your engagement rate might improve, but your total views decrease. This feels like moving backward, but you’re removing the artificial metrics that were masking your true performance.
This period typically lasts 4-6 weeks as Instagram’s algorithm recalibrates its understanding of your content and audience . Your organic reach will gradually improve as the platform recognizes that your engagement patterns are now authentic.
Watching your view count drop when you stop using pods is going to feel terrible. Like you’re moving backward. You’re not. You’re removing fake metrics that were lying to you.
Give this approach 90 days before you decide it’s not working. You’ll probably see your view count drop in the first 2 weeks. That’s normal. Week 3 is when engagement rate starts climbing. By week 8, you should start seeing organic reach improve.
Building Confidence in a Quality-First Strategy
Document your metrics weekly. Track engagement rate, saves, shares, profile visits, and any business outcomes (email signups, sales, consultation bookings).
You’ll notice that even as view counts stabilize at lower numbers, these quality metrics improve. More importantly, you’ll see direct correlation between your content and your business goals. A post with 600 views that drives 15 email signups has generated more business value than a post with 6,000 free Instagram views that drives nothing.
This documentation provides evidence that your strategy is working, counteracting the psychological pull toward vanity metrics. You’re building proof that quality views outperform quantity.
If you’re using this quality-focused approach, 3-4 Reels per week is plenty. More than that and you’ll burn out trying to maintain quality. Don’t post just to post. One great Reel per week beats seven mediocre ones.
The Marketing Agency Solution
If you’re reading this and feeling overwhelmed by the complexity of building an authentic Instagram strategy while running your business, you’re not alone. Most business owners don’t have 15 hours a week to dedicate to content creation, engagement, and analytics optimization.
In my work with clients, I see this constantly: they knew something was wrong but didn’t have the bandwidth to diagnose the problem and rebuild their strategy from scratch. The pattern is always the same. They’re stuck in the free views trap, watching their engagement rates tank while their view counts climb.

That’s specifically why we built our Instagram management service around quality metrics rather than vanity metrics. We optimize for the engagement patterns and behavioral signals that drive business outcomes, and we provide transparent reporting on the metrics that matter (conversion rate, qualified leads, customer acquisition cost) rather than just showing you impressive-looking view counts.
Quick pitch: If you want help with this but don’t have 15 hours a week to figure it out, we do this for people. If you want to explore what a quality-first Instagram strategy could look like for your business without the trial-and-error phase, schedule a strategy call with us. We’ll audit your current performance, identify where artificial inflation might be hurting you, and map out a realistic path to sustainable growth.
So What Now?
Views aren’t inherently bad. They’re just incomplete.
The problem isn’t that you want more people to see your content. The problem is that “free Instagram views” has become shorthand for a strategy that prioritizes quantity over quality, immediate gratification over sustainable growth, and vanity metrics over business outcomes.
Instagram’s algorithm has evolved beyond simple view counting. It evaluates hundreds of behavioral signals to determine whether your content deserves distribution. When you optimize for free Instagram views without considering these signals, you’re playing a game by rules that no longer exist.
The creators and businesses winning on Instagram in 2024 aren’t the ones with the highest view counts. They’re the ones who’ve figured out how to generate genuine engagement from invested audiences, create content that the algorithm wants to distribute, and convert that visibility into business results.
Here’s what to do this week:
-
Calculate your engagement rate for your last 10 posts
-
Check your retention graphs and see where people drop off
-
Delete or archive any posts with sub-2% engagement rates
-
Post one piece of content optimized for saves, not views
Then check back in a week and see if your engagement rate moved. That’s the number that matters.
Look, you’re probably going to try the free views thing anyway. Most people do. I did. Just promise me you’ll track your engagement rate while you do it, so when it tanks (and it will) you’ll know why and can course-correct fast.
You can continue chasing free Instagram views and wondering why your engagement rate keeps dropping. Or you can shift your strategy toward the metrics that matter, accept that growth might feel slower initially, and build something sustainable.
The choice isn’t between high views and low views. It’s between artificial metrics that feel good but accomplish nothing and authentic engagement that builds a real business.
Your view count doesn’t define your success. What viewers do after watching
