Companies using data analytics are 5 times more likely to make faster decisions than their competitors, according to Statsig’s comprehensive analysis of product analytics. I was pulling an all-nighter prepping for a client presentation last year when I came across this stat. Honestly, I had to read it three times because it seemed too good to be true. But after digging into the actual research, I realized most companies are still making gut decisions while their competitors are eating their lunch with data.
Look, I’ve seen too many people waste months on flashy projects that look great on paper but teach you nothing useful. After working through dozens of these cases (and debugging more broken models than I care to admit), I’ve learned which ones actually teach you something versus which ones just waste your time.
Table of Contents
-
What Makes a Data Analytics Case Study Worth Your Time?
-
E-Commerce & Retail Analytics Powerhouses
-
1. Amazon Customer Segmentation & Recommendation Engine
-
2. Walmart Demand Forecasting
-
3. Zara Fast Fashion Trend Analysis
-
4. Target Pregnancy Prediction Model
-
5. Starbucks Store Location Optimization
-
-
Healthcare & Life Sciences Game-Changers
-
6. COVID-19 Spread Prediction Model
-
7. Hospital Readmission Risk Prediction
-
8. Pharmaceutical Drug Discovery Analytics
-
9. Medical Image Analysis for Diagnosis
-
10. Clinical Trial Optimization
-
-
Financial Services & Fintech Innovations
-
11. Credit Risk Assessment Model
-
12. Fraud Detection System
-
13. Algorithmic Trading Strategy
-
14. Insurance Claims Processing Optimization
-
15. Robo-Advisor Portfolio Optimization
-
-
Marketing & Digital Analytics Champions
-
16. Netflix Content Recommendation System
-
17. Google Ads Campaign Optimization
-
18. Social Media Sentiment Analysis
-
19. Email Marketing Personalization
-
20. Customer Journey Analytics
-
-
Operations & Supply Chain Analytics Leaders
-
21. Uber Dynamic Pricing Algorithm
-
22. Amazon Warehouse Optimization
-
23. FedEx Package Routing Optimization
-
24. Manufacturing Quality Control
-
25. Energy Grid Load Forecasting
-
-
How These Case Studies Stack Up Against Real-World Needs
-
Final Thoughts
TL;DR
-
Business relevance trumps technical complexity – choose case studies that align with your industry goals
-
Start with foundational cases (Target’s pregnancy prediction) before tackling advanced ones (Netflix’s recommendation engine)
-
Focus on end-to-end processes that cover data collection, cleaning, analysis, and presentation
-
Prioritize cases with measurable ROI – Amazon’s recommendation engine generates $1B+ annually
-
Interview-ready cases include credit risk assessment, fraud detection, and customer segmentation
-
Portfolio builders should showcase diverse skills across multiple industries and analytical techniques
-
Data accessibility matters – ensure you can actually work with the datasets
-
Complex cases (Uber’s dynamic pricing, Google Ads optimization) demonstrate real-time processing capabilities
What Makes a Data Analytics Case Study Worth Your Time?
Choosing the wrong data analytics case study is like learning to drive in a parking lot – technically you’re driving, but you’re not prepared for real traffic. Here’s what actually matters when picking case studies that’ll advance your career instead of just filling time.
The truth is, most case studies fall into one of three buckets: the ones that teach you foundational skills, the ones that make you look smart in interviews, and the ones that actually prepare you for the messy reality of working with data. The best ones do all three.
|
Criteria |
Beginner Level |
Intermediate Level |
Advanced Level |
|---|---|---|---|
|
Data Complexity |
Single source, clean datasets |
Multiple sources, some missing values |
Real-time streams, unstructured data |
|
Technical Skills |
Basic Python/R, SQL |
Machine learning, visualization |
Deep learning, big data tools |
|
Business Impact |
Clear, simple metrics |
Multiple KPIs, trade-offs |
Complex optimization, ROI modeling |
|
Time Investment |
1-2 weeks |
1-2 months |
3-6 months |
|
Portfolio Value |
Foundation building |
Skill demonstration |
Expertise showcase |
Business Relevance & Real-World Application
Your case study needs to mirror the actual problems you’ll solve in your target role. If you’re gunning for e-commerce jobs, studying energy grid forecasting won’t impress anyone during interviews. I learned this the hard way when I spent weeks perfecting a manufacturing optimization model, only to realize every job I wanted was in marketing analytics.
Industry alignment isn’t just about checking boxes – it’s about understanding the specific pain points that keep executives awake at night. E-commerce companies obsess over conversion rates and customer lifetime value. Healthcare organizations worry about patient outcomes and regulatory compliance. Financial services live and die by risk management and fraud prevention.
The best case studies involve multiple stakeholders with competing priorities. Real business problems are messy. Marketing wants to maximize reach, finance wants to minimize costs, and operations wants to maintain quality. Learning to navigate these tensions is more valuable than any algorithm.
Technical Depth & Skill Coverage
Here’s the thing about data complexity – it’s not just about having more columns in your dataset. Real complexity comes from integrating multiple data sources that were never meant to work together. Customer data lives in Salesforce, transaction data sits in some legacy system, and web analytics comes from Google Analytics. Making these systems talk to each other? That’s where the real work happens.
Most companies have their customer data scattered across 12 different systems that don’t talk to each other. You’ll need Python and scikit-learn, obviously. But good luck getting the clean data to actually run these algorithms on.
End-to-end process coverage separates the amateurs from the professionals. Anyone can run a Random Forest on the Titanic dataset. The real skill lies in figuring out what data you actually need, convincing three different departments to give it to you, cleaning the inevitable mess, and then explaining your results to people who think “correlation” and “causation” are the same thing.
Learning Objectives & Skill Development
Fair warning: if you’re just starting out, maybe don’t jump straight into building cancer detection models with deep learning. Start with something that won’t give you imposter syndrome nightmares. I’ve seen too many beginners burn out trying to tackle Netflix’s recommendation system when they can’t even explain logistic regression to their mom.
The dirty secret about “transferable skills”? They’re only transferable if you can tell the story right in interviews. Knowing collaborative filtering is great. Explaining how it solved a real business problem and increased revenue by 15%? That’s what gets you hired.
Interview preparation requires understanding which methodologies resonate with your target industry. Financial services interviews love credit risk and fraud detection cases. Tech companies focus on recommendation systems and A/B testing. Marketing roles emphasize customer analytics and campaign optimization. Know your audience.
E-Commerce & Retail Analytics Powerhouses
Retail generates some of the messiest, most valuable datasets in business. Every click, purchase, and return tells a story about customer behavior. But here’s what nobody tells you – most retail data is absolute chaos. Duplicate customer records, returns without receipts, inventory counts that don’t match reality. The companies that succeed aren’t the ones with perfect data; they’re the ones who can make sense of imperfect information.
1. Amazon Customer Segmentation & Recommendation Engine
Everyone talks about Amazon’s recommendation engine like it’s magic. It’s not. It’s just really, really good data science applied consistently over years. The unsexy truth? Most of the “magic” is in the data cleaning and feature engineering that nobody talks about.
Amazon’s dealing with an insane amount of data – we’re talking 500+ million transactions. And here’s the kicker: most of it is messy as hell. Missing values, duplicate entries, customers who return everything they buy. The real skill isn’t running algorithms on clean datasets – it’s making sense of this chaos.
The analytical approach combines K-means clustering for customer groups, RFM analysis for customer value scoring, collaborative filtering for the “people who bought this also bought” recommendations, and market basket analysis for those sneaky product relationships you’d never think of.
What makes this case study worth your time is the business impact. Amazon’s recommendation engine generates over $1 billion annually – that’s the kind of ROI that gets executive attention. The 35% increase in cross-selling revenue isn’t just a nice-to-have metric; it’s the difference between profit and loss for many product lines.
But here’s what most tutorials skip: the system fails constantly. Products go out of stock, customer preferences change overnight, and seasonal trends throw everything off. The real Amazon system isn’t just about making recommendations – it’s about making recommendations that still make sense when half your assumptions turn out to be wrong.
2. Walmart Demand Forecasting
Predicting demand across thousands of stores while incorporating external factors like weather and holidays sounds straightforward until you actually try it. I’ve worked on similar forecasting problems, and let me tell you – weather data is surprisingly terrible. Half the time the “historical weather” doesn’t match what actually happened, and don’t get me started on holiday effects.
Walmart’s system processes multiple data streams, but the real challenge isn’t technical – it’s business. Store managers want to avoid stockouts at all costs, which leads to over-ordering. Finance wants to minimize inventory holding costs. Customers want products available when they need them. Optimizing for all three simultaneously? That’s where the $2.4 billion in inventory cost reductions comes from.
The forecasting framework combines time series methods like ARIMA with machine learning approaches like XGBoost. But the secret sauce is in handling the external factors. A hurricane doesn’t just affect stores in its path – it affects supply chains hundreds of miles away. A viral TikTok video can create demand spikes that no historical data could predict.
The 15% improvement in product availability sounds modest until you realize that’s the difference between having toilet paper during a pandemic and empty shelves. These aren’t just numbers on a dashboard – they represent real customer experiences and business outcomes.
3. Zara Fast Fashion Trend Analysis
Fashion moves fast, and most fashion analytics move slowly. By the time traditional market research identifies a trend, it’s already over. Zara figured out how to analyze social media mentions, fashion blog posts, and runway show data to predict trends before they hit mainstream.
The methodology combines sentiment analysis of Instagram posts, image recognition for identifying visual trends, and clustering algorithms to group related fashion movements. Natural language processing extracts insights from fashion influencer content, but here’s the tricky part – fashion language is constantly evolving. What’s “fire” today might be “mid” tomorrow.
The 20% reduction in unsold inventory represents a massive win in an industry where trends can shift overnight. But the real value isn’t in the algorithm – it’s in the speed. Zara can identify, design, manufacture, and distribute new products in weeks while competitors take months.
4. Target Pregnancy Prediction Model
Target’s pregnancy prediction model is brilliant and slightly terrifying. They figured out that buying unscented lotion + vitamins + cotton balls = probably pregnant. It’s the kind of insight that makes you go “wow, that’s clever” and “should companies know this much about us?” at the same time.
The analytical approach uses logistic regression and decision trees to identify purchasing patterns that correlate with pregnancy. The model’s interpretability helps marketers understand which signals matter most – and more importantly, which ones might creep customers out.
Here’s the famous story everyone knows: Target sent baby coupons to a teenager before her family knew she was pregnant. The algorithm assigned pregnancy prediction scores to customers based on their shopping patterns. Unscented lotion, certain vitamins, cotton balls – seemingly random purchases that, when combined, revealed life changes customers hadn’t announced.
The 30% increase in targeted campaign effectiveness is impressive, but the real lesson is about the ethical implications of predictive analytics. Just because you can predict something doesn’t mean you should act on it. The backlash from the pregnancy incident taught Target (and every other retailer) that customer privacy concerns can outweigh analytical insights.
5. Starbucks Store Location Optimization
Location decisions can make or break retail success, but most location analytics is surprisingly primitive. Starbucks combines demographic data, competitor analysis, foot traffic patterns, and economic indicators through sophisticated geospatial analysis. The challenge isn’t finding the data – it’s integrating dozens of different data sources into coherent location recommendations.
The analytical framework includes GIS mapping for spatial analysis, demographic profiling of catchment areas, and competitor proximity analysis. But here’s what makes it complicated: foot traffic patterns change constantly. A new subway stop can transform an area overnight. A major employer relocating can kill foot traffic in a previously busy district.
Multi-criteria decision analysis weighs factors like foot traffic, demographics, competition, and real estate costs. The result is a systematic approach that reduces the risk of poor-performing stores, but it’s not foolproof. I’ve seen perfectly optimized locations fail because of factors no algorithm could predict – like construction projects that blocked access for six months.
Healthcare & Life Sciences Game-Changers
Here’s where things get real. In healthcare, your model doesn’t just predict churn rates – it could literally save someone’s life. Or miss a diagnosis that matters. The pressure is intense, and frankly, it should be. Every healthcare analytics project I’ve worked on comes with this underlying weight of responsibility that you don’t feel in other industries.
Healthcare data is uniquely challenging. Patient privacy regulations mean you can’t just downloa d datasets and start experimenting. Missing data isn’t just annoying – it might mean the difference between catching cancer early and missing it entirely. And unlike e-commerce, you can’t A/B test treatments on real patients to see which model performs better.
6. COVID-19 Spread Prediction Model
COVID hit and suddenly everyone wanted epidemiological models yesterday. I watched so many teams rush out predictions that were completely wrong within weeks. The successful models? They were built by teams who admitted upfront how much they didn’t know.
Data integration becomes a nightmare when you’re dealing with case reporting from different health departments (each with their own standards), mobility data from mobile devices (with massive privacy implications), demographic factors, healthcare capacity metrics, and government intervention timelines. Each data source has different quality levels, reporting delays, and coverage gaps.
The modeling approach combines traditional epidemiological models like SIR/SEIR with machine learning techniques. Neural networks identify complex patterns in transmission data, while geospatial analysis maps hot spots and spread patterns. Monte Carlo simulations enable scenario planning for different policy interventions.
But here’s the brutal truth about pandemic modeling: you’re making life-and-death policy recommendations based on incomplete data that changes daily. The models that informed lockdown decisions and hospital resource allocation affected millions of people. Getting it wrong wasn’t just an academic exercise – it had real consequences for public health and the economy.
7. Hospital Readmission Risk Prediction
You’re basically trying to turn a patient’s entire medical story into numbers a computer can understand. Age, previous surgeries, how many medications they’re on, social support systems – everything becomes a feature. It’s like trying to summarize someone’s health in a spreadsheet row, which sounds ridiculous when you put it that way.
Feature engineering incorporates patient demographics, medical history complexity, treatment intensity scores, medication adherence patterns, and social determinants of health. The challenge lies in creating meaningful features from complex medical records while maintaining patient privacy and avoiding algorithmic bias.
Multiple modeling approaches provide different insights. Logistic regression offers interpretable baseline predictions that doctors can understand and trust. Random Forest identifies feature importance to highlight which risk factors matter most. Gradient Boosting maximizes predictive performance, while Neural Networks capture complex interactions between risk factors.
The business impact shows measurable improvements in patient outcomes and cost reduction. But here’s what the metrics don’t capture: the human element. A patient flagged as high-risk for readmission gets extra attention from care coordinators, follow-up calls, and medication management support. The algorithm doesn’t just predict readmission – it triggers interventions that prevent it.
Model validation requires careful attention to temporal splits, ensuring models perform well on future patients rather than just historical data. Clinical validation involves testing predictions against actual readmission outcomes, but the real test is whether clinicians trust and use the predictions in practice.
8. Pharmaceutical Drug Discovery Analytics
Drug discovery traditionally takes 10-15 years and costs billions, with most compounds failing somewhere along the way. Analytics accelerates this process by analyzing molecular data to identify promising drug compounds, but let’s be honest – we’re still talking about a decade-long process with massive failure rates.
The analytical approach uses classification algorithms to predict biological activity from molecular structure. Chemical compound databases provide training data, while molecular fingerprinting converts chemical structures into numerical features for machine learning models. It sounds straightforward until you realize you’re trying to predict how a molecule will behave in a living human based on its chemical structure.
The 40% reduction in initial screening time sounds impressive, and it is. But that’s just the first step in a process with dozens of potential failure points. A compound that looks promising in silico might be toxic in animal studies. One that works in animal studies might fail in human trials. Analytics can speed up the early stages, but it can’t eliminate the fundamental uncertainty of drug development.
9. Medical Image Analysis for Diagnosis
95% accuracy in detecting specific conditions sounds incredible, right? But here’s the thing – if you’re screening for a rare disease, you could get 95% accuracy by just saying “nobody has it” every time. The devil’s in the details, and most people skip right past them.
Convolutional neural networks process medical images to identify patterns associated with specific conditions. Image preprocessing enhances relevant features while reducing noise. Data augmentation increases training dataset size and model robustness. But the real challenge isn’t technical – it’s clinical integration.
Radiologists don’t want AI to replace them; they want it to help them catch things they might miss. The most successful implementations position AI as a second opinion, flagging potential issues for human review rather than making final diagnoses. Trust is everything in healthcare, and it’s earned slowly and lost quickly.
10. Clinical Trial Optimization
Clinical trials are expensive, time-consuming, and fail more often than they succeed. Analytics optimizes trial design and patient recruitment to improve success probability, but we’re still talking about a process where most trials fail despite optimization.
Patient matching algorithms identify suitable trial participants from electronic health records and patient databases. Endpoint prediction models forecast trial outcomes based on patient characteristics and treatment protocols. Site selection optimization chooses trial locations based on patient populations and recruitment potential.
Adaptive trial design allows protocol modifications based on interim results, potentially stopping ineffective trials early or expanding successful ones. This flexibility reduces waste while accelerating promising treatments to market, but it also introduces complexity that many research teams struggle to manage effectively.
Financial Services & Fintech Innovations
Working in finance means every model gets scrutinized by lawyers, regulators, and risk managers who all want different things. I’ve seen brilliant models killed because they couldn’t explain why they flagged certain transactions. It’s frustrating but necessary – when your model affects people’s access to credit or flags them as potential fraudsters, interpretability isn’t optional.
|
Case Study |
Primary Technique |
Business Impact |
Regulatory Considerations |
|---|---|---|---|
|
Credit Risk Assessment |
Ensemble modeling, Feature engineering |
25% reduction in default rates |
Fair lending compliance, Model explainability |
|
Fraud Detection |
Anomaly detection, Real-time processing |
$2.1B annual fraud prevention |
Privacy protection, False positive management |
|
Algorithmic Trading |
Time series analysis, Statistical arbitrage |
15% annual returns |
Market manipulation rules, Risk limits |
|
Insurance Claims |
Classification, NLP |
60% processing time reduction |
Claims accuracy, Fraud detection balance |
|
Robo-Advisor |
Portfolio optimization, Behavioral modeling |
12% cost reduction vs traditional advisors |
Fiduciary duty, Risk disclosure |
11. Credit Risk Assessment Model
Modern credit scoring goes way beyond your credit bureau score, incorporating alternative data sources for more accurate risk assessment. But here’s the catch – every new data source introduces potential bias and regulatory complications. Using social media data might improve predictions, but it also raises fair lending concerns.
Data sources include traditional credit bureau information, banking transaction history, alternative data from utility payments and rental history, macroeconomic indicators, and industry-specific risk factors. The challenge lies in combining these diverse data types into coherent risk signals without creating discriminatory outcomes.
Feature engineering creates risk indicators from raw data, transforming transaction patterns into meaningful predictors of default probability. But you can’t just throw everything into a model and hope for the best. Each feature needs to be defensible from a business logic perspective and compliant with fair lending regulations.
Calculating financial metrics accurately becomes essential in credit modeling, much like our comprehensive approaches detailed in the ROI calculator guide which demonstrates how proper measurement frameworks support business decisions.
Ensemble methods combine multiple algorithms to create robust predictions, but interpretability becomes crucial when you need to explain to a rejected applicant why they didn’t qualify for credit. SHAP values and other explainable AI techniques help satisfy regulatory requirements, but they add complexity to model deployment and maintenance.
The 25% reduction in default rates represents significant value, but it comes with trade-offs. More accurate models might also be more exclusionary, potentially reducing access to credit for marginalized populations. Balancing predictive performance with fairness objectives is an ongoing challenge in credit modeling.
12. Fraud Detection System
Real-time fraud detection is like playing whack-a-mole with criminals who adapt faster than your models. You build a system to catch one type of fraud, and fraudsters immediately pivot to something else. It’s an arms race where the stakes are billions of dollars and customer trust.
System architecture includes stream processing for immediate transaction scoring, but scoring millions of transactions in milliseconds while maintaining accuracy is harder than it sounds. Centralized feature stores provide fraud indicators, but keeping features fresh and relevant requires constant updates. Model ensembles handle different fraud types, but managing multiple models in production is operationally complex.
The challenge lies in balancing false positives (blocking legitimate transactions) with false negatives (missing fraudulent activity). Block too many legitimate transactions and customers get frustrated. Miss too much fraud and you lose money. Real-time processing requirements add complexity – models must make decisions in milliseconds with incomplete information.
Technical implementation combines anomaly detection algorithms like isolation forests, graph analytics for fraud ring detection, rules engines for known fraud patterns, and model monitoring for performance tracking. But the real complexity is in the feedback loops – fraud investigations take days or weeks, but you need to update models continuously based on incomplete information.
The $2.1 billion in annual fraud prevention sounds impressive, but it represents just the fraud you caught. The fraud you missed? That’s harder to measure, and fraudsters are constantly evolving their techniques to stay ahead of detection systems.
13. Algorithmic Trading Strategy
The backtesting shows 15% annual returns, which sounds amazing. But – and this is a big but – backtesting is like driving while only looking in the rearview mirror. Real trading? That’s where things get messy fast. Market conditions change, liquidity disappears, and correlations that held for years suddenly break down.
Data sources include stock prices, trading volumes, economic indicators, news sentiment, and alternative data sources. Time series analysis identifies patterns and trends, while statistical arbitrage exploits temporary price discrepancies. But markets are adaptive – strategies that work today might stop working tomorrow as more participants adopt similar approaches.
Risk management becomes crucial when real money is on the line. Models must account for market volatility, liquidity constraints, and correlation changes during market stress. Backtesting validates strategies against historical data, but it can’t predict how strategies will perform when multiple algorithms are competing for the same opportunities.
The 15% annual returns come with significant caveats. These returns assume perfect execution, no slippage, and constant market conditions. Real trading involves transaction costs, market impact, and periods where strategies simply don’t work. Successful algorithmic trading requires constant adaptation and rigorous risk management.
14. Insurance Claims Processing Optimization
60% faster processing sounds abstract until you realize that’s the difference between settling a claim in 3 days versus a week. For someone waiting on insurance money after a car accident? That matters a lot.
The analytical approach combines classification models for claims assessment, anomaly detection for fraud identification, and natural language processing for claims text analysis. Historical claims data provides training examples, but insurance fraud evolves constantly, requiring continuous model updates and human oversight.
Automated systems handle routine claims efficiently, but complex cases still require human judgment. The challenge is designing systems that know when to escalate cases to human reviewers versus when to process them automatically. Get this wrong and you either create bottlenecks or miss important edge cases.
Business impact includes faster claim resolution and improved customer satisfaction, but it also requires careful balance between efficiency and accuracy. Automated systems can process simple claims quickly, but they might miss nuances that human adjusters would catch.
15. Robo-Advisor Portfolio Optimization
Automated investment advisory services sound revolutionary until you realize they’re essentially sophisticated spreadsheets that rebalance portfolios based on modern portfolio theory. The real value isn’t in the algorithms – it’s in making professional investment management accessible to people who can’t afford human advisors.
The analytical framework includes risk profiling through questionnaire analysis, asset allocation using optimization algorithms, rebalancing for tax efficiency, and performance attribution for understanding return sources. But the dirty secret? Most robo-advisors use similar underlying strategies, so performance differences are often marginal.
Continuous optimization adjusts portfolios based on market conditions and life changes, but it also introduces complexity. Tax-loss harvesting sounds great in theory, but it can create wash sale violations if not implemented carefully. Rebalancing reduces risk but can also reduce returns during trending markets.
The 12% cost reduction versus traditional advisors represents real value for investors, but it comes with trade-offs. Human advisors provide behavioral coaching and complex financial planning that algorithms can’t replicate. Robo-advisors work well for straightforward investment needs but struggle with complex financial situations.
Marketing & Digital Analytics Champions
Marketing analytics has evolved from gut feelings to scientific precision, but let’s be honest – half the “precision” is still educated guessing dressed up in fancy dashboards. The companies that succeed aren’t the ones with the most sophisticated models; they’re the ones that can actually act on their insights faster than their competitors.
16. Netflix Content Recommendation System
Netflix has been at this for over a decade now. Their current system is version… honestly, I’ve lost count. Point is, they didn’t wake up one day with a billion-dollar recommendation engine. They’ve been iterating, failing, and improving for years. Most of what you see in case studies is the polished end result, not the messy journey to get there.
The data architecture processes user behavior including viewing history, ratings, search queries, and time spent watching. Content metadata covers genres, actors, directors, and release dates. Contextual data includes device type, viewing time, and location. But here’s what most tutorials skip – the system fails constantly when new content launches or user preferences shift dramatically.
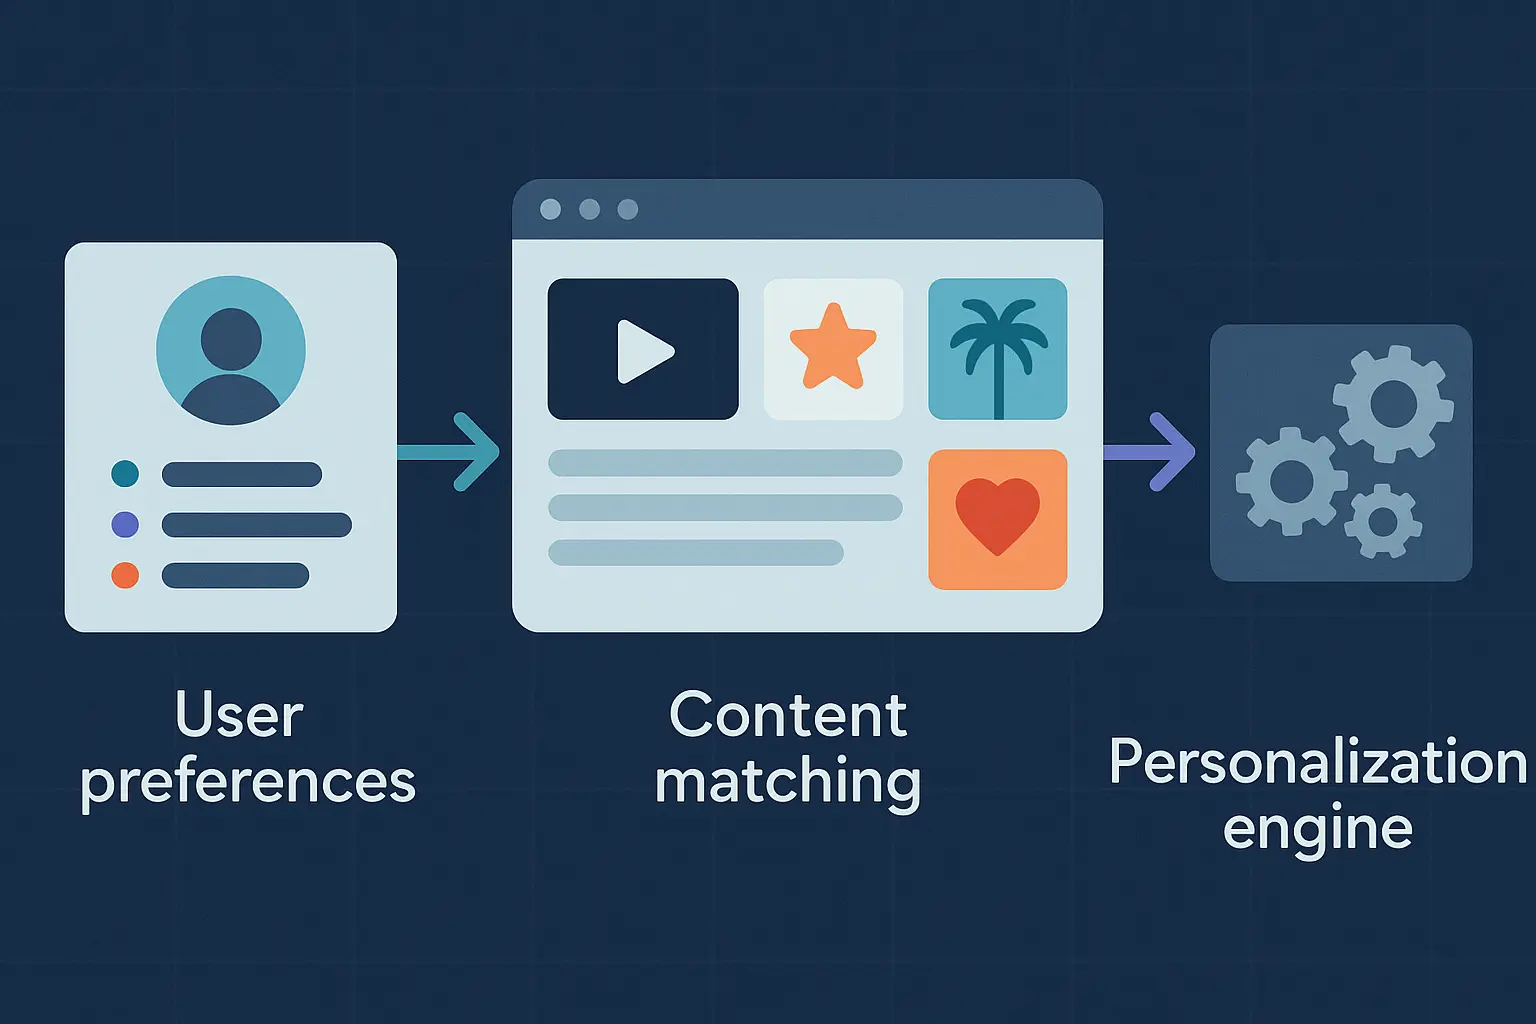
The algorithmic approach combines matrix factorization for collaborative filtering, deep neural networks for complex pattern recognition, multi-armed bandits for balancing exploration versus exploitation, and reinforcement learning for long-term engagement optimization. Each technique handles different aspects of the recommendation problem, but integration is where the real complexity lies.
With 80% of watched content coming from recommendations, this system generates over $1 billion in annual value. But that number assumes people wouldn’t have found other content to watch, which is probably not entirely true. The real value is in keeping subscribers engaged long enough to justify their monthly payment.
17. Google Ads Campaign Optimization
Google’s ad system tries to keep everyone happy – advertisers want cheap clicks, users want relevant ads, and Google wants maximum revenue. Spoiler alert: you can’t optimize for everything at once. Someone’s always slightly unhappy, and the art is in managing those trade-offs.
The optimization framework includes real-time bidding using machine learning, audience targeting through lookalike modeling, creative optimization via A/B testing, and multi-touch attribution across the customer journey. But the real challenge is that every auction happens in milliseconds with incomplete information about user intent and advertiser budgets.
Understanding campaign performance measurement mirrors the principles we explore in our marketing ROI calculator, where proper attribution and measurement frameworks drive optimization decisions.
Performance metrics focus on conversion rate optimization, customer acquisition cost reduction, and lifetime value modeling. The system continuously learns from campaign performance, but it’s also constantly fighting against advertisers who try to game the system and users who develop ad blindness.
Business impact shows measurable improvements in advertiser ROI while maintaining user satisfaction, but it’s a delicate balance. Push too hard on monetization and users abandon the platform. Focus too much on user experience and advertisers reduce their spending. Google’s success lies in finding the sweet spot that keeps both sides engaged.
18. Social Media Sentiment Analysis
They claim 25% faster response time, which is probably true. But measuring “brand sentiment” is like nailing jello to a wall. Half the improvement might just be from finally paying attention to what customers were saying online instead of ignoring them completely.
Data sources include Twitter posts, Facebook comments, Instagram mentions, and review site content. Natural language processing extracts sentiment, emotion, and topic information, but social media language evolves constantly. What’s considered positive sentiment today might be sarcastic tomorrow, and algorithms struggle with context and cultural nuances.
The analytical approach combines text preprocessing for noise reduction, sentiment classification using machine learning models, topic modeling for theme identification, and trend analysis for temporal patterns. But here’s the kicker – most social media mentions about brands are neutral or irrelevant, so finding the signal in all that noise is harder than it looks.
A major airline used sentiment analysis during a system outage that caused widespread flight delays. The analytics system detected negative sentiment spikes within 30 minutes of the first complaints, alerting the crisis management team before traditional customer service channels were overwhelmed. This early warning enabled proactive communication that reduced overall negative sentiment by 40% compared to previous incidents.
But sentiment analysis has limitations. Sarcasm breaks most algorithms. Cultural context matters enormously. And sometimes negative sentiment is justified – if your service actually sucks, sentiment analysis won’t fix the underlying problem.
19. Email Marketing Personalization
Email remains one of the highest ROI marketing channels when done right, but most email marketing is still spray-and-pray mass messaging with minimal personalization. The companies that succeed treat email like a conversation, not a broadcast.
Data integration combines email engagement history, website behavior tracking, purchase data analysis, and demographic information. Clustering algorithms segment customers based on behavior patterns, while recommendation systems suggest relevant products or content. But the real challenge is maintaining clean, up-to-date customer data across multiple systems.
Personalization techniques include send time optimization based on individual engagement patterns, content personalization using collaborative filtering, subject line optimization through A/B testing, and dynamic content insertion based on user preferences. Each technique requires ongoing testing and refinement to remain effective.
The 40% increase in email open rates through behavioral targeting sounds impressive, but it’s easier to improve bad email marketing than good email marketing. If you’re starting from terrible baseline performance, any personalization will show dramatic improvements. The real test is sustaining performance improvements over time as customers adapt to personalized messaging.
20. Customer Journey Analytics
Understanding how customers interact across multiple touchpoints sounds straightforward until you try to actually track someone across devices, browsers, and offline interactions. Customer journey mapping is more like customer journey guessing with better data.
Data integration challenges include digital touchpoints like website analytics and mobile app usage, offline interactions like store visits and call center contacts, transaction data including purchases and returns, and external data from market research. Each data source has different identifiers, collection methods, and quality levels.
Analytical methods include path analysis for journey mapping, attribution modeling for multi-touch attribution, survival analysis for time-to-conversion prediction, and Markov chain models for probabilistic customer journey modeling. But customers don’t follow neat, linear paths from awareness to purchase – they jump around, research extensively, and make decisions based on factors you can’t measure.
The insights enable optimization of touchpoint effectiveness, identification of conversion barriers, and personalization of customer experiences. But here’s the reality check – most customer journeys are too complex and individualized to optimize systematically. The value comes from identifying broad patterns and major pain points, not from perfecting every micro-interaction.
Operations & Supply Chain Analytics Leaders
Operations analytics is where data science meets the physical world, and let me tell you – the physical world doesn’t care about your beautiful models. Trucks break down, weather disrupts flights, and customers change their minds at the last minute. The companies that succeed in operations analytics aren’t the ones with the most elegant algorithms; they’re the ones that build systems robust enough to handle reality.
21. Uber Dynamic Pricing Algorithm
Before you dive into Uber’s dynamic pricing case study, fair warning: this one will make your brain hurt. Real-time optimization with millions of variables? It’s not exactly beginner-friendly. Start with something simpler unless you enjoy debugging code at 2 AM.
System components include demand forecasting using predictive models, supply optimization through driver allocation algorithms, price elasticity modeling to understand customer response, and external factor integration including weather and events. But here’s the complexity nobody talks about – all of this happens in real-time while the system is processing millions of ride requests simultaneously.
Technical implementation requires stream processing for immediate price adjustments, machine learning ensemble models for demand prediction, linear programming for resource allocation, and continuous A/B testing for pricing strategy optimization. The system must balance multiple objectives – maximizing revenue, minimizing wait times, keeping drivers busy, and maintaining customer satisfaction.
The 20% increase in driver utilization and 15% revenue improvement represent significant wins, but they come with trade-offs. Surge pricing works great for Uber’s bottom line but creates customer frustration during peak demand periods. The algorithm optimizes for system efficiency, not individual customer happiness.
22. Amazon Warehouse Optimization
Amazon’s warehouse management system represents operations research at massive scale. The system processes millions of SKUs across hundreds of warehouses, optimizing for speed, accuracy, and cost efficiency simultaneously. But warehouse optimization isn’t just about algorithms – it’s about integrating human workers, robotic systems, and unpredictable demand patterns.
Optimization areas include strategic inventory placement for efficient picking, route optimization to minimize travel time, demand forecasting for inventory needs by location, and staffing optimization through workforce planning. Each optimization problem interacts with the others, creating a complex system where local improvements can sometimes hurt global performance.
Analytical techniques combine operations research methods like linear programming, machine learning for predictive modeling, simulation using Monte Carlo methods for scenario planning, and real-time analytics for continuous monitoring. But the real complexity comes from scale – optimizing one warehouse is hard, optimizing hundreds while maintaining consistent service levels is exponentially harder.
Machine learning algorithms continuously improve placement strategies based on order patterns and seasonal trends, but they must also account for physical constraints like shelf space, weight limits, and worker safety requirements. The most elegant mathematical solution doesn’t matter if workers can’t safely implement it.
23. FedEx Package Routing Optimization
Package delivery optimization represents one of the classic applications of operations research, but the reality is messier than the textbook version. The 12% reduction in delivery time through optimized routing sounds great, but it assumes perfect information about traffic, weather, and package handling – assumptions that rarely hold in practice.
The analytical approach uses graph algorithms for route optimization, considering package destinations, vehicle capacity constraints, traffic patterns, and delivery time windows. Network optimization techniques balance hub-and-spoke efficiency with direct delivery speed, but real-world constraints constantly disrupt optimal plans.
Dynamic routing adjusts to real-time conditions including traffic delays, weather disruptions, and last-minute package additions. The system must balance multiple objectives – minimizing cost, reducing delivery time, and maintaining service quality. But drivers also have union contracts, safety requirements, and human limitations that pure optimization models don’t capture.
The challenge isn’t just mathematical – it’s operational. The most optimized route doesn’t matter if the driver can’t find the address, the package is damaged, or the recipient isn’t home. Successful routing optimization requires building flexibility into the system to handle the inevitable disruptions.
24. Manufacturing Quality Control
Predictive maintenance and quality control sound like perfect applications for IoT data and machine learning until you actually try to implement them in a real factory. Equipment sensor readings include temperature, vibration, and pressure data, but sensors fail, calibration drifts, and maintenance teams sometimes ignore the predictions.
Data sources include equipment sensor readings, production metrics like throughput and cycle time, and quality measurements including defect rates and specification compliance. Time series analysis identifies patterns that precede equipment failures, but correlation doesn’t always equal causation in complex manufacturing environments.
Analytical methods include anomaly detection for unusual sensor patterns, predictive modeling for failure probability estimation, statistical process control for quality monitoring, and optimization algorithms for maintenance scheduling. But the 30% reduction in defective products assumes that production teams actually act on the predictions, which doesn’t always happen.
The reality of manufacturing analytics is that human expertise still matters enormously. Experienced operators can often predict equipment problems before algorithms do, based on subtle cues that sensors don’t capture. The most successful implementations combine algorithmic insights with human judgment rather than trying to replace human expertise entirely.
25. Energy Grid Load Forecasting
Electricity demand forecasting optimizes power generation and distribution, but it’s also one of the most challenging forecasting problems in business. You can’t store electricity efficiently, demand varies constantly, and the consequences of getting it wrong range from expensive to catastrophic.
The forecasting framework includes multiple time horizons from hourly to seasonal predictions, weather integration analyzing temperature and weather patterns, economic factors including industrial activity, and renewable integration forecasting solar and wind generation. This comprehensive sql data analytics case study demonstrates how structured data from multiple sources creates robust forecasting models, but weather forecasts are notoriously unreliable beyond a few days.
Technical approaches combine time series models like ARIMA, machine learning methods including neural networks and ensemble methods, optimization algorithms for unit commitment, and uncertainty quantification through probabilistic forecasting. But the system must balance supply and demand in real-time while minimizing costs and maintaining grid stability.
The challenge isn’t just technical – it’s regulatory and political. Energy markets involve complex pricing mechanisms, environmental regulations, and political considerations that pure optimization models struggle to incorporate. Successful grid forecasting requires understanding not just the technical constraints but also the regulatory and market dynamics that affect energy production and consumption.
How These Case Studies Stack Up Against Real-World Needs
Not all case studies deliver equal value for your career development. After working through dozens of these cases (and watching others struggle with inappropriate choices), I’ve learned which ones actually prepare you for real work versus which ones just look impressive on paper.
|
Case Study Category |
Business Relevance |
Technical Complexity |
Interview Readiness |
Portfolio Impact |
|---|---|---|---|---|
|
Amazon Customer Segmentation |
⭐⭐⭐⭐⭐ |
⭐⭐⭐⭐ |
⭐⭐⭐⭐⭐ |
⭐⭐⭐⭐⭐ |
|
Netflix Recommendation |
⭐⭐⭐⭐⭐ |
⭐⭐⭐⭐⭐ |
⭐⭐⭐⭐ |
⭐⭐⭐⭐⭐ |
|
Credit Risk Assessment |
⭐⭐⭐⭐⭐ |
⭐⭐⭐⭐ |
⭐⭐⭐⭐⭐ |
⭐⭐⭐⭐ |
|
Uber Dynamic Pricing |
⭐⭐⭐⭐ |
⭐⭐⭐⭐⭐ |
⭐⭐⭐ |
⭐⭐⭐⭐⭐ |
|
COVID-19 Prediction |
⭐⭐⭐ |
⭐⭐⭐⭐ |
⭐⭐⭐ |
⭐⭐⭐⭐ |
|
Target Pregnancy Prediction |
⭐⭐⭐⭐ |
⭐⭐⭐ |
⭐⭐⭐⭐ |
⭐⭐⭐ |
Business Relevance Champions
Amazon Customer Segmentation, Netflix Recommendation System, Credit Risk Assessment, and Uber Dynamic Pricing score highest for business relevance because they solve fundamental problems that every data professional encounters. Customer segmentation applies whether you’re selling shoes or software. Recommendation systems work for content, products, or services. These aren’t industry-specific solutions – they’re universal business applications.
Fraud Detection translates across finance, e-commerce, and insurance. Customer Journey Analytics applies to any customer-facing business. Demand Forecasting works for retail, manufacturing, or services. These cases teach methodologies that travel well between companies and sectors, making them valuable investments of your learning time.
COVID-19 Prediction and Hospital Readmission show crisis analytics capabilities. While industry-specific, they demonstrate how data science handles high-stakes situations with incomplete information – skills that apply during any business crisis, whether it’s a supply chain disruption, market crash, or competitive threat.
Technical Depth Leaders
Advanced complexity cases like Netflix Content Recommendation showcase deep learning, reinforcement learning, and large-scale system design. These cases demonstrate technical sophistication that impresses hiring managers, but they require significant background knowledge to implement successfully.
Amazon Warehouse Optimization shows operations research skills including linear programming, network optimization, and simulation. These mathematical optimization skills are rare and valuable across industries, but they also require understanding of operations research methods that many data scientists lack.
Uber Dynamic Pricing exhibits real-time processing and complex optimization capabilities. Google Ads Optimization demonstrates multi-objective optimization and real-time bidding systems. These cases show how to handle massive scale and real-time constraints – skills that separate senior practitioners from junior analysts.
Interview Preparation Excellence
Financial services interviews frequently feature Credit Risk Assessment and Fraud Detection cases because they demonstrate understanding of regulatory requirements, model interpretability, and risk management. These are core competencies for financial roles, and interviewers expect candidates to understand the unique challenges of working with financial data.
Tech company interviews emphasize Customer Segmentation, A/B Testing, and Recommendation Systems because they show product thinking, experimentation design, and user behavior analysis. Tech companies want to see that you understand how data drives product decisions and user engagement.
Marketing role interviews focus on Customer Journey Analytics, Email Marketing Personalization, and Social Media Sentiment Analysis because they demonstrate understanding of customer acquisition, retention, and engagement strategies. Marketing managers want to see that you can connect data insights to marketing outcomes.
Portfolio Building Powerhouses
I know the Netflix case study looks cooler on your portfolio than Target’s pregnancy prediction. But if you can’t explain logistic regression to your mom, maybe don’t jump straight into reinforcement learning. Trust me on this one.
Energy Grid Forecasting displays complex time series analysis and optimization skills while demonstrating ability to handle multiple objectives, uncertainty quantification, and real-time decision making. COVID-19 Prediction exhibits crisis management and public health analytics capabilities, showing how data science addresses urgent, high-impact problems.
The key is building a portfolio that shows progression from foundational concepts to advanced applications. Start with interpretable models like Target’s pregnancy prediction, progress to intermediate complexity like Walmart’s demand forecasting, and culminate with advanced cases like Netflix’s recommendation system.
Final Thoughts
Here’s the truth nobody tells you: finishing these case studies is just the beginning. The real learning happens when you try to explain your Netflix recommendation model to a VP who just wants to know if it’ll increase subscriptions. That’s when you find out what you actually understand versus what you memorized from tutorials.
These 25 case studies represent more than just learning exercises – they’re a roadmap for developing the analytical mindset that separates competent data professionals from indispensable ones. You’ve seen how Amazon, Netflix, and Uber use data to create competitive advantages worth billions. More importantly, you’ve learned the frameworks that make these successes possible and the pitfalls that cause similar projects to fail.
Start with cases that match your current skill level, but don’t get comfortable. The Target pregnancy prediction model teaches classification basics, but it won’t prepare you for the complexity of Netflix’s recommendation engine. Each case builds on previous knowledge while introducing new challenges that push your capabilities forward.
The business impact numbers tell the real story, but they also hide the failures. Amazon’s recommendation engine generates over $1 billion annually – but that’s after years of iteration, failed experiments, and constant refinement. Walmart’s demand forecasting saves $2.4 billion in inventory costs – but it also required integrating dozens of data sources and overcoming organizational resistance to algorithmic decisions.
Your portfolio should demonstrate both breadth and depth. Include foundational cases that show you understand core concepts, intermediate cases that demonstrate practical application skills, and at least one advanced case that showcases cutting-edge capabilities. But more importantly, be able to explain why each case matters for business outcomes, not just how the algorithms work.
Building comprehensive analytics portfolios requires understanding market dynamics and business opportunities, much like our detailed exploration in the market sizing guide for business opportunities which demonstrates how analytical thinking applies to strategic business decisions.
The Marketing Agency understands this progression from learning to application intimately. Our data-driven approach to campaign optimization, customer segmentation, and performance measurement mirrors the methodologies you’ve seen in these case studies. When you’re ready to apply these analytical frameworks to real marketing challenges, we’re here to help you transform data insights into measurable business growth.
Understanding comprehensive measurement frameworks becomes crucial when implementing these methodologies in practice, similar to how we approach GA4 audit strategies that ensure data quality and actionable insights across all analytical implementations.
The goal isn’t just to complete these case studies – it’s to internalize the problem-solving approaches that make data professionals indispensable. The companies behind these successes didn’t win because they had better data or fancier algorithms. They won because they asked better questions, designed smarter experiments, and translated analytical insights into actions that moved business metrics.
Remember, every expert was once a beginner who refused to give up when the models didn’t work, the data was messy, and the business stakeholders didn’t understand the recommendations. The difference between good data professionals and great ones isn’t technical skill – it’s persistence, curiosity, and the ability to communicate complex insights in ways that drive business decisions.


