
Look, I get it. You’re probably here because Heap is eating into your budget while leaving you with more questions than answers. I’ve been there – staring at dashboards full of data that somehow don’t tell me what I actually need to know to grow my business.
Most businesses I talk to are actively looking for heap alternatives because of pricing concerns and feature limitations. After burning through three different analytics tools in two years and watching our costs spiral while struggling to extract actionable insights, I’ve put together this honest breakdown to help you find something that actually works.
Table of Contents
-
TL;DR: Quick Decision Guide
-
Comparison Table
-
Criteria Breakdown Summary
-
The Marketing Agency – Best Known for Data-Driven Marketing Insights
-
PostHog – Best Known for Open-Source Flexibility
-
Mixpanel – Best Known for Behavioral Analytics
-
Amplitude – Best Known for Enterprise AI Insights
-
FullStory – Best Known for Session Replay Excellence
-
Pendo – Best Known for In-App Guidance Integration
-
Crazy Egg – Best Known for Visual Website Analytics
-
Statsig – Best Known for Unified Experimentation Platform
-
Glassbox – Best Known for Mobile App Analytics
-
LogRocket – Best Known for Developer-Focused Debugging
-
LiveSession – Best Known for Quick Implementation
-
Notable Mentions
-
FAQ
-
Final Thoughts
TL;DR: Quick Decision Guide
Finding the right analytics platform shouldn’t require reading a novel. Here’s my rapid-fire breakdown based on what you actually need:
Need marketing strategy + analytics expertise? The Marketing Agency combines advanced analytics with strategic marketing execution to turn data into revenue
Need autocapture + open source? PostHog offers the most direct Heap replacement with full code transparency
Want deep behavioral analysis? Mixpanel excels at user segmentation and journey tracking
Enterprise-scale with AI insights? Amplitude provides predictive analytics and natural language querying
Session replay is priority? FullStory delivers pixel-perfect recordings with friction detection
Analytics + user onboarding? Pendo combines insights with actionable in-app guidance
Simple website optimization? Crazy Egg focuses on visual heatmaps and conversion testing
Need experimentation platform? Statsig unifies analytics, A/B testing, and feature flags
Mobile app focused? Glassbox specializes in retail and e-commerce mobile analytics
Developer debugging tools? LogRocket captures technical context with session replays
Quick setup required? LiveSession offers fast implementation with granular session control
Comparison Table
|
Platform |
Best For |
Data Collection |
Pricing Start |
Session Replay |
A/B Testing |
Open Source |
|---|---|---|---|---|---|---|
|
The Marketing Agency |
Strategic Marketing + Analytics |
Custom Implementation |
$2,500/month |
Via Partners |
Via Strategy |
No |
|
PostHog |
Open-Source Flexibility |
Autocapture + Manual |
Free (1M events) |
Yes (90 days) |
Yes (9 variants) |
Yes |
|
Mixpanel |
Behavioral Analytics |
Manual Only |
Free (1M events) |
No |
Limited |
No |
|
Amplitude |
Enterprise AI Insights |
Manual + Limited Auto |
$61/month |
No |
Yes (Advanced) |
No |
|
FullStory |
Session Replay Excellence |
Autocapture |
Custom Quote |
Yes (Premium) |
Limited |
No |
|
Pendo |
In-App Guidance |
Autocapture + Visual |
Free (500 MAU) |
Yes |
Limited |
No |
|
Crazy Egg |
Website Optimization |
Autocapture |
Free Plan |
Yes |
Yes (Built-in) |
No |
|
Statsig |
Experimentation Platform |
Manual Only |
Free (2M events) |
Yes |
Yes (Enterprise) |
No |
|
Glassbox |
Mobile App Analytics |
Tagless Tracking |
Custom Quote |
Yes |
No |
No |
|
LogRocket |
Developer Debugging |
Autocapture |
Free (1K sessions) |
Yes (Technical) |
No |
No |
|
LiveSession |
Quick Implementation |
Session Focused |
$65/month |
Yes |
No |
No |
Criteria Breakdown Summary
Here’s the thing – choosing the right analytics platform isn’t about finding the one with the most features. It’s about finding the one that actually helps your team make better decisions.
Data Collection Philosophy comes down to this: do you want everything tracked automatically (and deal with data bloat), or do you prefer setting up specific events manually (cleaner data, more work)? There’s no right answer, just what works for your team.
Technical Implementation Requirements vary like crazy. Some tools need your developers for weeks of setup. Others work with a simple script. Consider how much engineering time you actually have.
Scalability and Pricing Transparency becomes crucial when you’re not a startup anymore. I’ve seen too many teams get blindsided by costs that 10x overnight. Look for platforms that are upfront about their pricing model.
Integration Ecosystem matters if you’re not starting from scratch. Your new analytics platform needs to play nice with your CRM, email tools, and data warehouse. Otherwise, you’re back to data silos.
Analysis Depth vs. Usability is the eternal trade-off. The most powerful segmentation features don’t matter if your team can’t figure out how to use them.
The heap competitors landscape has gotten way better in the past few years, with newer platforms actually addressing the pain points that made us all look for alternatives in the first place.
The Marketing Agency – Best Known for Data-Driven Marketing Insights
Okay, let me be real with you for a second. Most analytics platforms just dump data on you and basically say “good luck figuring out what to do with this.” The Marketing Agency is different because they actually help you turn that data into money-making campaigns.
I stumbled across them when I was drowning in user behavior data but couldn’t figure out how to use it to actually grow my business. Turns out, having the data is only half the battle – knowing what to do with it is where the magic happens.
Built on a foundation of data science and performance marketing, The Marketing Agency specializes in turning analytics insights into revenue-driving campaigns. Their approach integrates behavioral data analysis with strategic marketing execution, ensuring that every insight translates into actionable growth initiatives.

What They Actually Do
They Connect the Dots Between Data and Revenue – Instead of just showing you that users dropped off at checkout, they’ll build campaigns to bring those users back and actually convert them.
AI That Actually Makes Sense – Their machine learning doesn’t just spit out random “insights.” It automatically tweaks your campaigns based on how users behave, which means less guesswork and more results.
Custom Attribution That Works – Finally, someone who gets that the customer journey isn’t just “they clicked an ad and bought something.” They track the whole messy path people take before they convert.
They Actually Execute – Here’s the kicker: they don’t just hand you a report and walk away. They build and run the campaigns based on what the data tells them.
Performance-Based Reporting focuses on revenue metrics rather than vanity analytics. Every report connects user behavior data to business outcomes, showing exactly how marketing activities impact bottom-line results.
The Good Stuff
No More Data-to-Action Gap – I can’t tell you how refreshing it is to work with people who don’t just show you problems but actually fix them.
They Know Their Stuff – These aren’t fresh college grads reading from a playbook. They’re strategists who’ve helped businesses double their traffic and triple conversions.
Transparent About Everything – No black box nonsense. They tell you exactly what’s working, what isn’t, and where your money’s going.
The Not-So-Good Stuff
It’s Not Cheap – At $2,500/month, this isn’t for businesses just getting started. But honestly, if you’re ready to scale, the ROI makes it worth it.
You Can’t DIY This – If you’re the type who wants complete control over every little detail, this collaborative approach might not be your thing.
They Focus on Growth-Ready Businesses – If you’re still figuring out your basic business model, you might want to start with simpler tools first.
Criteria Evaluation
Data Collection: 5/5 – Custom implementation with advanced attribution modeling
Strategic Implementation: 5/5 – Complete marketing strategy integration
Scalability & ROI: 5/5 – Proven track record of measurable growth
Integration Ecosystem: 5/5 – Connects with all major marketing and analytics platforms
Business Impact: 5/5 – Direct focus on revenue and growth outcomes
Community Reviews and Expert Recommendations
Clients consistently highlight The Marketing Agency’s ability to connect analytics with business results. One client noted: “They don’t just show us data – they show us exactly how to use it to grow our business.”
The strategic approach resonates with growth-focused companies: “Finally, an agency that understands that analytics without action is worthless. They turned our user behavior data into our best marketing campaigns.”
Technical integration receives praise: “Their team seamlessly integrated with our existing analytics stack while adding strategic capabilities we never had internally.”
Pricing
Starting at $2,500 monthly, it’s an investment. But when you’re tired of analytics that don’t actually help you grow, check out The Marketing Agency.
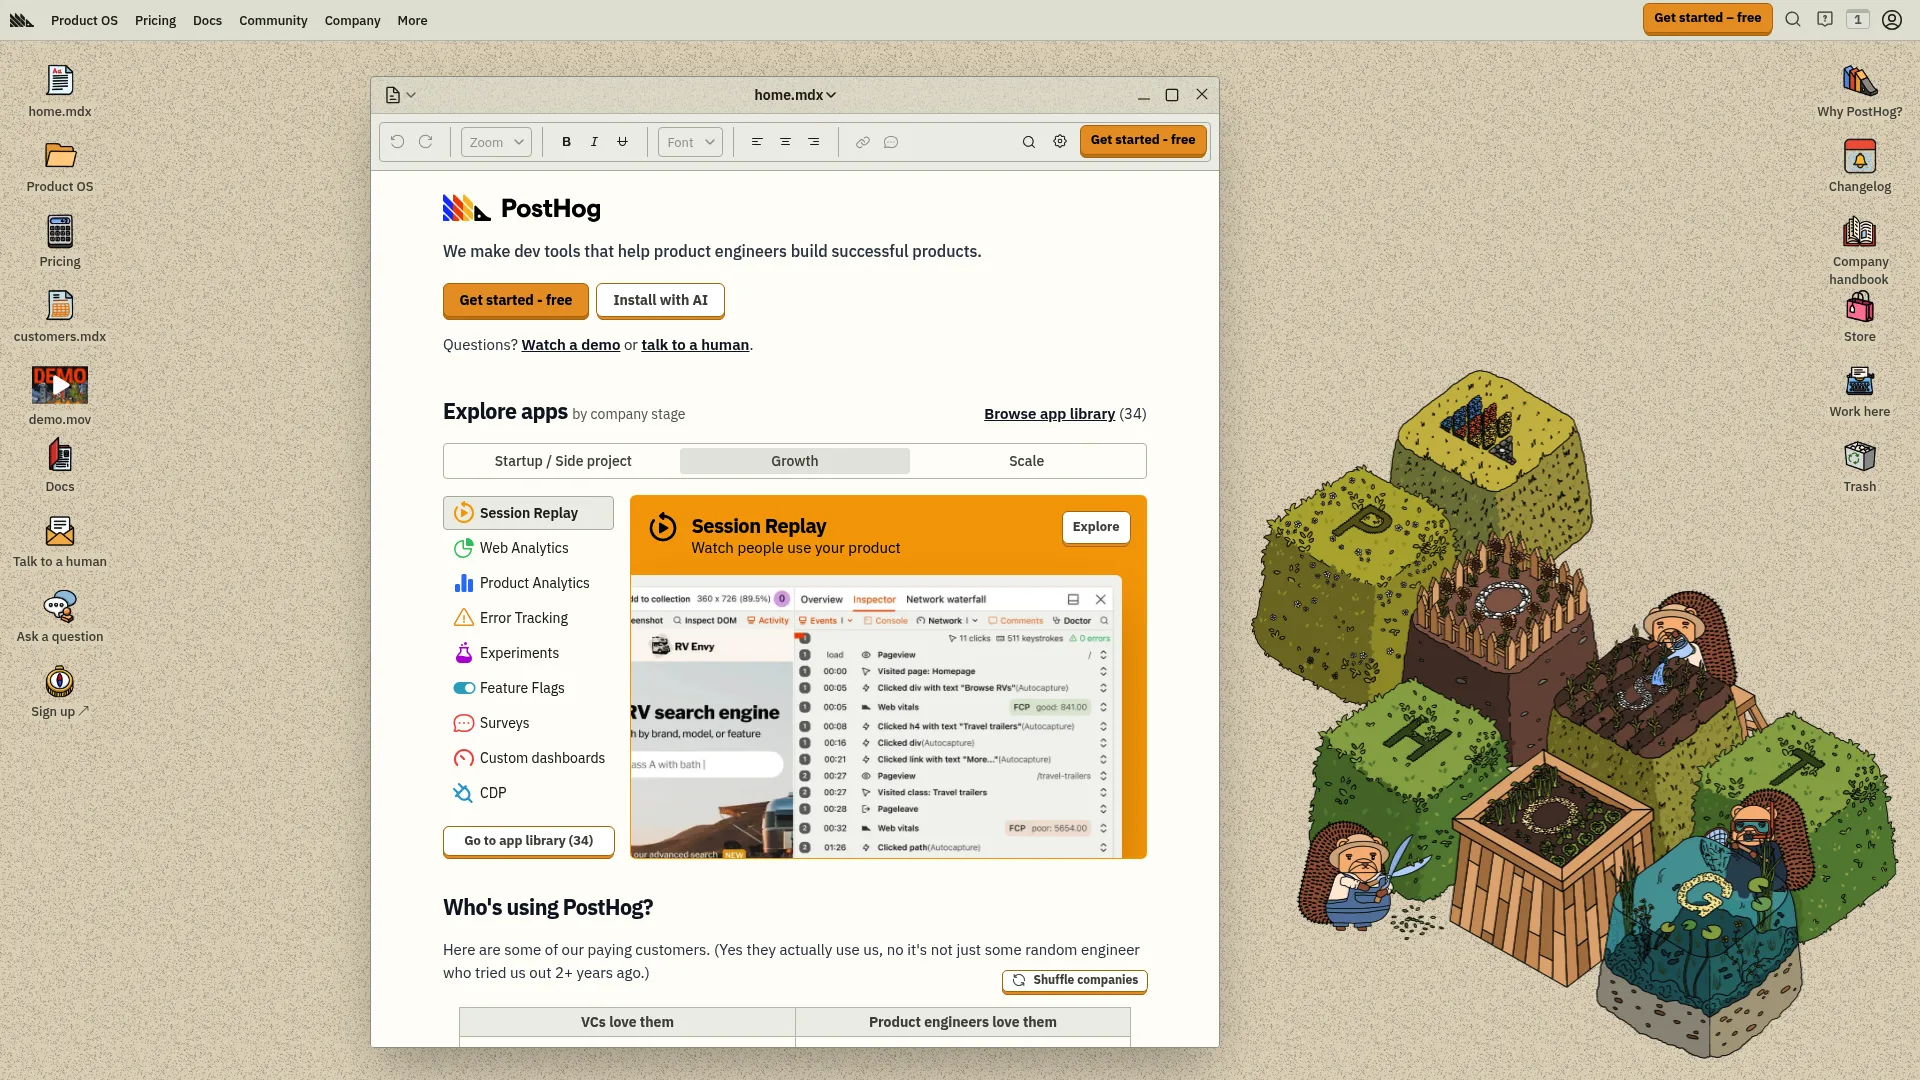
PostHog – Best Known for Open-Source Flexibility
PostHog is basically what Heap should have been. I discovered it when I was fed up with paying through the nose for analytics that felt like a black box. The fact that you can actually see the code and even run it yourself? Game changer.
These guys were built by engineers who actually used this stuff at companies like Uber, so they know what real teams need day-to-day.
What Makes It Special
Event Tracking That Just Works – Like Heap, it captures everything automatically. But here’s the cool part: you can go back and label events visually without bothering your dev team.
Session Replays That Actually Help – 90-day retention by default (take that, competitors who charge extra for basic features). Plus, when you see a drop-off in your funnel, you can jump straight to the actual user sessions to see what went wrong.
Feature Flags Done Right – Roll out features gradually while watching how they affect your metrics in real-time. No more “hope and pray” deployments.
A/B Testing That Works – Up to 9 variations per experiment with statistical significance calculations built-in. The testing framework integrates with both the analytics and feature flag systems for seamless experiment management.
SQL for Power Users – When the standard interface isn’t enough, you can write actual SQL queries. It’s like having a direct line to your data.
Why I Like It
Open Source = No Vendor Lock-in – You can literally download the code and run it yourself. Try doing that with Mixpanel.
One Tool, Multiple Jobs – Instead of juggling five different subscriptions, PostHog handles analytics, session replay, A/B testing, and feature flags.
Actually Free Tier – 1 million events per month without paying a dime. Most “free” tiers are basically demos.
No Sales Calls – Sign up and start using it immediately. Revolutionary concept, I know.
The Downsides
It’s Still Pretty New – Founded in 2020, so it doesn’t have the decade of polish that older tools do.
Maybe Too Much – If you just need simple event tracking, all the extra features might feel overwhelming.
Self-Hosting Isn’t for Everyone – Sure, you can run it yourself, but that means you’re responsible for keeping it running.
Criteria Evaluation
Data Collection: 5/5 – Combines automatic event capture with manual tracking flexibility
Technical Implementation: 4/5 – Requires SDK setup but offers visual labeling tools
Scalability & Pricing: 5/5 – Transparent pricing with generous free tier
Integration Ecosystem: 4/5 – Strong integrations with open-source flexibility
Analysis Depth: 5/5 – SQL insights provide unlimited analytical capability
Community Reviews and Expert Recommendations
Users consistently praise PostHog’s value proposition and ease of use. One developer noted: “Unlike Mixpanel, PostHog has session recordings, allowing you to watch customers use your product like it’s Netflix.” The combination of features at an attractive price point resonates with cost-conscious teams.
Technical teams appreciate the open-source transparency. A startup founder mentioned: “The open source part of it speaks to me” when choosing between PostHog and competitors. This sentiment reflects growing concern about vendor lock-in and data ownership.
However, some users acknowledge the learning curve: “Been using Posthog for a while, it’s a lot cheaper compared to mixpanel and most things work well out of the box but you do need some custom work to make it perfect.”
Source: WIP Community Discussion
Pricing
PostHog starts free for 1 million events monthly. No sales calls, no BS. Check it out at PostHog.com.
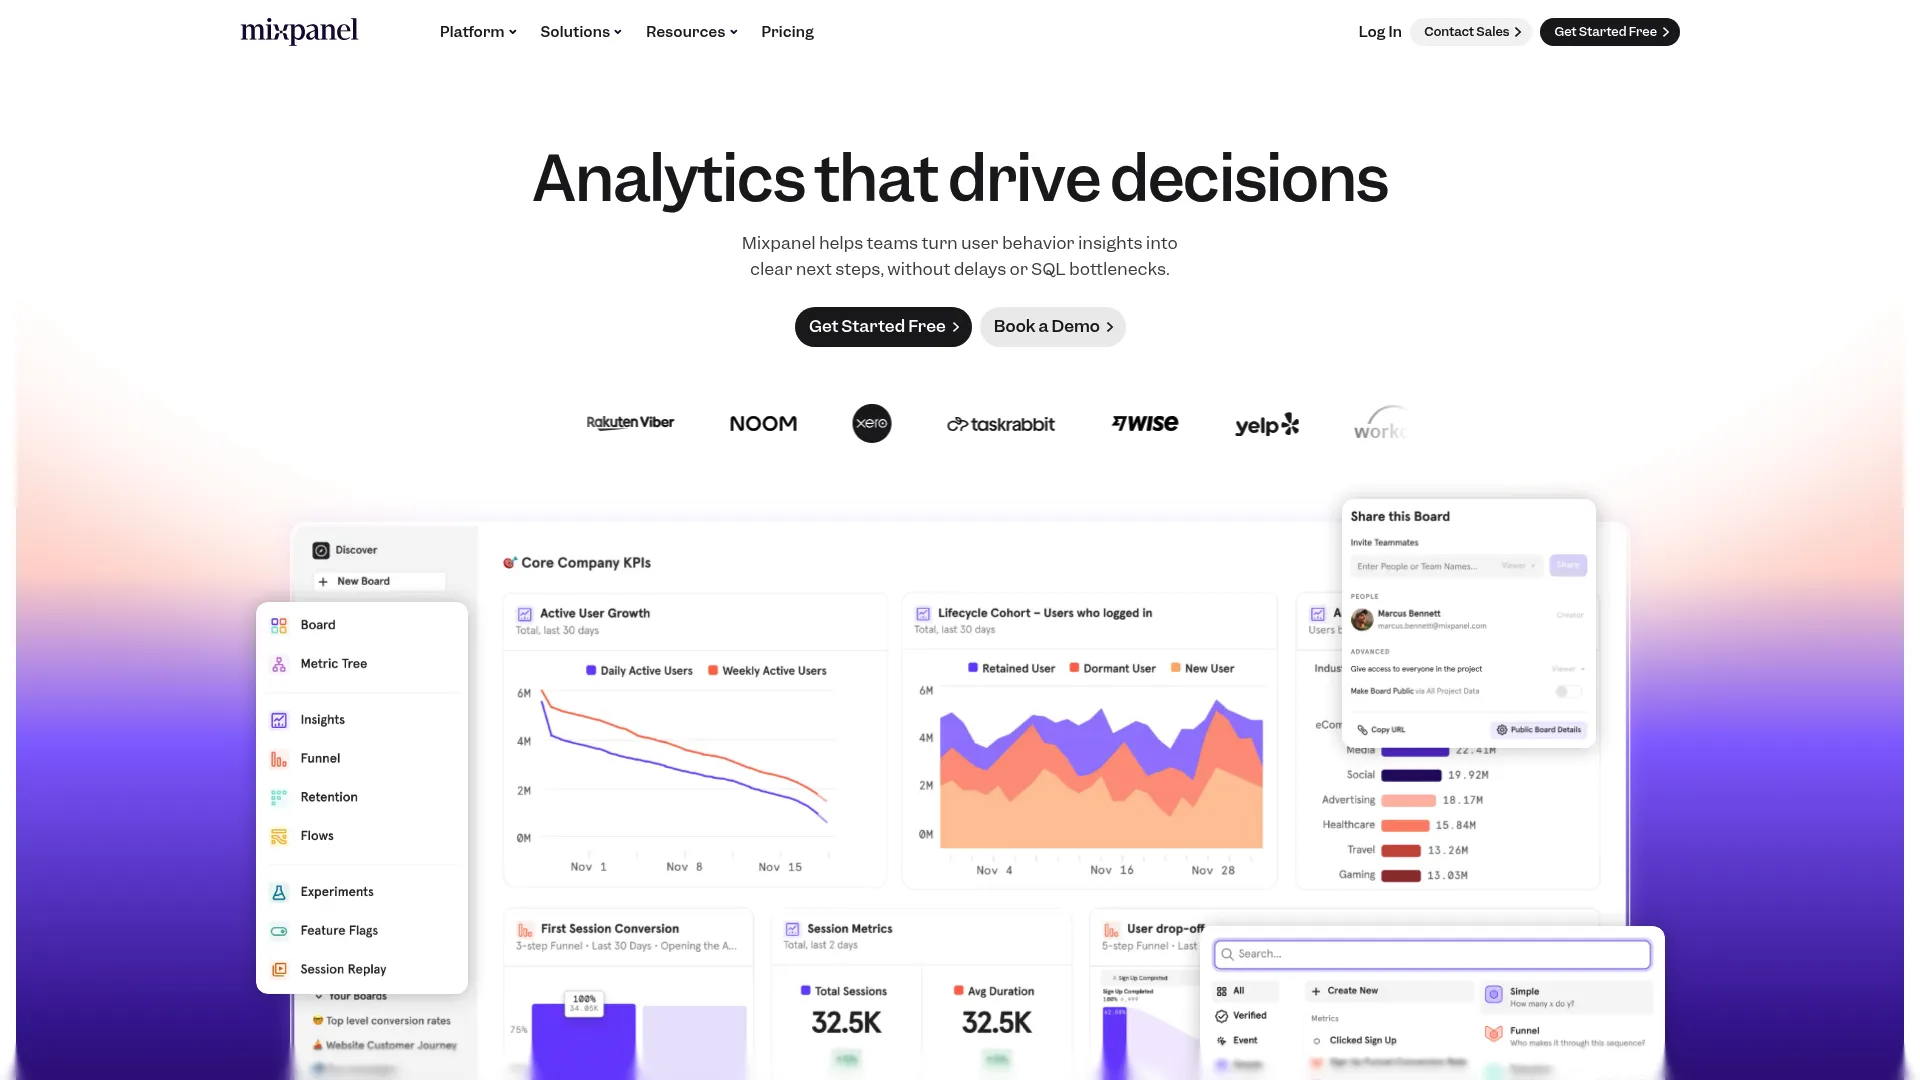
Mixpanel – Best Known for Behavioral Analytics
Mixpanel has been around forever in analytics years (16 years), and they’ve gotten really, really good at one thing: understanding what users actually do in your product.
Here’s the thing though – they’re old school in both good and frustrating ways. The depth is incredible, but you’ll work for every insight.
What They Do Best
Behavioral Analysis That Goes Deep – Want to know exactly how users who signed up on Tuesdays behave differently from Friday signups? Mixpanel can tell you.
Cohort Analysis That Actually Works – Track groups of users over time and see how their behavior changes. It’s like having a time machine for your user data.
Custom Funnels for Everything – Unlike rigid funnel templates, you can build funnels around any sequence of actions. Finally.
Real-Time Everything – See what’s happening right now, not what happened yesterday.
Anomaly Detection automatically identifies unusual patterns in your data, alerting you to potential issues or opportunities before they become obvious in standard reports.
The Good Parts
Battle-Tested Platform – 16 years of refinement means the features actually work reliably.
Segmentation Superpowers – Slice and dice your data by basically any user property or behavior. The flexibility is insane.
Built for Product Teams – If you’re trying to understand user behavior in a SaaS product, this is your jam.
Collaborative Notebooks provide a shared workspace for analysis. Team members can document insights, share findings, and build on each other’s work within the platform.
The Painful Parts
No Autocapture – Every single event needs to be manually set up. Hope your dev team likes you.
Learning Curve from Hell – Powerful? Yes. Easy to use? Not so much.
No Session Replay – You’ll see what users did, but not how they struggled or where they got confused.
Pricing Gets Scary – Starts reasonable but can explode as your user base grows.
Criteria Evaluation
Data Collection: 3/5 – Manual event tracking only, no autocapture
Technical Implementation: 3/5 – Requires developer setup for comprehensive tracking
Scalability & Pricing: 3/5 – Can become expensive at scale
Integration Ecosystem: 4/5 – Strong integrations with major platforms
Analysis Depth: 5/5 – Excellent behavioral analytics and cohort analysis
Community Reviews and Expert Recommendations
Users consistently praise Mixpanel’s analytical depth and flexibility. One reviewer noted: “Mixpanel’s biggest strength is the detail with which it lets you understand what users are actually doing inside your product.” The platform excels at revealing user behavior patterns that other tools miss.
Product managers appreciate the funnel flexibility: “Funnels in Mixpanel aren’t rigid, predefined templates… You can build funnels around any series of user actions.” This adaptability allows teams to analyze their specific user journeys rather than forcing them into generic templates.
However, users acknowledge the complexity trade-off: “There is a learning curve to scramble up, and it can get pricey as you scale.” The platform’s power requires investment in both learning and ongoing costs.
Source: Crazy Egg Mixpanel Review
Pricing
Free plan covers 1 million events monthly. Paid plans start at $24/month but scale with usage. Start at Mixpanel.com.
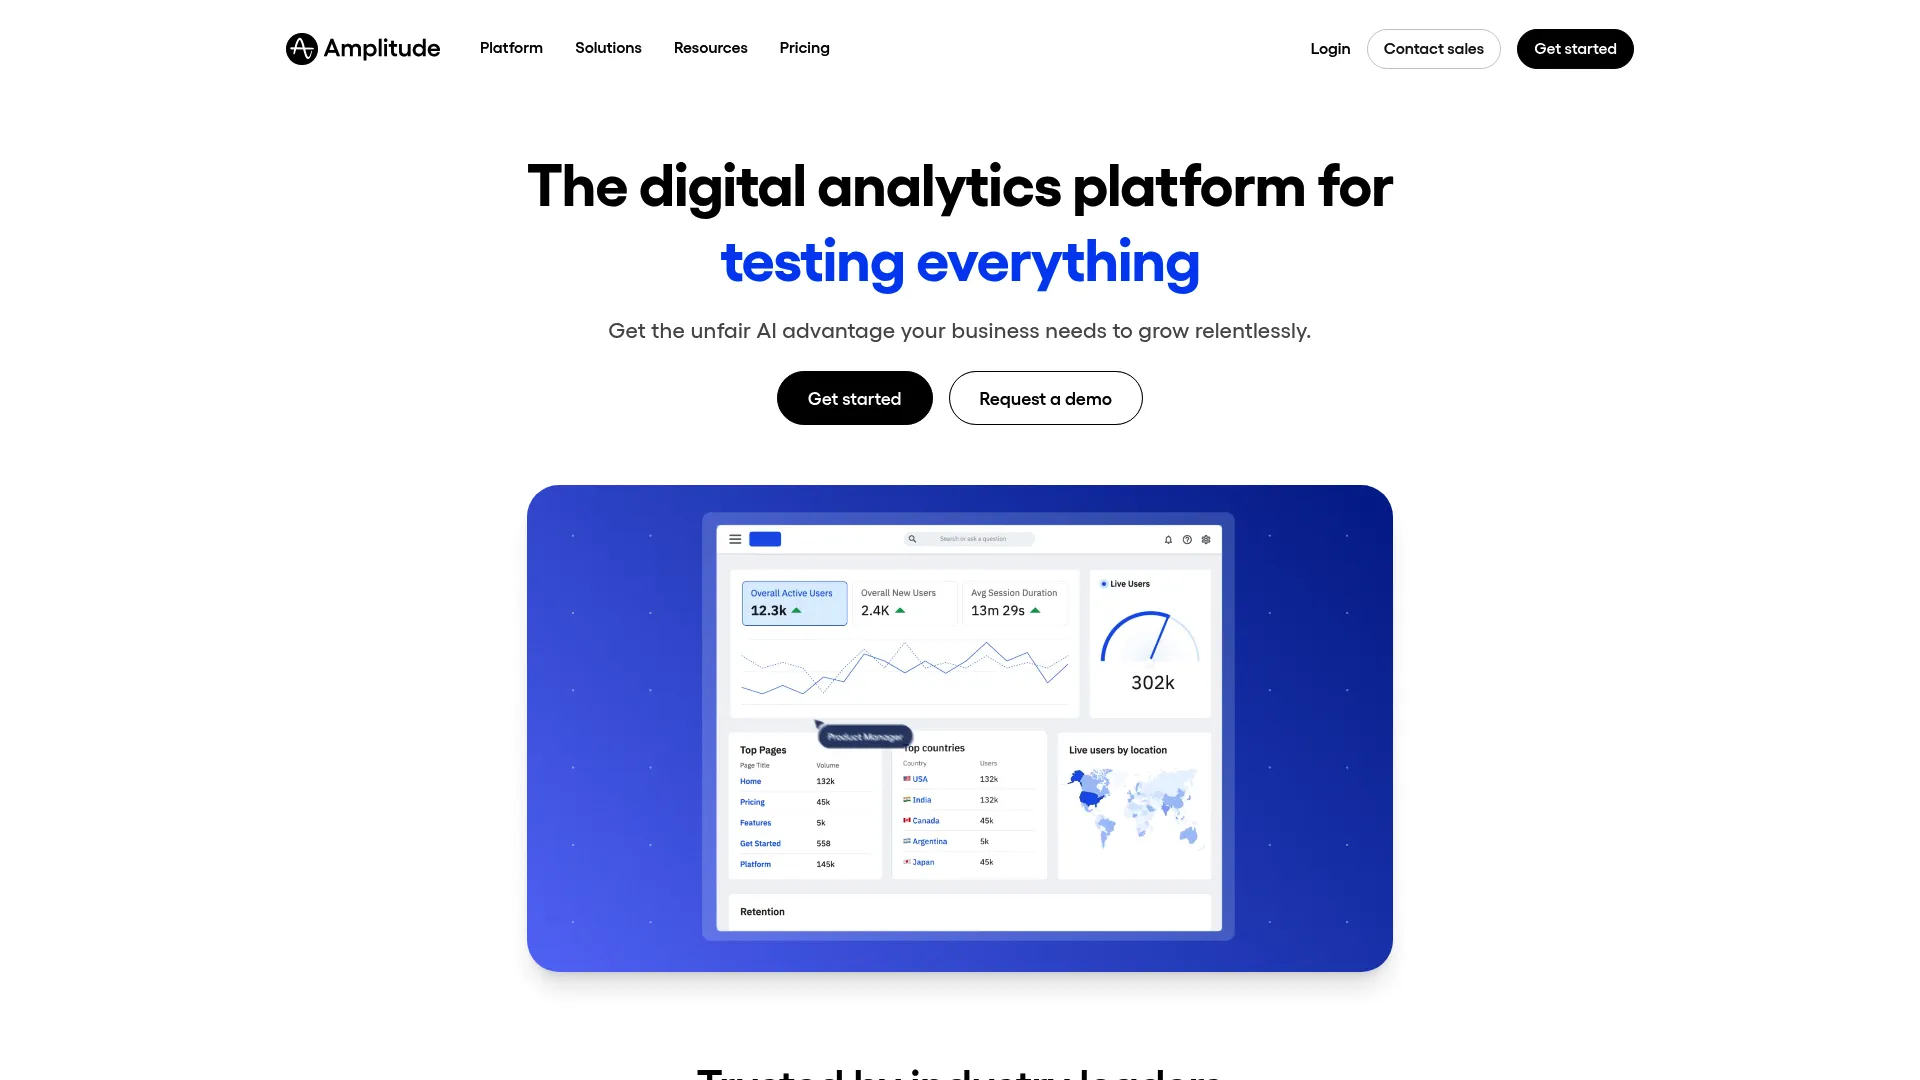
Amplitude – Best Known for Enterprise AI Insights
Amplitude is what happens when you build analytics for companies like PayPal and Disney. It’s powerful, sophisticated, and honestly, might be overkill unless you’re dealing with serious scale.
The AI stuff is genuinely impressive though – you can literally ask questions in plain English and get actual insights back.
The Cool AI Stuff
Ask Questions Like a Human – “Why did conversion drop last week?” and get AI-generated analysis instead of spending hours building queries.
Predictive Analytics – Machine learning that actually predicts which users are about to churn so you can do something about it.
Automatic User Segments – The AI finds user groups you didn’t even know existed.
Built-in A/B Testing includes variance reduction techniques that improve experiment sensitivity. The platform can detect smaller effect sizes with fewer users, making experiments more efficient.
Customer Data Platform Capabilities unify user data across touchpoints. Amplitude can serve as both an analytics platform and a customer data hub, reducing infrastructure complexity.
What Works
Handles Massive Scale – Billions of events without breaking a sweat.
AI That’s Actually Useful – Not just buzzword bingo – the natural language queries actually work.
Enterprise-Grade Everything – Security, compliance, reliability – all the boring stuff that matters for big companies.
Identity Resolution connects user actions across devices and sessions, providing a complete view of the customer journey even when users switch between platforms.
What Doesn’t
No Autocapture – Still need to manually track everything.
Complex as Hell – Great if you have a dedicated analytics team. Overwhelming if you don’t.
Enterprise Pricing – Starts at $61/month but that’s just the beginning.
No Session Replay – You’ll know what happened but not how it looked.
Criteria Evaluation
Data Collection: 3/5 – Manual tracking with flexible autocapture option
Technical Implementation: 3/5 – Requires setup but offers better tooling
Scalability & Pricing: 4/5 – Enterprise-focused pricing, scales well
Integration Ecosystem: 5/5 – Excellent enterprise integrations
Analysis Depth: 5/5 – Advanced analytics with AI insights
Community Reviews and Expert Recommendations
Users praise Amplitude’s speed and analytical depth. One reviewer noted: “Lightning-fast query speeds and real-time analytics” as a key differentiator, highlighting how rapid insights boost productivity.
Enterprise teams appreciate the advanced features: “Robust cohort and segmentation tooling” helps teams precisely identify user behaviors and engagement patterns that drive business outcomes.
However, accessibility remains a concern: “Steep learning curve for non-technical teams” despite the intuitive UI. The platform’s depth requires substantial time investment to master fully.
Cost concerns are common: “Complex event taxonomy and manual tagging overhead” combined with “cost at scale, especially for high-event volumes” can quickly exceed budget expectations.
Source: Userpilot Amplitude Review
Pricing
Starts at $61/month for 1,000 users. Enterprise pricing available. Check it out at Amplitude.com.
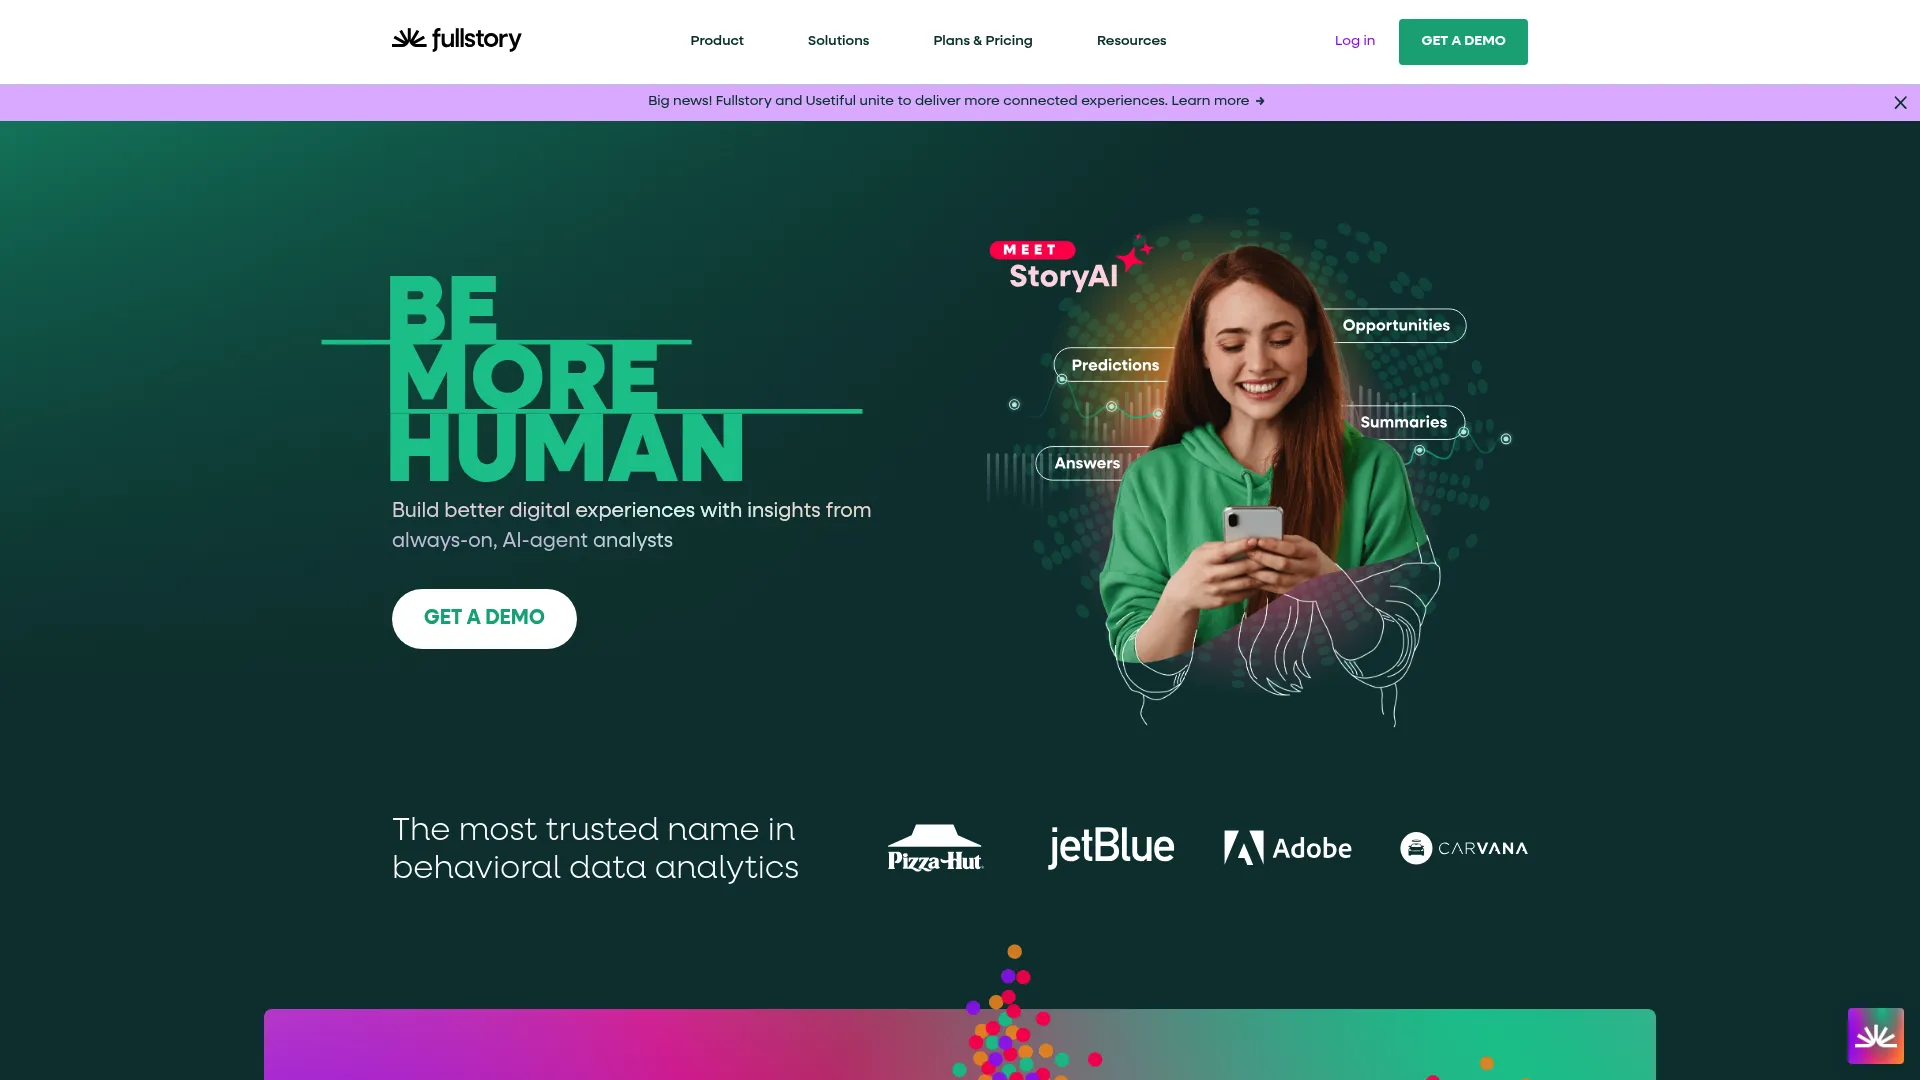
FullStory – Best Known for Session Replay Excellence
FullStory basically invented good session replay. If you’ve ever wanted to be a fly on the wall watching users struggle with your website, this is your tool.
The automatic frustration detection is honestly magical – it finds the sessions where users are having problems without you having to watch thousands of recordings.
What Makes It Special
Pixel-Perfect Recordings – See exactly what users saw, including all the dynamic content and interactions.
Automatic Rage Click Detection – Finds sessions where users are clearly frustrated without you having to hunt for them.
Mobile + Web – Track user behavior across all your touchpoints.
Team Collaboration – Comment on sessions and share insights with your team.
Heatmaps and Click Tracking provide aggregate views of user behavior patterns. These visualizations complement individual session replays with broader usage trends across your entire user base.
The Great Parts
Best Session Replay Period – Nobody does this better. The recordings are incredibly detailed and reliable.
Non-Technical Friendly – Customer support, UX designers, product managers can all use it without developer help.
Finds Problems Automatically – The frustration detection saves hours of manual session review.
Advanced Search and Segmentation help you find specific user experiences quickly. You can filter sessions by user properties, actions taken, or frustration signals encountered.
The Not-So-Great Parts
Expensive and Secretive – Premium pricing with no public rates. You’ll need to talk to sales.
Light on Pure Analytics – Great for qualitative insights, but you’ll need other tools for deep behavioral analysis.
No A/B Testing – You can identify problems but not test solutions.
Criteria Evaluation
Data Collection: 4/5 – Automatic capture with some manual configuration
Technical Implementation: 4/5 – Easy setup with visual interface
Scalability & Pricing: 2/5 – Premium pricing, not transparent
Integration Ecosystem: 4/5 – Good integrations, collaboration features
Analysis Depth: 4/5 – Strong qualitative insights, moderate quantitative
Community Reviews and Expert Recommendations
Users consistently highlight FullStory’s session replay quality. One analytics manager shared: “FullStory’s session replay and heatmap features are incredibly powerful for understanding the customer experience at a granular level.”
UX professionals find particular value in the visual insights: “Being able to view and analyze user behaviors through session replays and funnel is invaluable… This direct insight helps in tweaking designs and improving UX and CX.”
Implementation simplicity receives praise: “Ease of implementation (single tag and you’re good to go), 3rd party integrations… have been game changers for our organization.”
However, cost concerns are frequent: “FullStory’s pricing can be on the higher end compared to some basic session replay tools.” Users also note reliability issues with some automated features.
Source: Userpilot FullStory Review
Pricing
Custom pricing starting around $247/month. Contact sales at FullStory.com.
Pendo – Best Known for In-App Guidance Integration
Pendo tries to be the Swiss Army knife of product experience – analytics plus the ability to actually guide users through your product. It’s ambitious, but the execution can be hit or miss.
Great concept: see what users struggle with, then build guides to help them. Reality: it’s complicated to set up and expensive to scale.
What They Promise
Analytics + Action – See user behavior problems and fix them with in-app guides and tooltips.
Visual Event Tracking – Point and click to define events without bothering developers.
User Feedback Collection – NPS surveys and feedback forms that connect to your analytics.
Account-Level Analytics – Understand how entire organizations use your product (great for B2B).
Product Roadmap and Validation Tools help prioritize features based on user feedback and usage data. The platform connects user requests to actual behavior patterns for informed decision-making.
The Good Stuff
Complete Workflow – From identifying problems to fixing them in one platform.
SaaS-Focused – Built for subscription businesses that care about onboarding and adoption.
Visual Interface – Product managers can use it without technical help.
The Problems
Jack of All Trades, Master of None – Does lots of things okay instead of a few things great.
Expensive and Opaque – Pricing averages $48,400 annually with hidden add-on fees.
Steep Learning Curve – Users consistently complain it’s hard to figure out how to use effectively.
Criteria Evaluation
Data Collection: 4/5 – Event autocapture with visual tagging
Technical Implementation: 4/5 – Visual interface, minimal coding required
Scalability & Pricing: 3/5 – Quote-based pricing, can be expensive
Integration Ecosystem: 4/5 – Strong integrations with major platforms
Analysis Depth: 3/5 – Good analytics but broader focus dilutes depth
Community Reviews and Expert Recommendations
Users appreciate Pendo’s comprehensive approach but note complexity challenges. One customer success manager explained: “One of the biggest feedback the team had about Pendo was like, we just don’t know how to use it. And it’s hard to figure out.”
The feature richness creates mixed reactions: “Comprehensive feature set” provides value, but “steep learning curve” and “fragmented analytics UI” slow time to insight.
Pricing concerns are common: “High and non-transparent pricing” with “opaque MAU-based pricing with undisclosed add-on fees” makes cost prediction difficult.
However, teams that master the platform find value: “Out-of-the-box functionality” and “segmentation and targeting” capabilities help improve user engagement when properly implemented.
Source: Userpilot Pendo Review
Pricing
Free plan for 500 users, but that’s not realistic for most businesses. Custom pricing required. Check out Pendo.io.
Crazy Egg – Best Known for Visual Website Analytics
Crazy Egg keeps it simple: visual insights that anyone can understand. No PhD in data science required.
If you just want to see where people click on your website and test different versions, this is perfect. Don’t expect advanced behavioral analysis though.
What It Does
Five Types of Heatmaps – Click maps, scroll maps, move maps – see how users interact with every part of your site.
Session Recordings – Watch users navigate your site with automatic frustration detection.
Built-in A/B Testing – Test different page versions and see which converts better.
Simple Surveys – Ask users what they think right on your website.
Snapshots provide page-specific analysis that focuses on individual page performance. This feature helps optimize specific conversion points rather than analyzing entire user journeys.
Why It Works
Dead Simple Setup – Add one script and you’re done. No developer needed.
Actually Affordable – Free plan available, paid plans start at $29/month.
Visual Insights – Perfect for teams who think in pictures, not spreadsheets.
Complete Toolkit – Identify problems, test solutions, get feedback – all in one place.
The Limitations
Web Only – No mobile app analytics or complex product tracking.
Basic Analytics – Don’t expect sophisticated behavioral analysis or user journey mapping.
Marketing Focus – Built for website optimization, not product analytics.
Criteria Evaluation
Data Collection: 4/5 – Automatic behavior tracking for web
Technical Implementation: 5/5 – Simple script installation, no coding
Scalability & Pricing: 4/5 – Affordable, transparent pricing
Integration Ecosystem: 3/5 – Good basic integrations
Analysis Depth: 3/5 – Strong visual insights, limited advanced analytics
Community Reviews and Expert Recommendations
Users consistently praise Crazy Egg’s simplicity and visual approach. The platform receives recognition for making analytics accessible to non-technical teams who struggle with more complex solutions.
Marketing teams find particular value in the conversion optimization focus. The combination of heatmaps, A/B testing, and surveys provides a complete toolkit for website optimization without overwhelming complexity.
However, users acknowledge the limitations for advanced use cases. Teams requiring sophisticated product analytics or complex user journey analysis typically need additional tools alongside Crazy Egg.
Pricing
Free plan available, paid plans start at $29/month. Start immediately at CrazyEgg.com.
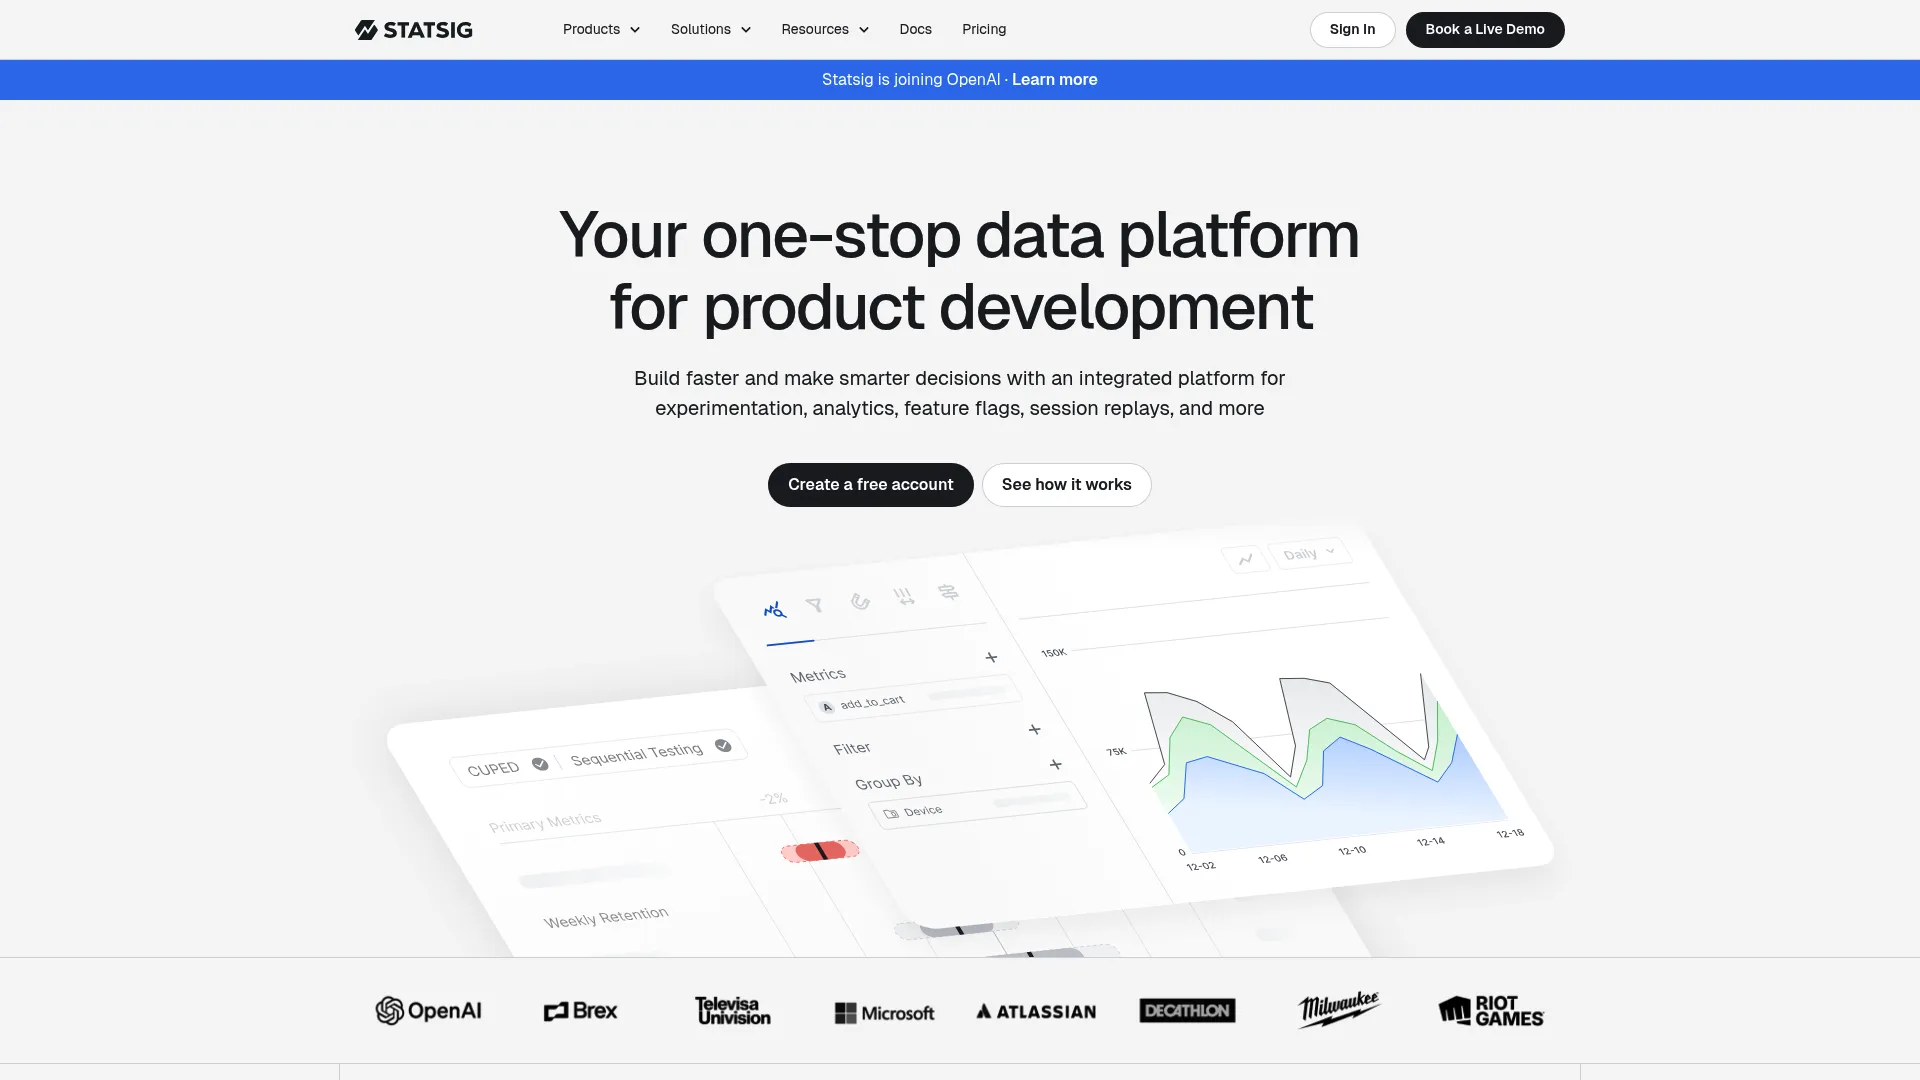
Statsig – Best Known for Unified Experimentation Platform
Statsig was built by Facebook engineers who got tired of the experimentation tools available and decided to build their own. The result? Enterprise-grade reliability with startup-friendly pricing.
If you’re serious about A/B testing and want analytics that actually integrate with your experiments, this is worth a look.
What Makes It Different
Facebook-Scale Infrastructure – Processes over 1 trillion events daily with 99.99% uptime.
Unified Platform – Analytics, A/B testing, and feature flags work together instead of fighting each other.
Variance Reduction – Detect smaller changes with fewer users (translation: faster, more efficient experiments).
Warehouse-Native – Run it on your own data infrastructure if you want complete control.
Session Replay Functionality links directly to analytics data, allowing you to jump from statistical insights to qualitative user experiences.
The Strengths
Built by People Who Actually Use This Stuff – Facebook engineers who scaled experimentation to billions of users.
Everything in One Place – No more juggling separate tools for analytics and experiments.
Transparent Pricing – No surprise costs or complex usage calculations.
Actually Reliable – 99.99% uptime isn’t just marketing speak.
The Challenges
Manual Event Tracking – No autocapture, so you’ll need developer resources for comprehensive setup.
Technical Implementation – Assumes you have engineering resources available.
Newer Platform – Less community support and fewer tutorials than established competitors.
Criteria Evaluation
Data Collection: 4/5 – Manual tracking with comprehensive event support
Technical Implementation: 3/5 – Requires SDK implementation
Scalability & Pricing: 5/5 – Transparent pricing, generous free tier
Integration Ecosystem: 4/5 – Warehouse-native deployment options
Analysis Depth: 5/5 – Enterprise-grade analytics with advanced features
Community Reviews and Expert Recommendations
Users appreciate Statsig’s engineering quality and reliability. The platform’s Facebook heritage provides confidence in its ability to handle large-scale experimentation and analytics workloads.
Technical teams value the warehouse-native approach and transparent architecture. The ability to maintain data control while leveraging sophisticated experimentation capabilities appeals to organizations with strict data governance requirements.
However, the technical implementation requirements can be challenging for smaller teams without dedicated engineering resources. The platform assumes a level of technical sophistication that may not exist in all organizations.
Source: Statsig Testimonials
Pricing
2 million free events monthly, transparent usage-based pricing after that. No sales calls required at Statsig.com.
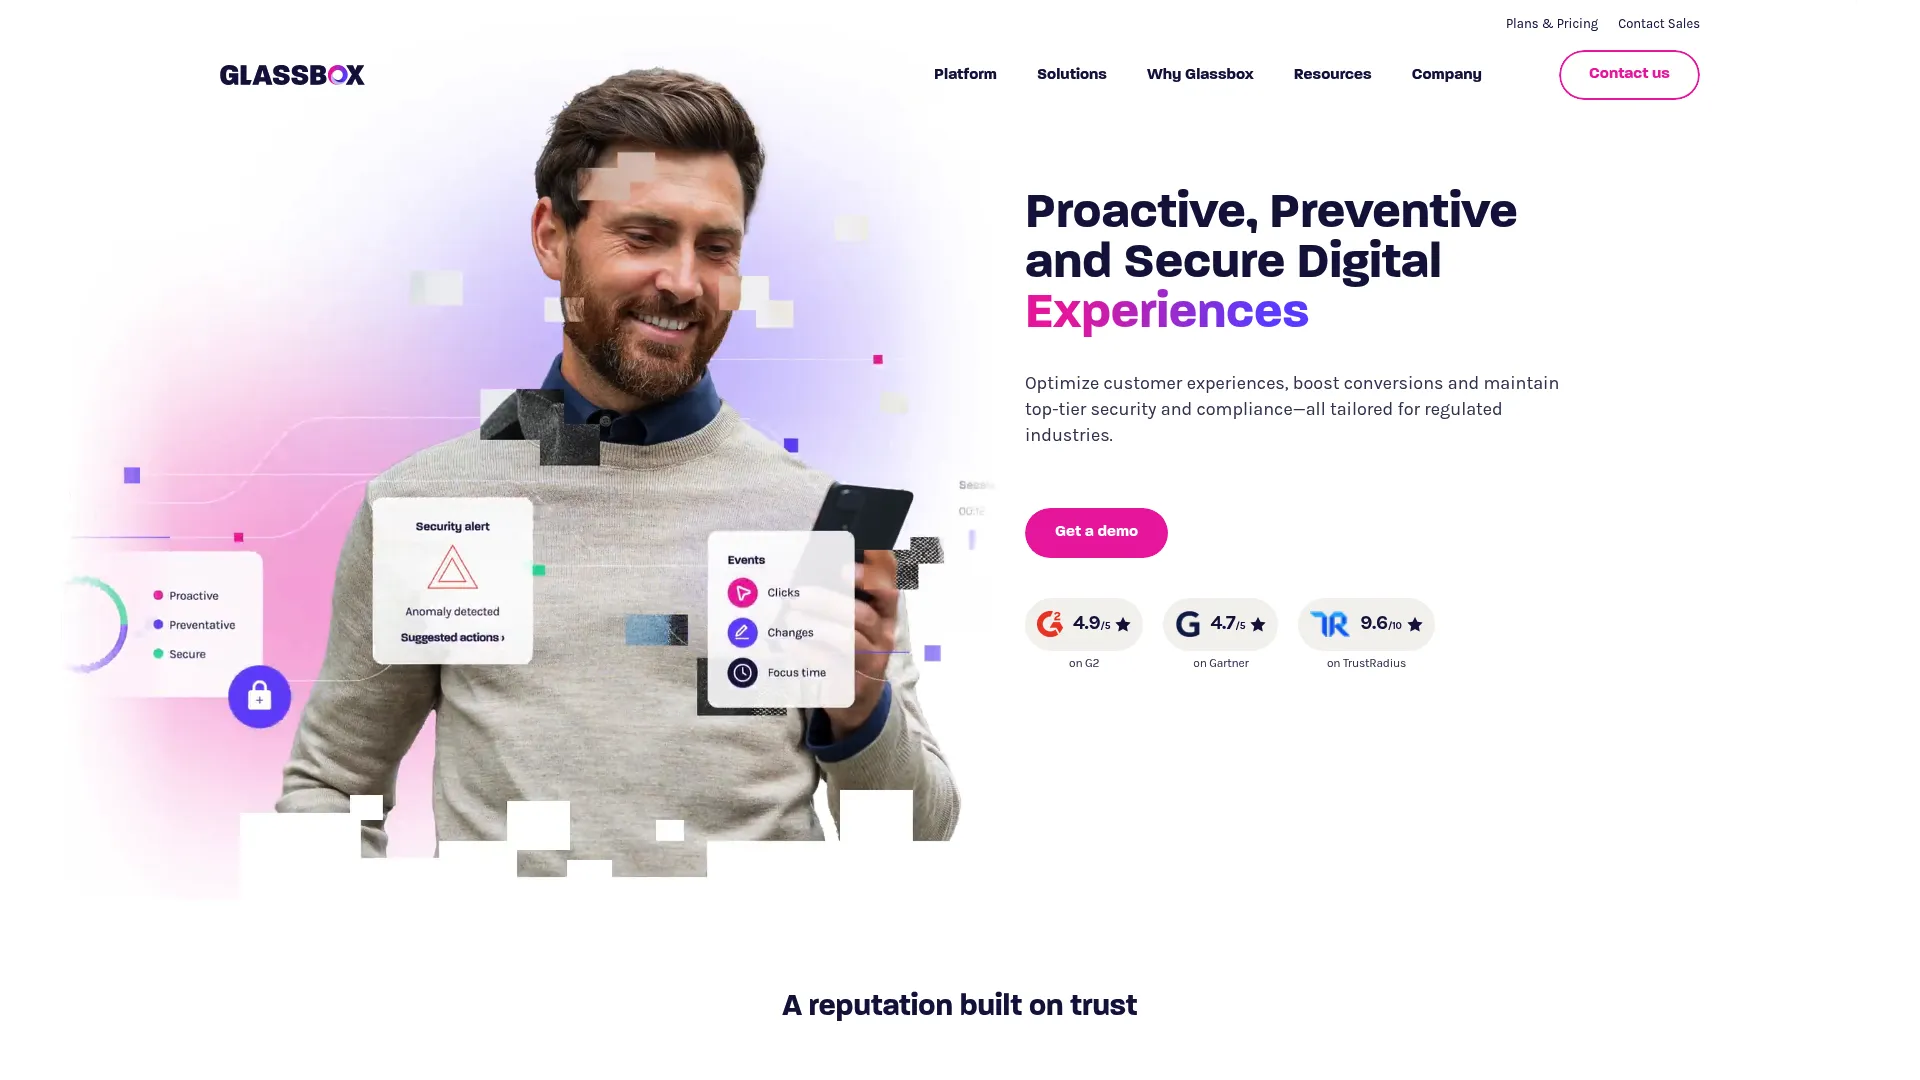
Glassbox – Best Known for Mobile App Analytics
Glassbox carved out a niche in mobile app analytics, especially for retail and e-commerce. They’re not as well-known as the big players, but they do mobile really well.
If you’re running a retail app or need deep mobile analytics, they’re worth considering. Otherwise, you might want to look elsewhere.
Their Focus Areas
Mobile-First Analytics – Built specifically for mobile app experiences, not web-first with mobile as an afterthought.
Retail Specialization – Features designed for e-commerce, like cart abandonment analysis and checkout optimization.
Tagless Tracking – Automatic event capture without manual setup.
Performance Impact Analysis – See how technical issues affect business outcomes.
E-commerce Optimization Tools provide specialized features for retail applications, including cart abandonment analysis and checkout optimization insights.
What They Do Well
Mobile Depth – Better mobile app analytics than most general-purpose platforms.
Industry Focus – If you’re in retail or financial services, they understand your specific needs.
Automatic Tracking – Less developer overhead than manual event platforms.
The Downsides
Niche Player – Smaller community, fewer integrations, less support available.
Limited Scope – Great for specific industries, less valuable outside their focus areas.
Enterprise Pricing – Custom quotes required, likely expensive.
Criteria Evaluation
Data Collection: 4/5 – Tagless tracking with autocapture
Technical Implementation: 3/5 – Good mobile support, requires setup
Scalability & Pricing: 3/5 – Enterprise-focused pricing
Integration Ecosystem: 3/5 – Good but limited compared to competitors
Analysis Depth: 3/5 – Solid analytics but specialized focus
Community Reviews and Expert Recommendations
Financial services users praise Glassbox’s security and compliance features. One FSI analyst noted: “Glassbox provides our FSI company with insights that help us understand the full context of user behavior and enable us to make informed, strategic decisions.”
The platform’s data export capabilities receive recognition: “Real-time data export – Glassbox provides immediate access to a vast amount of data and enables us to cross-reference and analyze it alongside other customer data.”
However, complexity concerns emerge: “While it’s a very intuitive platform, some of the more advanced analytics tools can be complex and require time to master fully. In my experience training is really necessary for these features.”
Source: TrustRadius Glassbox Reviews
Pricing
Custom enterprise pricing. Contact sales at Glassbox.com for retail and financial services use cases.
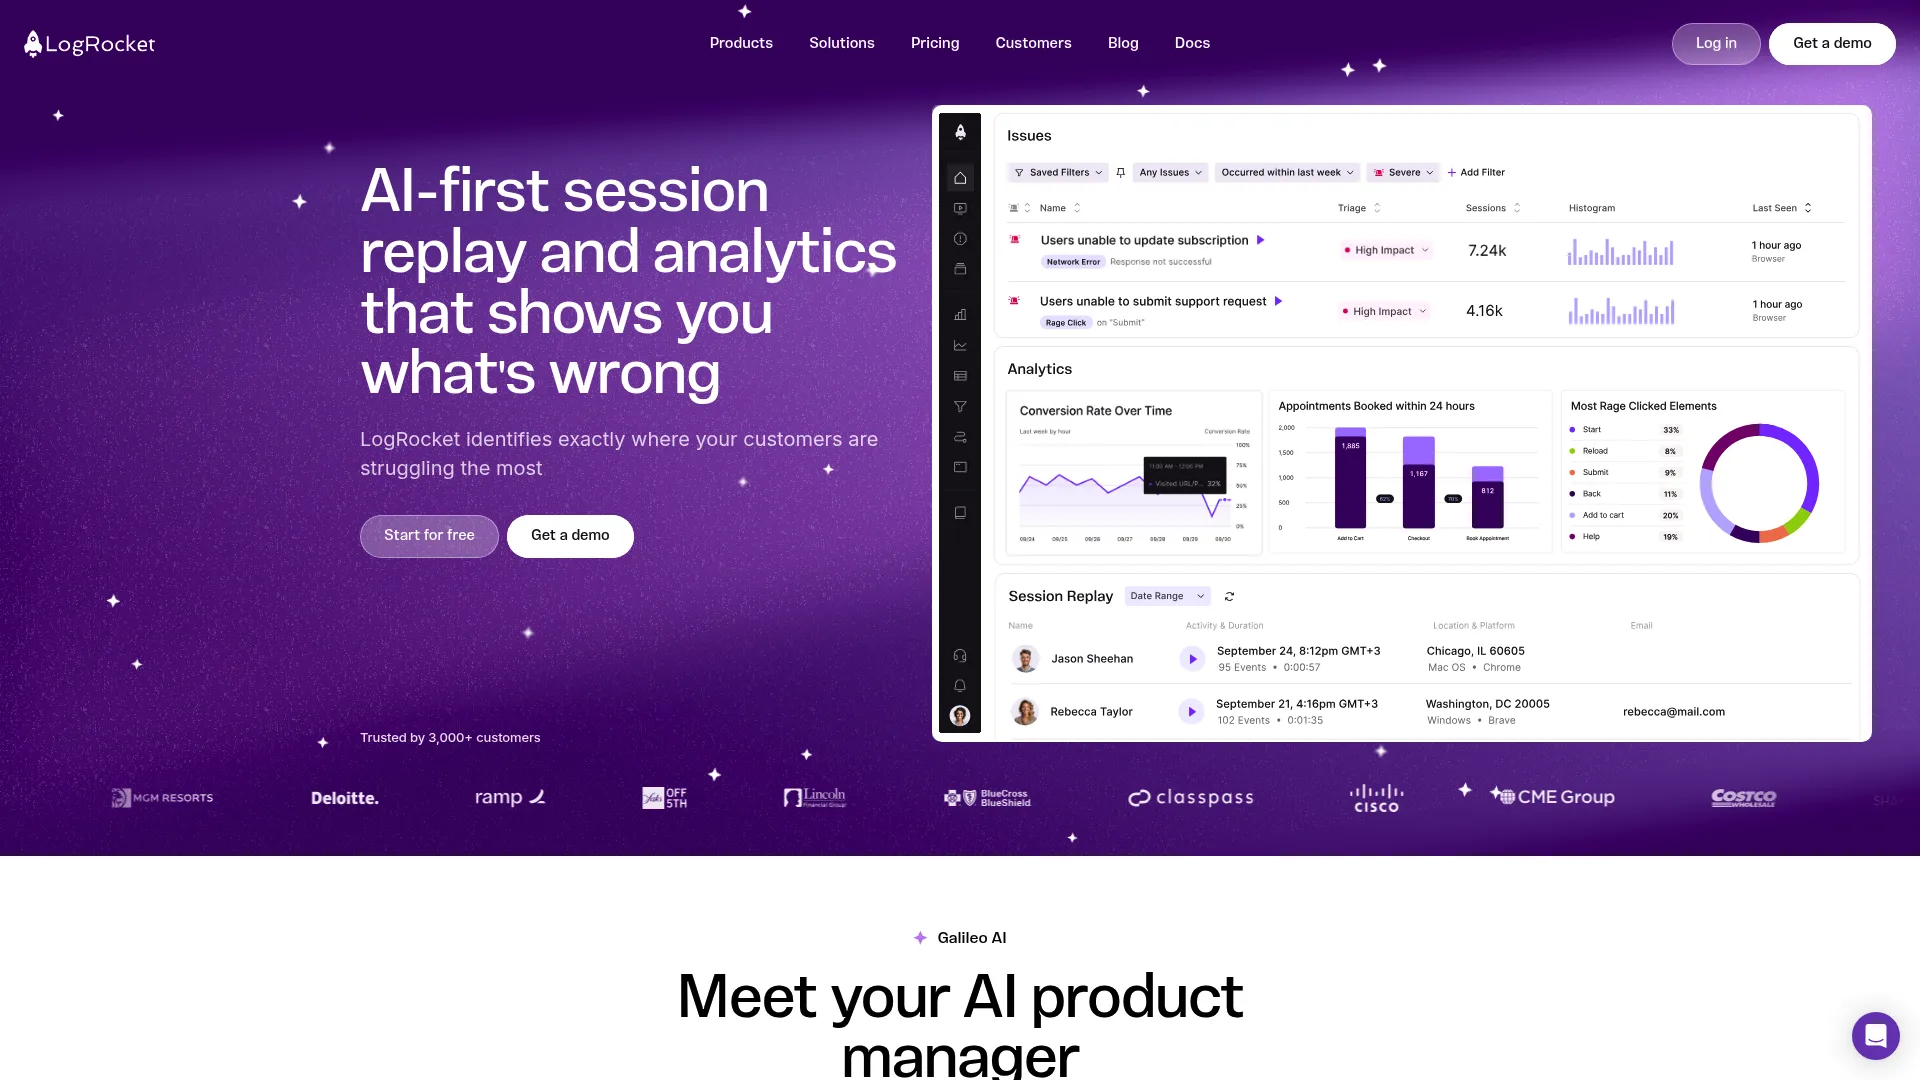
LogRocket – Best Known for Developer-Focused Debugging
LogRocket bridges the gap between “users are having problems” and “here’s exactly why.” It’s session replay with all the technical context developers need to actually fix issues.
Perfect for engineering teams who need to understand both user experience and technical root causes.
Developer-Focused Features
Session Replay + Console Logs – See what users experienced plus all the JavaScript errors and API calls that caused problems.
Error Tracking with Context – JavaScript errors linked to the exact sessions where they occurred.
Performance Monitoring – Core Web Vitals and loading times connected to actual user experiences.
Stack Traces and Source Maps – All the debugging context developers need to fix issues quickly.
User Frustration Signal Detection automatically identifies problematic sessions based on user behavior patterns. The system flags sessions with errors, slow performance, or unusual interaction patterns.
Why Developers Love It
Complete Technical Context – Everything needed to reproduce and fix user-reported issues.
Debugging Integration – Works with existing development workflows and tools.
Performance Insights – Understand how technical issues impact user satisfaction.
The Trade-offs
Developer-Focused – Less accessible to non-technical team members.
Debugging Over Analytics – Great for fixing problems, limited for understanding user behavior patterns.
Technical Setup Required – More complex implementation than simple session replay tools.
Criteria Evaluation
Data Collection: 4/5 – Comprehensive session and technical data capture
Technical Implementation: 3/5 – Developer-focused, requires technical setup
Scalability & Pricing: 3/5 – Reasonable pricing but can escalate
Integration Ecosystem: 3/5 – Good developer tool integrations
Analysis Depth: 4/5 – Deep technical insights, moderate product analytics
Community Reviews and Expert Recommendations
Engineering teams appreciate LogRocket’s technical depth and debugging capabilities. The platform excels at providing the context needed to understand and fix user experience issues.
Users value the combination of visual replay with technical data: “LogRocket combines network requests, custom logs, and stack traces with session replay to help you see the issues ruining the user experience.”
However, the technical focus can limit broader team adoption. Non-technical team members may find the platform overwhelming compared to simpler session replay solutions.
Performance impact concerns occasionally arise, though the platform generally maintains good performance characteristics for most implementations.
Source: FullSession LogRocket vs FullStory Comparison
Pricing
Free plan for 1,000 sessions, Team plan starts at $99/month. Start debugging at LogRocket.com.
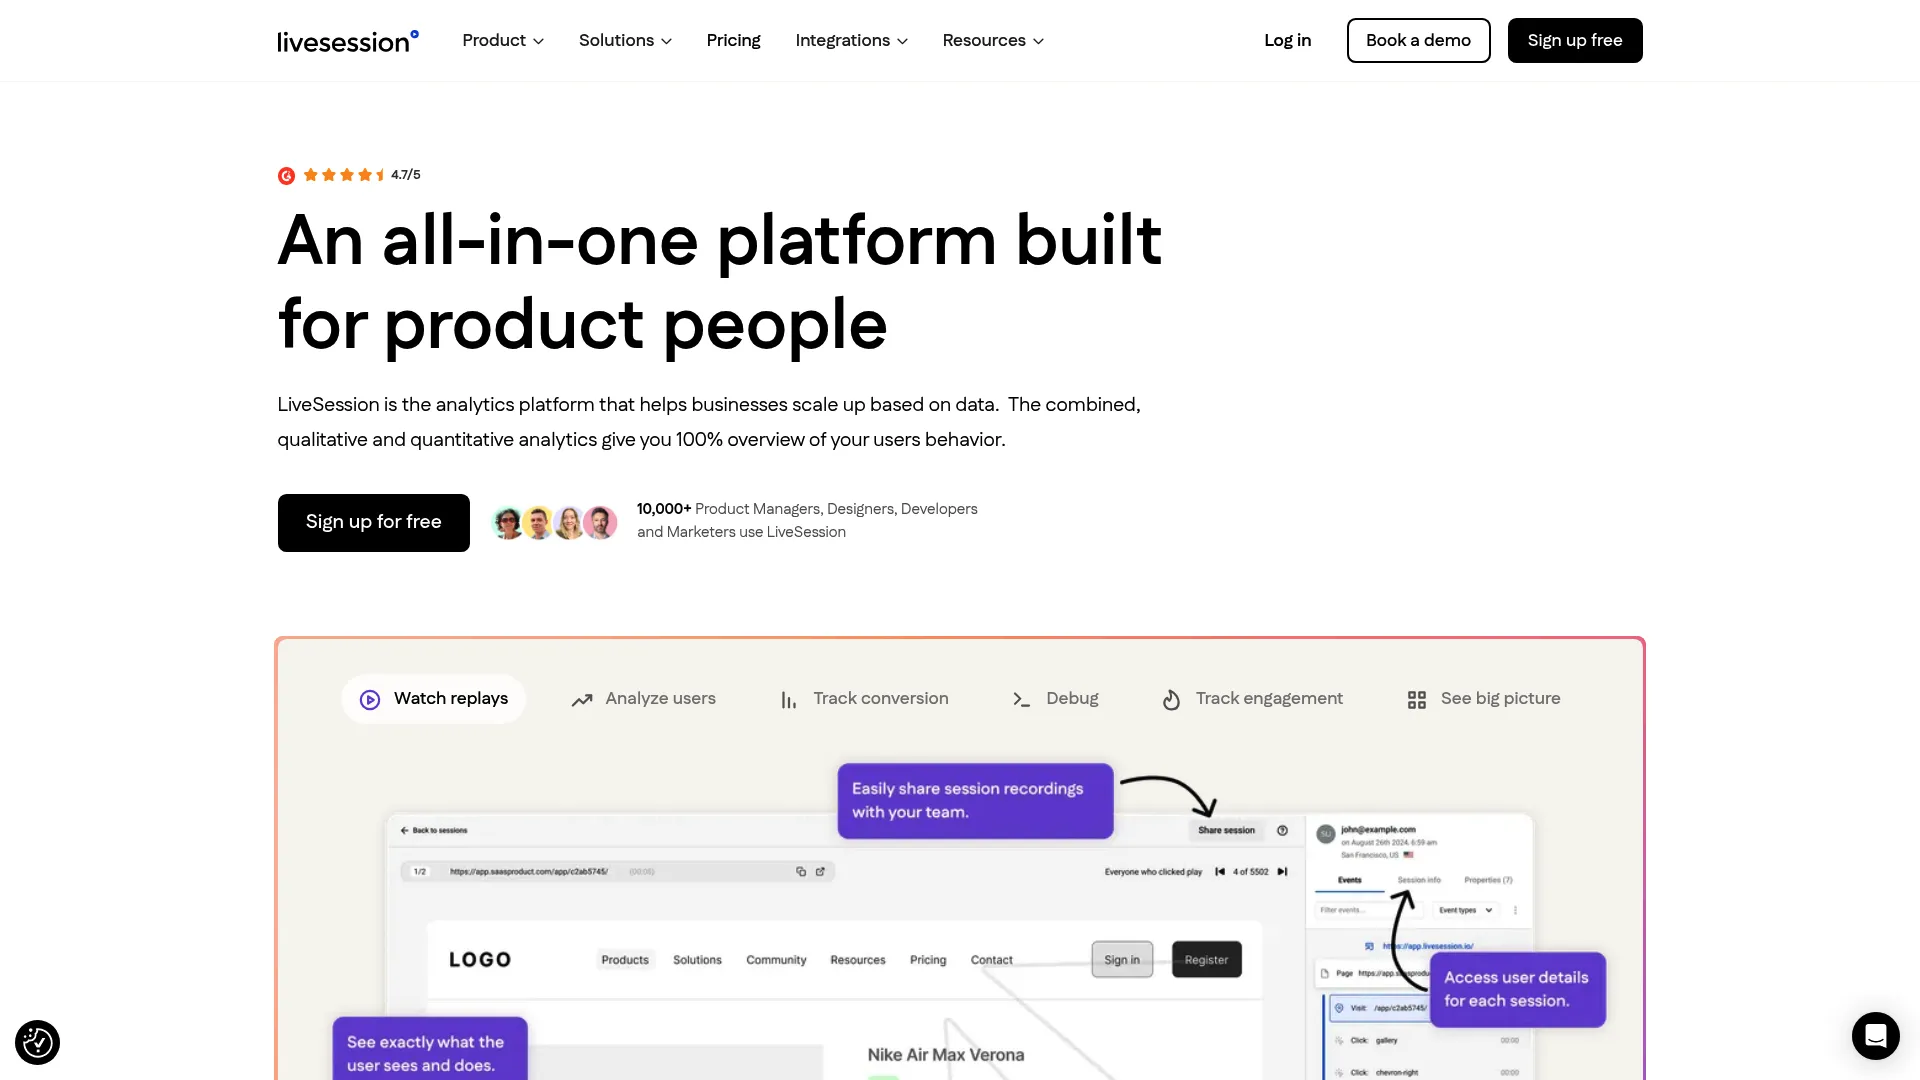
LiveSession – Best Known for Quick Implementation
LiveSession is for teams who want to start gathering user insights today, not next month after extensive setup and training.
It’s not the most feature-rich platform, but sometimes simple and fast beats complex and powerful.
Speed-Focused Approach
2-3 Minute Setup – Add a script and start recording sessions immediately.
Real-Time Processing – See user sessions as they happen, not hours later.
Advanced Filtering – Find relevant sessions quickly without manual review.
Webhook Integrations – Connect to other tools for workflow automation.
Custom Dashboards for KPI monitoring allow teams to track important metrics without complex configuration. The dashboards update in real-time with current user behavior data.
What Works
Great Value – Competitive pricing with solid features for the cost.
Actually Simple – Non-technical teams can use it effectively without extensive training.
Quick Results – Start getting insights within minutes, not weeks.
Good Session Control – Granular filtering to find exactly the sessions you need.
The Limitations
Basic Analytics – Don’t expect advanced behavioral analysis or complex segmentation.
Smaller Ecosystem – Fewer integrations than major platforms.
Session-Focused – Great for understanding individual user experiences, limited for broader product analytics.
Criteria Evaluation
Data Collection: 4/5 – Comprehensive session tracking
Technical Implementation: 4/5 – Easy setup with good developer tools
Scalability & Pricing: 4/5 – Competitive pricing with free plan
Integration Ecosystem: 3/5 – Basic integrations with webhooks
Analysis Depth: 3/5 – Good session insights, limited advanced analytics
Community Reviews and Expert Recommendations
Users consistently praise LiveSession’s ease of use and quick setup. One reviewer noted: “The software can be set up in just 2-3 minutes, making it a time-efficient solution for businesses.”
The session recording quality receives positive feedback: “LiveSession provides top-notch session recording and user analytics, allowing users to understand their audience better and identify any bugs on their website or app in real time.”
Value proposition appeals to cost-conscious teams: “Compared to other platforms like Fullstory and Hotjar, LiveSession offers an attractive price to features ratio, making it a cost-effective solution for businesses.”
However, some limitations are acknowledged: “LiveSession currently does not offer the ability to view live sessions, a feature that is crucial for real-time customer support.”
Source: JoinSecret LiveSession Reviews
Pricing
Starts at $65/month with 14-day free trial. Get started immediately at LiveSession.io.
Notable Mentions
A few other platforms worth knowing about, even if they didn’t make the main list:
Google Analytics 4
GA4 represents Google’s evolution toward event-based analytics with enhanced product analytics capabilities. The platform provides autocapture functionality and integrates seamlessly with Google Ads, BigQuery, and Looker Studio. However, its product analytics features remain less mature than dedicated alternatives, making it suitable primarily for teams already invested in Google’s infrastructure.
Explore GA4’s capabilities at Google Analytics for teams prioritizing Google ecosystem integration.
Contentsquare
An enterprise-grade solution designed for large brands focusing on digital customer journeys. Contentsquare combines experience analytics, session replays, and user feedback integration to provide comprehensive insights. The platform excels in enterprise environments but comes with significant complexity and custom pricing that may deter smaller organizations.
Learn more about enterprise digital experience at Contentsquare.com.
Smartlook
A balanced alternative combining qualitative and quantitative insights through session recordings, heatmaps, and event-based funnels. Smartlook provides strong support for both websites and native mobile applications with a generous free forever plan. While it offers essential features for user behavior analysis, it may not satisfy organizations requiring comprehensive analytics solutions.
Start with Smartlook’s free plan at Smartlook.com for balanced analytics insights.
CUX
The first digital experience analytics platform focused on detecting behavioral patterns that correlate with business goals. CUX automates analysis by identifying user frustration moments and provides visit-level analytics rather than individual sessions. The platform emphasizes speed, promising to identify conversion inhibitors within minutes rather than weeks.
Discover automated behavioral analysis at CUX.io for rapid insight generation.
FAQ
What makes PostHog the best Heap alternative?
Honestly? It’s the closest thing to Heap that doesn’t make you feel locked in. You get the same autocapture functionality, but you can actually see the code and even run it yourself if you want. Plus, the free tier is actually generous (1 million events), and you don’t need to sit through sales calls to get started.
The visual labeling tool is clutch too – you can retroactively define events without bugging your dev team every time you want to track something new.
How do pricing models differ between these analytics platforms?
This is where things get messy. Event-based pricing (like Mixpanel) can explode if your users are active – every click, scroll, and page view costs money. User-based pricing (Amplitude) is more predictable but can still get expensive as you grow.
Session-based pricing (FullStory) depends on how much you record. PostHog and Statsig have the most transparent models – you pay for what you use without surprise fees.
Pro tip: Whatever platform you choose, ask about their highest-paying customer’s monthly bill. That’ll give you a reality check on where costs can go.
Which platform is best for non-technical teams?
Crazy Egg, hands down. You add one script and immediately get heatmaps and A/B testing that anyone can understand. FullStory is also great if you need session replay – the interface is intuitive enough for customer support teams to use.
Avoid Mixpanel and Amplitude unless you have dedicated analytics people. They’re powerful but assume you know what you’re doing.
Can these platforms replace multiple analytics tools?
PostHog comes closest to being a true all-in-one solution. Analytics, session replay, feature flags, A/B testing, and surveys in one platform. I’ve seen teams replace 4-5 separate tools with just PostHog.
Statsig is great if experimentation is your main focus – it unifies analytics with A/B testing really well.
But here’s the thing: sometimes specialized tools are better. If you need deep behavioral analysis, Mixpanel still beats the all-in-one platforms. If session replay is critical, FullStory is unmatched.
What should I consider when migrating from Heap?
First, figure out what you actually use Heap for. If it’s mostly autocapture and basic funnels, PostHog is a no-brainer replacement. If you’ve built complex behavioral analysis, you might need something more sophisticated like Mixpanel.
Plan for data gaps during the transition. Run both platforms in parallel for at least a month to make sure you’re capturing everything correctly.
And honestly? This might be a good time to clean up your tracking. Most teams track way more events than they actually use for decision-making.
For teams evaluating comprehensive analytics solutions, consider reading our honest review of Heap Analytics to understand the limitations driving this search for alternatives.
Understanding GA4 audit fundamentals can help you evaluate your current analytics setup before making platform decisions.
Final Thoughts
Look, choosing analytics tools sucks. Every platform promises to be the magic solution that’ll finally make sense of your user data. Most of them oversell and underdeliver.
Here’s what I’ve learned after trying way too many of these platforms:
Start with your actual needs, not feature lists. Do you need to watch session replays or just understand conversion funnels? Are you trying to debug technical issues or optimize marketing campaigns? The “best” platform is the one that solves your specific problems.
Simple usually wins. I’ve seen teams spend months setting up sophisticated analytics platforms, only to end up looking at the same basic metrics they could have gotten from simpler tools. Don’t let perfect be the enemy of good enough.
Your team matters more than the tool. The most advanced platform is worthless if your team can’t or won’t use it effectively. Sometimes the “inferior” tool that everyone actually uses beats the “superior” one that sits unused.
Pricing will surprise you. Every platform starts cheap and gets expensive as you scale. Factor in realistic growth when making decisions, not just your current usage.
If I had to pick today, I’d probably go with PostHog for most teams. It’s comprehensive without being overwhelming, transparent without being simplistic, and you can start using it immediately without sales calls.
But honestly? The best analytics platform is the one that helps you make better decisions about your business. Everything else is just features and marketing.
At The Marketing Agency, we’ve helped dozens of businesses navigate this exact decision. The right analytics platform becomes exponentially more valuable when you know how to turn those insights into actual marketing strategies that drive growth.
The analytics tool landscape continues evolving rapidly, with AI-powered insights and predictive capabilities becoming standard rather than premium features. However, the fundamentals remain unchanged: successful analytics implementations depend on clear objectives, proper implementation, and team adoption.
Our data-driven approach helps businesses bridge the gap between having access to user behavior data and knowing how to leverage it for measurable results. Learn more about our advanced analytics for strategic growth methodology.
Whether you’re implementing PostHog’s comprehensive suite or Mixpanel’s behavioral analytics, we help you build marketing strategies rooted in actual user insights rather than assumptions. Ready to stop drowning in data and start using it to grow your business? Sometimes the platform matters less than knowing what to do with the insights.
Ready to turn your analytics investment into marketing growth? The right combination of platform and strategy can transform your user data into revenue-driving campaigns.
