


The average Instagram engagement rate across all industries has dropped to 2.2% in 2025, according to HypeAuditor’s latest data. Basically, people are getting pickier about what they actually engage with, which makes figuring out your engagement rate more important than ever for measuring real social media success. While millions of people are still chasing follower counts, smart marketers focus on the quality of interactions that actually drive business results.
I wasted six months chasing followers before I realized I was building an audience of ghosts. Trust me, you don’t want to make the same mistake.
Table of Contents
-
Understanding Instagram Engagement Rate Fundamentals
-
Choosing and Using Instagram Engagement Rate Calculators
-
Implementing Engagement Rate Insights for Strategic Growth
-
Advanced Analytics and Future-Proofing Your Strategy
TL;DR
-
Engagement rate shows how well your content connects with your audience – way more valuable than follower count for measuring Instagram success
-
Free calculators like Modash give you solid basic analysis, while premium tools offer competitor stalking and historical data tracking
-
Different ways of calculating this stuff (follower-based vs. reach-based) can completely change your results, so understanding the method matters
-
High engagement rates from smaller audiences often deliver better ROI than massive followings with dead followers
-
Modern calculations need to include Stories, Reels, and other interactive features beyond just likes and comments
-
Use engagement data to optimize content strategy, evaluate influencer partnerships, and make actual data-driven marketing decisions
Understanding Instagram Engagement Rate Fundamentals
Let’s start with the basics (because most people get this wrong). Understanding engagement rate isn’t about becoming a math wizard – it’s about figuring out what drives meaningful connections with your audience and why engagement rate has become the gold standard for measuring Instagram success over vanity metrics.
I’ve watched countless creators obsess over hitting follower milestones while completely ignoring whether anyone actually cares about their content. Plot twist: A thousand engaged followers will always crush ten thousand passive ones when it comes to building a business or personal brand.
What Engagement Rate Actually Reveals About Your Content
Engagement rate cuts through all the noise to show you exactly how your audience responds to your content. It’s the difference between having a stadium full of people and having a room full of people who actually care about what you’re saying.
When I first started tracking my engagement rate seriously, I discovered something that blew my mind. My most popular posts (by likes) weren’t necessarily my most engaging posts. A photo that got 500 likes might have a 2% engagement rate, while a carousel post with 200 likes could hit 5% engagement. The difference? The carousel sparked conversations, got saved, and shared.
Similar to how comprehensive GA4 audits reveal hidden patterns in website analytics, Instagram engagement rate calculators expose the true performance of your social media content beyond those surface-level metrics that look pretty but don’t mean much.
The Mathematical Foundation That Powers Every Calculator
Look, I’m going to level with you – most people’s eyes glaze over when we start talking math. But stick with me for a second because this stuff actually matters (and it’s not as boring as it sounds).
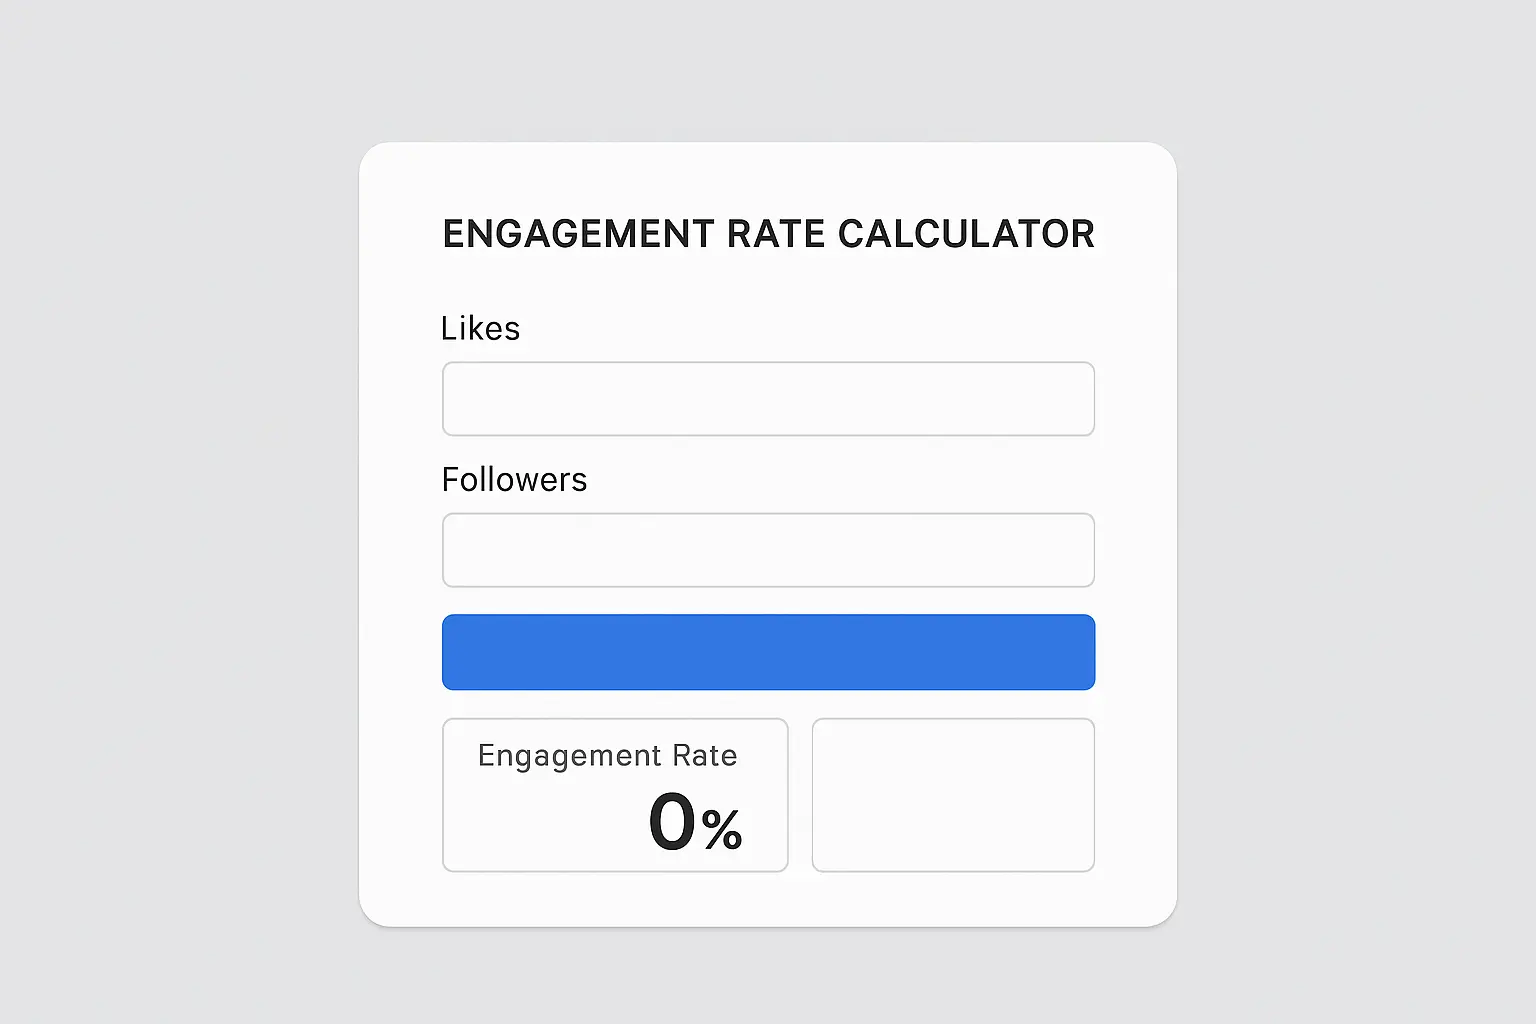
Every Instagram engagement rate calculator starts with the same basic idea: take your total engagement (likes + comments + shares + saves), divide by your follower count, then multiply by 100. Easy enough, right?
Here’s where it gets weird though. That “total engagement” part? Yeah, every calculator counts it differently. Some only look at likes and comments. Others throw in saves, shares, and even those little story poll things you tap on.
I learned this the hard way when I was checking my engagement rate on three different calculators and getting three completely different answers. One said 2%, another said 4%, and the third said 3.2%. Same account, same posts, totally different results. Talk about confusing.
When you’re using any calculator, always check what they’re actually counting. Trust me – it makes a huge difference in how you read your results.
Beyond Basic Metrics: The New Engagement Landscape
Instagram today isn’t the same platform where we all posted blurry photos of our lunch five years ago. Stories get billions of views. Reels are everywhere. People save posts to read later more than they actually comment.
If you’re still only measuring likes and comments, you’re missing like half the picture. Someone might not comment on your post but could spend 30 seconds reading through your carousel or share your Reel to their story. That’s engagement too, right?
I noticed this with my own content. My “engagement rate” was supposedly dropping according to the old-school calculators, but my story views and saves were actually going up. Turns out my audience just changed how they interacted with my stuff.
Just as advanced SEO tools have evolved to track new search engine features, Instagram engagement rate calculators need to adapt to Instagram’s expanding feature set.
Modern calculators that are worth anything include story views, story interactions (you know, those polls and question stickers), Reels plays, and saves. Some even track how long people actually watch your videos.

Industry Benchmarks: What Your Numbers Actually Mean
Okay, so you calculated your engagement rate and got 2.1%. Cool. But is that good? Bad? Mediocre?
Without context, that number means absolutely nothing. It’s like someone telling you they ran a 7-minute mile without mentioning they’re 12 years old or 65 years old – completely different situations.
According to Socialinsider’s latest Instagram Benchmarks report, a good engagement rate on Instagram is 0.70% across all industries, which gives you a baseline for measuring your content performance against platform averages.
Here’s the thing about benchmarks that most people don’t realize: a 1% engagement rate might be amazing or terrible depending on what you do and how many followers you have.
Fashion and beauty accounts usually see 0.9-1.5%. Food accounts can hit 1.5-3.2% (probably because food makes everyone happy). Fitness accounts often get 2-4%. But these are just starting points.
Size matters too, and not in the way you think. Smaller accounts often crush bigger ones:
|
Follower Count |
Average Engagement Rate |
Performance Level |
|---|---|---|
|
1,000 to 5,000 |
4.8% |
Excellent |
|
20,000 to 100,000 |
1.2% |
Good |
|
100,000 to 1,000,000 |
1.0% |
Average |
|
1,000,000+ |
1.2% |
Platform Standard |
I used to beat myself up when my engagement rate dropped as I gained followers. Turns out that’s just how the platform works.
Why Smart Marketers Ignore Follower Count
I used to be obsessed with hitting follower milestones. Get to 10K, unlock swipe-up (back when that was a thing). Hit 100K, call myself an influencer. You know the drill.
But here’s what nobody tells you: follower count is basically meaningless for actual business results.
I know creators with 5,000 followers who make more money than people with 50,000 followers. The difference? Their audience actually cares about what they’re saying.
Chasing followers without engagement is like throwing a party where everyone shows up but nobody talks to you. What’s the point?
The Micro-Influencer Revolution
This is where things get really interesting. Smaller accounts with super engaged audiences consistently beat bigger accounts with zombie followers when it comes to driving real results.
Recent industry analysis from Favikon’s 2025 influencer marketing data reveals that “influencers with 10k–100k followers have an average engagement rate of 6.89%, while those with over 5 million followers see a drop to 2.61%,” which shows the inverse relationship between follower count and genuine audience engagement.
Think about it – would you rather have 1,000 people who hang on your every word, or 10,000 people who scroll past your posts without a second thought?
Micro-influencers (usually 1K-100K followers) often see 2-5% engagement rates. Meanwhile, those mega-influencers with millions of followers? They’re often happy with 0.5-1.5%.
Brands figured this out fast. They’d rather pay someone with 15,000 engaged followers $500 for a post that actually gets people talking than pay a celebrity $10,000 for a post that disappears into the void.
Different Calculation Methods Change Everything
Alright, this is where things get a bit technical, but bear with me because it actually matters for your strategy.
Not all calculators work the same way, and these differences can make your results look completely different.
Follower-Based vs. Reach-Based: The Great Divide
Most basic calculators divide your engagement by your total follower count. But what if Instagram only shows your post to 20% of your followers? Your engagement rate looks terrible even though everyone who actually saw it loved it.
Some smarter calculators use reach instead – so if 1,000 people saw your post and 100 engaged, that’s 10% engagement. Way better than dividing by your 10,000 followers for a sad 1%.
The problem? Most free calculators can’t access your reach data. You need Instagram’s own analytics or fancy paid tools for that.
Using the wrong engagement calculator is like using a broken speedometer – you think you’re going 60 but you’re actually crawling at 30.
Time-Weighted Analysis: When Engagement Happens Matters
Here’s something cool that some advanced calculators do – they weight engagement based on timing. Likes and comments in the first hour count more than ones that trickle in over a week.
This makes total sense when you think about Instagram’s algorithm. Posts that get immediate engagement get shown to more people. A post that gets 100 likes in the first hour is performing way differently than one that slowly gets 100 likes over a month.
Sophisticated calculators factor in the timing of engagement, recognizing that immediate interactions carry more weight than engagement that trickles in over weeks. This approach gives you more nuanced insights into content performance and audience behavior.
Content-Type Specific Metrics: Not All Posts Are Equal
I learned this one the hard way: you can’t compare your Reels engagement to your photo posts using the same standards.
According to recent content performance data, Reels have an average engagement rate of 1.66% while carousels show a 0.55% average engagement rate, which shows how different content formats need separate performance benchmarks.
Reels typically get way more views but lower engagement rates per view. Carousel posts often see higher engagement rates because people spend more time with them. Videos fall somewhere in between.
Smart calculators separate these out. They’ll show you that your Reels average 2% engagement while your carousels hit 4%. That doesn’t mean your Reels suck – they’re just different animals entirely.
Content Type Performance Analysis:
A fashion influencer with 50,000 followers notices their carousel posts consistently hit 3.2% engagement rates, while their Reels average 1.8%. Rather than thinking Reels are underperforming, they realize that Reels reach 3x more people through the algorithm. When they calculate reach-based engagement rates, they discover Reels actually perform better at 8% engagement per impression versus carousels at 5%.
Different content formats on Instagram have totally different engagement patterns and benchmark expectations. Modern calculators differentiate between photos, videos, carousels, and Reels to give you more accurate performance assessments for each content type.
Choosing and Using Instagram Engagement Rate Calculators
The calculator world is basically split between “free but basic” and “paid but fancy.” Which one you need depends on how deep you want to go down the analytics rabbit hole.
Free doesn’t always mean garbage. I’ve used plenty of free Instagram engagement rate calculators that give you solid basic insights without costing you anything.
Free Instagram Engagement Rate Calculator Options
Free calculators give you an accessible starting point for understanding your engagement metrics without any financial investment. While they have limitations, these tools offer valuable insights for small businesses and individual creators just starting their analytics journey.
The catch? Most free tools look at your last 12-24 posts, crunch some numbers, and spit out a percentage. No fancy charts, no historical data, no competitor stalking. Just the basics.
But sometimes that’s exactly what you need. If you’re just starting out or managing a small account, a simple engagement rate might be all you need to figure out if your content is working.
Similar to how we evaluate SEO content tools for their feature sets and limitations, choosing the right free Instagram engagement rate calculator requires understanding what each tool offers and where it falls short.
Basic Calculator Functionality and Limitations
Free calculators are pretty straightforward: type in your Instagram handle, wait a few seconds, get your number. Done.
They’ll usually show you which posts did best and worst, maybe break down likes versus comments. Some even compare you to industry averages (which can be either encouraging or depressing).
What they won’t do is track how you’re doing over time, spy on your competitors, or connect with your other marketing tools. They’re like snapshots, not movies.
The accuracy varies too. Some free tools are still stuck in 2
The accuracy varies too. Some free tools are still stuck in 2019 and only count likes and comments, completely missing saves, shares, and all the story stuff.
Most free calculators provide essential engagement rate calculations with user-friendly interfaces, but they lack advanced features like competitor analysis, historical trending, or detailed demographic breakdowns that premium tools offer.
Modash and Other Reputable Free Tools
Modash is probably the best free option I’ve found. Their calculator actually works consistently (shocking, I know), and I’ve tested it against paid tools – the basic numbers match up pretty well.
Plus, their website doesn’t assault you with pop-ups demanding your email before showing you anything. Revolutionary concept, right?
Social Blade and Phlanx also have decent free calculators. They all look a bit different, but they’ll give you the core metrics you need without the headache.
The key with free tools is managing expectations. They’re great for quick checks and basic understanding, but don’t expect the depth you’d get from premium analytics platforms.
Free Instagram engagement rate calculators by Modash and similar platforms offer reliable basic calculations with user-friendly interfaces, making them ideal for small businesses and individual creators starting their analytics journey.
Premium Calculator Features Worth Considering
Premium calculators justify their price tags through features that free tools just can’t match. We’re talking historical data, competitor stalking, automated reports, and integration with all your other marketing stuff.
Whether it’s worth paying for depends on what you’re trying to do. Managing multiple client accounts? Need detailed reports for your boss? Premium tools become pretty essential.
Just as premium SEO tools like Ahrefs and SEMrush offer advanced features that justify their cost for serious marketers, paid Instagram engagement rate calculators provide sophisticated analytics for professional social media management.
Paid engagement rate calculators offer advanced analytics, competitor insights, and detailed reporting that can justify their cost for serious marketers and agencies managing multiple accounts or campaigns.
Historical Data Analysis and Trending
This is where premium calculators really shine. Instead of just telling you your current engagement rate, they show you how it’s changed over weeks, months, even years.
I can see exactly when my engagement tanked (usually after I got too promotional) or spiked (often after going viral or when Instagram changed their algorithm). This long-term view helps me understand what actually moves the needle.
Some tools even overlay external events – algorithm updates, holidays, industry drama – so you can see how outside stuff affects your numbers.
Premium tools track engagement rate changes over time, helping identify content strategy effectiveness, seasonal patterns, and the impact of algorithm changes on your account performance.
Competitor Benchmarking Capabilities
Competitor analysis is where things get really interesting (and slightly creepy). You can see which competitors have better engagement rates and figure out what they’re doing differently.
More importantly, you can track competitor engagement over time. If someone’s numbers suddenly spike, you can investigate what changed and maybe steal their strategy.
Some tools let you create whole competitor groups and track multiple accounts at once. Super valuable for understanding where you stand in your market.
Advanced calculators allow you to compare your engagement rates against competitors or industry averages, providing strategic insights for content optimization and campaign planning.
Automated Reporting and Integration Features
Automated reports save you hours of manual work. Premium calculators can generate weekly or monthly engagement reports and email them to whoever needs to see them.
Integration is huge too. The best tools connect with Google Analytics, Facebook Ads Manager, and other platforms. You can see how Instagram engagement correlates with website traffic or actual sales.
For agencies managing tons of accounts, these automation features aren’t nice-to-haves – they’re survival tools.
High-end calculators integrate with marketing dashboards and provide automated reports, streamlining workflow for agencies managing multiple client accounts and campaigns.
Audience Quality Assessment Tools
Premium calculators often include fake follower detection. They analyze engagement patterns to spot bot activity and adjust your engagement rates accordingly.
This matters because fake followers inflate your numbers but don’t actually engage. A calculator that identifies and excludes fake followers gives you way more accurate rates.
Some tools also break down your audience demographics – age, location, interests of people actually engaging with your content. Super helpful for figuring out if your engaged audience matches who you’re trying to reach.
Sophisticated calculators analyze follower authenticity, engagement patterns, and audience demographics to identify fake followers and ensure engagement rate accuracy for partnership decisions.
Premium Tool Comparison:
A marketing agency managing 15 client accounts uses HypeAuditor’s premium features to track a beauty brand’s engagement rate over six months. The tool reveals that engagement drops 40% during promotional posts but spikes 200% during tutorial content. The automated reporting feature emails weekly summaries to stakeholders, while competitor analysis shows their main rival’s engagement rate declined 15% after switching to more sales-focused content.
Implementing Engagement Rate Insights for Strategic Growth
Calculating your engagement rate is just the beginning. The real magic happens when you actually use that data to make your content better.
I’ve seen way too many people obsess over their numbers but never change anything based on what they learn. Don’t be that person.

Raw engagement rate data means nothing without action. I used to screenshot my follower count every time it hit a round number. Embarrassing? Yes. Effective? Not even close.
The magic happens when you dig into which specific posts drive your highest engagement rates and reverse-engineer why they worked.
Content Optimization Based on Engagement Data
Using engagement rate calculations to refine your content strategy ensures every post contributes to building a more engaged, valuable audience rather than just adding to your content volume.
Identifying High-Performance Content Patterns
Your Instagram engagement rate calculator should show you which posts killed it and which ones flopped. But don’t just look at the numbers – dig into the why.
Maybe your best posts all use bright colors. Or your audience loves behind-the-scenes stuff more than polished promotional content. Could be that asking questions in captions gets way more comments than making statements.
I track posting times too. My Tuesday morning posts consistently crush my Friday afternoon content, even though logic says Friday should be better.
Write this stuff down. Create a playbook based on what actually works for your audience, not what some guru on YouTube says should work.
Analyzing which posts generate the highest engagement rates helps identify successful content themes, posting times, hashtag strategies, and visual elements that resonate with your audience.
Content Optimization Checklist:
-
Identify top 10 highest-engaging posts from last 3 months
-
Analyze visual elements (colors, composition, lighting)
-
Review caption styles (questions vs statements, length, tone)
-
Document optimal posting times and days
-
Track hashtag performance patterns
-
Note content themes that drive engagement
-
Create content templates based on successful patterns
Much like how successful businesses use strategic blog topic research to create content that resonates with their audience, analyzing your highest-performing Instagram posts reveals the themes and formats that drive genuine engagement.
A/B Testing Content Variables
A/B testing removes the guesswork. Test one thing at a time and measure how it affects your engagement rate.
Try different caption lengths. Post similar content at different times. Use different hashtag strategies. Change your visual style. Then see which changes actually move your numbers.
The key is testing one variable at a time. If you change your posting schedule AND your hashtags simultaneously, you’ll have no idea which change made the difference.
Using engagement rate calculators to measure the impact of different captions, hashtags, posting schedules, and content formats creates a data-driven approach to content creation.
Influencer Partnership Evaluation
Using engagement rates to evaluate influencer partnerships is like checking a car’s engine before buying it. Follower count tells you nothing about results.
Engagement rate calculators serve as essential tools for evaluating potential influencer partnerships and measuring campaign success beyond vanity metrics.
Vetting Influencer Authenticity
Before working with any influencer, I calculate their engagement rate across 20-30 recent posts. This shows patterns that looking at one post might miss.
Real influencers have consistent engagement with natural ups and downs. Fake ones often show weird spikes and drops, or suspiciously steady rates that scream “bot activity.”
Look at comment quality too. Real audiences leave varied, thoughtful comments. Bot engagement is usually generic stuff like “Great post!” or “Amazing!” with zero personality.
According to recent marketing industry analysis, “engagement rate is one of the most important performance metrics in digital marketing, because it goes beyond reach and tells you how your audience is actually interacting with your content,” which emphasizes why authentic engagement matters more than follower count for partnership success.
Calculating engagement rates across multiple recent posts helps identify influencers with genuine audiences versus those with inflated follower counts or bot engagement.
Campaign ROI Measurement
Track your own engagement rate before, during, and after influencer collabs. Good partnerships should boost your engagement as their audience discovers you.
Watch the influencer’s engagement on sponsored posts too. If their engagement drops dramatically on paid content, their audience probably doesn’t trust their recommendations.
Tracking engagement rate changes during and after influencer collaborations helps measure campaign effectiveness and inform future partnership decisions and budget allocation.
Negotiating Fair Partnership Terms
Engagement rate data gives you serious negotiating power. An influencer with 100K followers and 1% engagement reaches fewer engaged people than someone with 50K followers and 3% engagement.
Use this to negotiate rates based on actual engaged audience size, not just follower count. It’s fairer for everyone and leads to better results.
Using engagement rate data to negotiate influencer rates based on actual audience engagement rather than follower count ensures better value for marketing investments.
|
Influencer Profile |
Followers |
Engagement Rate |
Engaged Audience |
Estimated Value |
|---|---|---|---|---|
|
Fashion Micro |
25,000 |
5.2% |
1,300 |
$200-300 |
|
Lifestyle Macro |
150,000 |
2.1% |
3,150 |
$800-1,200 |
|
Beauty Mega |
500,000 |
1.4% |
7,000 |
$2,000-3,000 |

Advanced Analytics and Future-Proofing Your Strategy
Instagram keeps evolving, and your measurement approach needs to evolve too. Stories, Reels, Shopping tags, Live videos – they all create new ways for people to engage.
Traditional engagement calculations miss most of these interactions. You need to stay ahead of the curve.
Instagram’s continuous evolution requires marketers to understand emerging engagement metrics and prepare for platform changes that affect how engagement rates are calculated and interpreted.
Emerging Engagement Metrics Beyond Traditional Calculations
Instagram’s introduction of new features impacts engagement measurement, requiring marketers to adapt their calculation methods and strategic approaches to capture the full picture of audience interaction.
Stories and Reels Engagement Integration
Stories engagement is tricky because the metrics are totally different. Views, replies, story shares, poll responses – they all show engagement, but you can’t really compare them to post likes.
Reels make it even more complicated. A Reel might get 10,000 views but only 100 likes. Good or bad? Depends on your goals and how you weight different interactions.
Some advanced calculators create weighted engagement scores that account for all these different types. They might count a story reply as equal to two post comments, or weight Reel shares higher than regular likes.
Modern engagement rate calculations must account for Stories views, Reels plays, and interactive stickers, as these formats often drive higher engagement than traditional feed posts.
Multi-Format Engagement Analysis:
A fitness coach tracks engagement across all content types: feed posts average 3.2% engagement, Stories average 8% completion rates with 15% interaction rates, and Reels achieve 1.8% engagement but reach 5x more people. By weighing reach and engagement together, they discover Reels generate the most total engaged interactions despite lower percentage rates.
Cross-Platform Engagement Correlation
Your Instagram engagement doesn’t exist in a vacuum. Smart marketers track how Instagram performance connects to other platforms and actual business results.
High Instagram engagement might correlate with more website traffic, email signups, or sales. Or you might find that your most engaged Instagram followers are also your best customers.
This cross-platform view shows whether your Instagram strategy actually supports your business goals or just creates pretty numbers that don’t matter.
Advanced analytics examine how Instagram engagement rates correlate with performance on other social platforms, providing insights into overall brand health and audience behavior patterns.
Building Long-Term Engagement Strategy
Sustainable Instagram growth requires using engagement rate data to build authentic community relationships rather than chasing short-term metric improvements that don’t contribute to business goals.
Community Building vs. Engagement Gaming
It’s tempting to use engagement pods, follow-for-follow schemes, or other tricks to boost your numbers artificially. These work short-term but kill long-term growth.
Real engagement comes from providing actual value. Education, entertainment, inspiration, solutions to problems. When you focus on helping people, engagement rates improve naturally.
Gaming the system might boost your numbers temporarily, but it doesn’t build the kind of community that actually drives business results.
Focusing on creating genuine value for your audience rather than using tactics that artificially inflate engagement rates leads to more sustainable growth and better business outcomes.
Community Building Strategy Template:
1. Value Proposition Definition
-
What unique value do you provide?
-
How
-
How does your content solve audience problems?
-
What makes your perspective different?
2. Audience Understanding
-
Who is your ideal engaged follower?
-
What are their pain points and interests?
-
When and how do they prefer to engage?
3. Content Pillars (Choose 3-4)
-
Educational content
-
Behind-the-scenes insights
-
Community spotlights
-
Industry commentary
4. Engagement Tactics
-
Ask meaningful questions
-
Respond to every comment within 2 hours
-
Create content based on audience feedback
-
Host regular live sessions or Q&As
Preparing for Algorithm Changes
Instagram’s algorithm changes constantly. What worked last month might bomb today. Regular engagement rate monitoring helps you spot these changes quickly.
When your engagement suddenly drops across all content types, it’s usually an algorithm change, not a you problem. Quick identification lets you adapt before things get really bad.
Build flexibility into your strategy. Don’t rely on one content type or posting approach. Diversification protects you when Instagram decides to shake things up.
Recent platform data shows that Instagram accounts with fewer than 1,000 followers average 8% engagement, which drops to 1.7% for accounts with 100,000+ followers, according to Influencer Marketing Hub’s analysis, highlighting how algorithm changes disproportionately affect larger accounts.
Maintaining consistent engagement rate monitoring helps quickly identify and adapt to Instagram algorithm updates that may affect how your content performs and reaches your audience.
Final Thoughts
Instagram engagement rate calculators are powerful tools, but they’re only as good as what you do with the insights. Success comes from understanding what the numbers actually mean, picking the right tools, and consistently using that data to create better content and build real relationships with your audience.
These calculators won’t magically fix your Instagram. They’re diagnostic tools that show you what’s working and what isn’t. The real work happens when you use those insights to make better content and smarter decisions.
Look, I’m not going to sugarcoat this – tracking engagement rates can feel like homework. But it’s the difference between posting into the void and actually building something meaningful.
Start with free tools to get your baseline, then upgrade to premium calculators when your needs get more complex. Focus on trends and patterns, not individual post performance. Most importantly, remember that engagement rate is just a means to an end – building an audience that actually supports your goals.
Your engagement rate will go up and down. Algorithm changes, seasonal stuff, and content experiments will all mess with your numbers. What matters is keeping a long-term perspective and consistently providing value. Do that, and strong engagement rates follow naturally.
Ever wonder why your posts with 500 likes feel more successful than ones with 1,000? Now you know – it’s all about that engagement rate, and understanding it changes everything about how you approach Instagram.
