


Table of Contents
-
The Real Problem With Counting Views
-
Why Platform Architecture Changes Everything
-
Virality Is a Ratio, Not a Number
-
The Velocity Factor Most Creators Ignore
-
When “Going Viral” Actually Hurts Your Brand
-
How Audience Quality Trumps Raw Numbers
-
The Metrics That Actually Predict Viral Success
-
Building Systems That Create Repeatable Momentum
TL;DR
Real talk:
-
There’s no magic view count that means “viral” because every platform counts differently
-
Virality = reaching way more people than your baseline predicts (it’s a ratio, not a number)
-
The first 24-48 hours matter more than total views over six months
-
Going viral with the wrong audience will screw up your reach for months
-
Engagement rate + share rate tell you more than view counts
-
You want repeatable systems, not lottery tickets
The Real Problem With Counting Views
You’re Googling “how many views is viral” at 2 AM after your video hit 50K views and you’re wondering if you can call it viral yet.
I’m going to save you some time: that number you’re looking for doesn’t exist.
Yeah, there are articles that’ll tell you it’s 100K. Or 1 million. Or whatever number makes their headline sound authoritative. But here’s what’s actually happening when you ask how many views is viral: you’re assuming virality is a destination rather than a relationship between your content and how people interact with it.
Views measure exposure, not impact. I’d take 50,000 views that bring in 200 customers over 2 million views that do absolutely nothing for my business. The obsession with hitting a specific number distracts from understanding the mechanics of how content spreads and why that spreading matters for your specific goals.
Look, industry observers will tell you that a video needs at least a few thousand views within a few hours to a day to be considered “viral,” yet it would truly need millions of views a day for several days to be called a “viral” video fully. But even these benchmarks fail to account for context, audience size, and platform differences that make universal thresholds meaningless.

Soundstripe did this whole analysis of viral video patterns and found that everyone’s definition is all over the place. Some people call it viral at a few thousand views in the first day. Others say it’s not really viral unless you’re hitting millions of views for several days straight. Which, honestly, just proves my point: there’s no agreed-upon number.
Why the Question Persists Despite Being Unhelpful
We crave clear benchmarks. Ambiguity makes us uncomfortable, especially when we’re investing time and resources into content creation.
Saying “it depends” feels dismissive, so we keep searching for that definitive answer. Social platforms reinforce this by prominently displaying view counts, training us to equate visibility with success. The problem compounds when you see competitors hit certain numbers and assume they’ve unlocked some secret formula.
You didn’t fail because your video hit 40K instead of 100K. You’ve simply participated in a system where context (your niche, audience size, platform algorithm preferences, posting time, and about fifty other variables) determines outcomes more than any single metric ever could. Understanding how TikTok’s algorithm works reveals why the same content can perform wildly differently depending on timing and audience signals.
The consequences of viral content can extend far beyond view counts. In July 2025, a Cincinnati couple’s TikTok video about being denied entry to Kings Island gained over 6.8 million views and 1.3 million likes. The viral moment wasn’t planned or optimized. It simply resonated with millions who found the authentic reaction compelling.
What Happens When You Chase the Wrong Target
Optimizing for views alone creates perverse incentives.
You start making content that panders to the broadest possible audience rather than serving your customers. Your messaging dilutes. Your brand voice shifts toward whatever’s trending, even when it contradicts your values or expertise. And before you know it, you’re making content for an audience that doesn’t even buy from you.
I’ve watched businesses sacrifice their positioning for a brief spike in visibility, only to discover those new viewers never convert because they were attracted to something the brand can’t consistently deliver. Worse, the algorithm learns from that viral content and starts showing your future posts to similar audiences who also won’t convert. You’ve essentially trained the platform to show your content to people who don’t care about it, making it harder to reach the people who do.
Here’s a specific example: I worked with a B2B SaaS company in 2023 that went viral with a meme about work-from-home struggles. Got 3.2 million views. Their CEO called me at 11 PM excited as hell. The meme audience? Mostly entry-level employees with zero purchasing authority.
Three months later, their organic reach was down 60%. Their next five posts about enterprise security features got shown to this same audience, who scrolled past without engaging. The algorithm interpreted this as “low-quality content” and reduced overall reach. They traded long-term visibility to their target audience (CTOs and IT directors) for a temporary spike among people who will never become customers.
When you’re wondering how many views is viral, you’re missing the more important question: viral among whom?

Why Platform Architecture Changes Everything
TikTok counts a view after three seconds. Three seconds! That’s barely enough time to realize you don’t want to watch it.
YouTube requires 30 seconds for most engagement metrics. Instagram counts a view on Reels at three seconds but Stories at whatever fraction of time someone pauses. Twitter (sorry, X, still sounds weird) counts a view if the video is at least 50% visible for two seconds.
These aren’t minor technical differences. They completely change what “views” measure and how many you can reasonably accumulate. A TikTok video with 500,000 views might represent less watch time than a YouTube video with 50,000 views. Comparing numbers across platforms is like comparing different currencies without checking the exchange rate.
When people ask how many views is viral on TikTok versus how many views is viral on YouTube or how many views is viral on Facebook, they’re assuming these platforms operate similarly. They don’t.
|
Platform |
View Definition |
Typical Viral Threshold |
Distribution Model |
|---|---|---|---|
|
TikTok |
3 seconds watched |
1M+ views in 24-48 hours |
Algorithm-first (strangers by default) |
|
YouTube |
30 seconds watched |
500K+ views in first week |
Search and suggested videos |
|
Instagram Reels |
3 seconds watched |
500K+ views in 48 hours |
Followers first, then expansion |
|
Twitter/X |
50% visible for 2 seconds |
100K+ views in 24 hours |
Network-based with trending boost |
|
|
3 seconds watched |
50K+ views in 48 hours |
Professional network relevance |
These thresholds are based on what I’ve seen work, not some official platform guideline. Your mileage may vary.
The Distribution Model Matters More Than You Think
TikTok’s algorithm shows your content to strangers by default. Instagram prioritizes your existing followers first, then expands if engagement is strong. YouTube relies heavily on search and suggested videos. LinkedIn weights content based on professional relevance and network connections.
Each platform has a different baseline for what constitutes “normal” reach. On TikTok, a creator with 1,000 followers can easily get 100,000 views because the platform tests content with random audiences. That same ratio on Instagram (100x your follower count) would be extraordinary because the platform doesn’t distribute content as aggressively beyond your network.
Research from Shortimize’s 2025 TikTok analysis reveals that around 1 million views gained within 24-48 hours is the most commonly cited benchmark for viral content on TikTok. This timing-specific threshold demonstrates how velocity matters as much as volume. Accumulating the same views over six months wouldn’t qualify as viral, even though the final number is identical.
Virality on one platform might be standard performance on another. When you’re trying to determine how many views is considered viral on TikTok, you need to understand that the platform’s distribution mechanics make high view counts more achievable than on follower-first platforms. The question of how many views to go viral depends entirely on which platform you’re using and how its algorithm distributes content to potential audiences.

Algorithmic Preferences Shape Viral Potential
Platforms promote content that keeps users on the platform longer.
YouTube loves watch time and session duration. TikTok optimizes for completion rate and immediate rewatches. Instagram values saves and shares over passive views. Understanding what your platform rewards tells you more about viral potential than any view count threshold.
A YouTube video with 200,000 views and 45% average view duration is more “viral” in the algorithm’s eyes than one with 500,000 views and 20% duration because the first video is doing exactly what YouTube wants (keeping people watching). The platform will show that content to exponentially more people, creating sustainable momentum rather than a brief spike.
The principles behind successful Instagram content strategies demonstrate how platform-specific optimization drives better results than generic viral tactics.
Let me give you a specific example because I know this sounds abstract. I know a food creator (makes these insane 60-second pasta videos) who posted a carbonara tutorial that got 800K views. She was pumped. Then she posted a cacio e pepe video that only got 300K views and she thought it flopped.
Except that second video? People watched the whole damn thing. The first one? Everyone bounced after 15 seconds once they realized it wasn’t their kind of pasta.
YouTube’s algorithm promoted the second video more aggressively over the following weeks because it demonstrated genuine audience retention. Within 30 days, the “less viral” video by initial view count surpassed the first one in total views and continued growing while the carbonara video plateaued. This example illustrates why understanding how many views is considered viral on YouTube requires looking beyond raw numbers to engagement quality.
Virality Is a Ratio, Not a Number
Forget the number for a second. Here’s what actually matters:
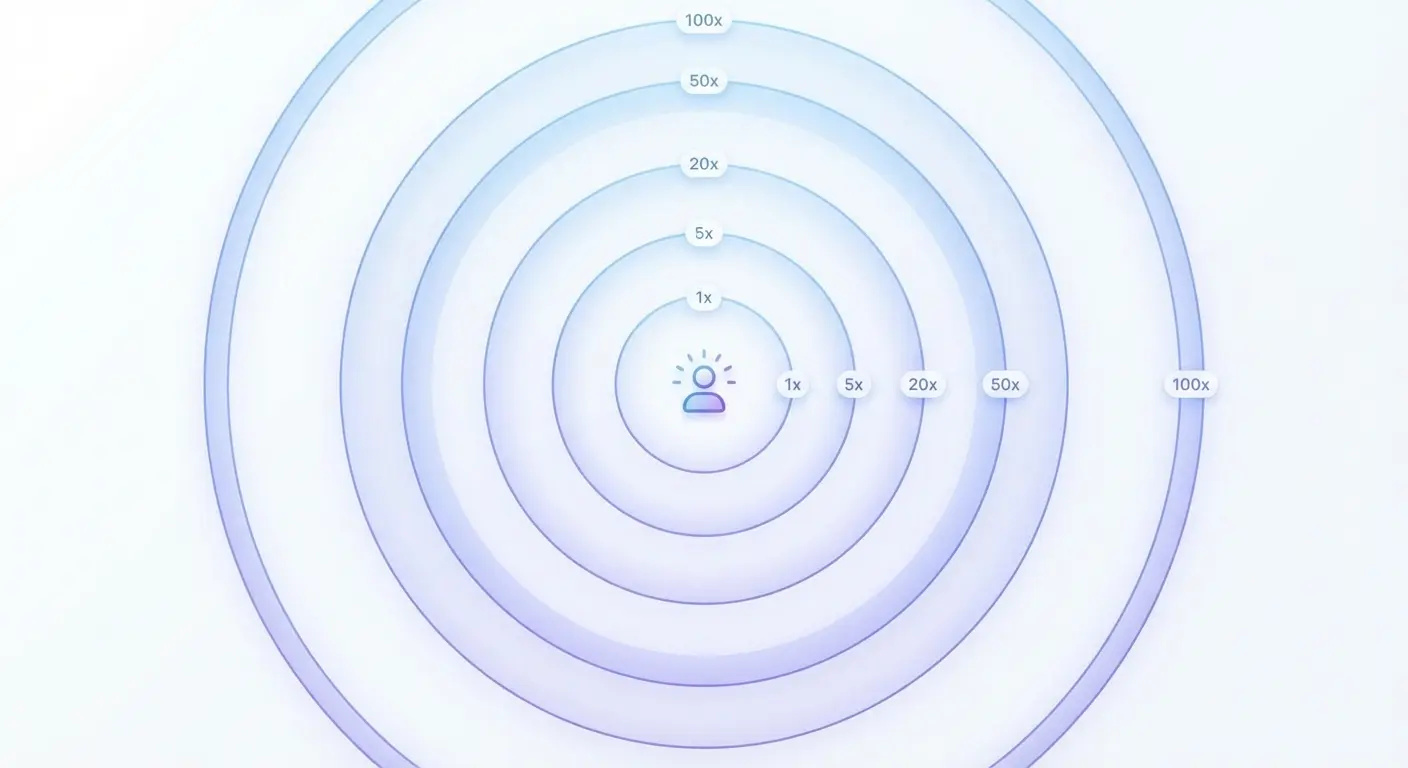
Viral means your content reached way more people than it should have based on your normal performance.
If you have 5,000 followers and your posts typically reach 2,000 people, a post that reaches 50,000 is viral for you. That’s 25x your normal reach. But that same 50,000 views for someone with 500,000 followers who normally reaches 200,000 people? That’s not viral. That’s them having a bad week.
Virality is relative to your baseline. This is why micro-influencers can create viral content without hitting the arbitrary 1 million view threshold that traditional media uses as shorthand for “went viral.” When you’re asking how many views are considered viral or how many views do you need to go viral, you’re looking for an absolute answer to a relative question.
The Reach Multiplier Formula
Calculate your average reach over the last 20 posts. Divide any individual post’s reach by that average.
Anything above 10x your baseline deserves attention. Above 50x, you’ve created something genuinely viral. This framework works regardless of platform or audience size because it measures the spread relative to your normal distribution.
It also helps you identify what’s working. You’re not comparing yourself to MrBeast or Charli D’Amelio who operate in completely different contexts. You’re measuring against your own baseline, which is the only comparison that matters for strategic decision-making.
Reach Multiplier Calculation Template:
-
Establish Your Baseline
-
Pull reach data from your last 20 posts
-
Remove the top 2 and bottom 2 outliers
-
Calculate the median reach from the remaining 16 posts
-
This is your baseline reach number
-
-
Calculate Individual Post Multiplier
-
Take any individual post’s total reach
-
Divide by your baseline reach
-
Result = Your reach multiplier
-
-
Interpret Your Results
-
1-3x baseline = Normal performance
-
3-10x baseline = Strong performance, analyze for patterns
-
10-50x baseline = Viral for your account, document everything
-
50x+ baseline = Genuinely viral, replicate elements immediately
-
Why Absolute Numbers Mislead
A brand with 50 followers that gets 10,000 views has created something 200x more successful than their baseline suggests. That’s viral.
A brand with 2 million followers that gets 10,000 views has failed spectacularly, reaching only 0.5% of their audience. Same view count, completely different stories.
Absolute numbers strip away context. They don’t tell you if you’re building momentum or losing relevance. They don’t reveal whether your content strategy is working or your audience is disengaging. Ratios force you to evaluate performance honestly rather than hiding behind vanity metrics that sound impressive but mean nothing. The question of how many views does it take to go viral can only be answered in relation to your specific audience size and typical performance benchmarks.
The Velocity Factor Most Creators Ignore
Views in the first six hours matter more than total views over six months.
Algorithms prioritize recency and momentum. Content that accumulates views slowly (even if it eventually hits high numbers) doesn’t trigger the algorithmic boost that creates exponential reach. You need velocity: rapid accumulation that signals to the platform “this content is resonating right now, show it to more people immediately.”
A video that gets 10,000 views in the first hour will likely outperform one that gets 50,000 views over three weeks because the algorithm interprets fast engagement as a quality signal worth amplifying. According to Shortimize’s platform research, about one-third of a video’s total lifetime views occur in the first 24 hours if it’s going viral. This concentration of early momentum is what separates truly viral content from posts that simply accumulate views gradually over time.
When you’re fixating on how many views is viral, you’re ignoring the temporal dimension that determines whether content breaks through or fizzles out.

The Critical First 24-48 Hours
Most viral content reaches 60-80% of its total views within the first two days. After that, growth slows dramatically unless secondary factors (media coverage or influencer shares) introduce new distribution channels.
This is why posting time matters. You want to publish when your core audience is most active because their immediate engagement determines whether the algorithm expands distribution. Missing that initial window means you’re starting from a disadvantaged position. The content might still be excellent, but it won’t get the algorithmic push that transforms good content into viral content.
The monetization reality of viral content often surprises creators. Grace Springer, who recorded the now-infamous Coldplay kiss cam moment that garnered nearly 125 million views on TikTok, revealed she “made no money from the video itself or the views” because “it’s not monetised”. This demonstrates that velocity and view counts don’t automatically translate to revenue. Platform monetization requirements and content type determine whether viral success generates income.
Measuring Velocity, Not Just Volume
Track views per hour for the first 24 hours. Compare that rate to your previous content.
If you’re getting 5x more views per hour than usual, you’re likely in the early stages of viral growth. If that rate sustains or accelerates into day two, you’ve hit the algorithmic sweet spot.
This metric tells you in real-time whether content is spreading or stalling, giving you the option to boost high-performing content with paid promotion or strategic outreach while momentum exists.
Velocity Tracking Checklist (First 24 Hours):
Okay, here’s what I actually do in the first 24 hours (and yes, I set phone reminders for this like a psycho):
Hour 1: I just check if anything’s happening. Are views coming in? What’s the engagement looking like? Where’s the traffic from?
Hour 3: This is when I do the math. I pull up my baseline (usually around a couple hundred views per hour for most clients) and see if we’re at 5x, 10x, or holy-shit-what’s-happening levels.
Hour 6: By now, you can tell if it’s real or if you just had a good first hour. Is it still climbing? Plateauing? This is decision time.
Hour 12: If you’re still at 10x+ your normal pace, something’s working. I usually screenshot everything here because I’m paranoid about losing the data.
Hour 24: Okay, if you’ve made it this far and momentum is still there, consider throwing some ad budget behind it. You’re not creating fake virality. You’re amplifying what’s already working.
If velocity 5x+ baseline at Hour 6: Consider immediate paid boost to extend momentum
If velocity plateaus before Hour 12: Analyze hook, thumbnail, or title for issues
Hour 48: Compare 24-48 hour growth to first 24 hours to identify sustained vs. temporary viral trajectory
(And if you’re wondering: yes, this is exhausting. Yes, I still do it. No, I don’t have a better system.)
When “Going Viral” Actually Hurts Your Brand
Here’s something nobody talks about: going viral can absolutely screw up your brand. (Sorry, but there’s no polite way to say it.)
Your follower count shoots up. Looks great in the screenshot you send to your boss. And then, over the next few weeks, your engagement rate falls off a cliff. Why? Because all these new followers don’t actually care about what you normally post. They followed you for that one viral thing, and now they’re just… there. Cluttering up your audience.
Viral content that attracts the wrong audience damages your brand in ways that take months to repair. Your follower count increases, but engagement rate plummets because these new followers aren’t interested in your core content. The algorithm notices the declining engagement and reduces your reach to everyone, including your original audience.
You’ve essentially trained the platform to show your content to people who don’t care about it, making it harder to reach the people who do. I’ve seen brands lose 60% of their organic reach within weeks of a viral hit because they optimized for spread rather than relevance. When you’re obsessing over how many views is viral on Instagram, you’re missing the critical question: are these views from people who align with what you offer?
The Misalignment Tax
Every piece of content teaches the algorithm who your audience is. Viral content that’s off-brand teaches it incorrectly.
You might create a funny meme that gets millions of views, but if your business sells enterprise software, those viewers won’t convert and won’t engage with your actual offerings. The algorithm now thinks your audience wants memes, not software insights.
Your next ten posts (which are on-brand and valuable) get shown primarily to the meme audience, who ignore them. You’ve paid for visibility with relevance, and the exchange rate is terrible.
|
Metric |
Aligned Viral Content |
Misaligned Viral Content |
|---|---|---|
|
Follower Conversion Rate |
3-8% of viewers follow |
0.3-1% of viewers follow |
|
Post-Viral Engagement Rate |
Maintains or increases |
Drops 40-70% |
|
Customer Conversion |
2-5% of new followers convert |
<0.1% of new followers convert |
|
Algorithmic Impact |
Improved reach to target audience |
Reduced reach to original audience |
|
Long-term Value |
Sustainable audience growth |
Temporary spike, lasting damage |
Quality Audience vs. Quantity Audience
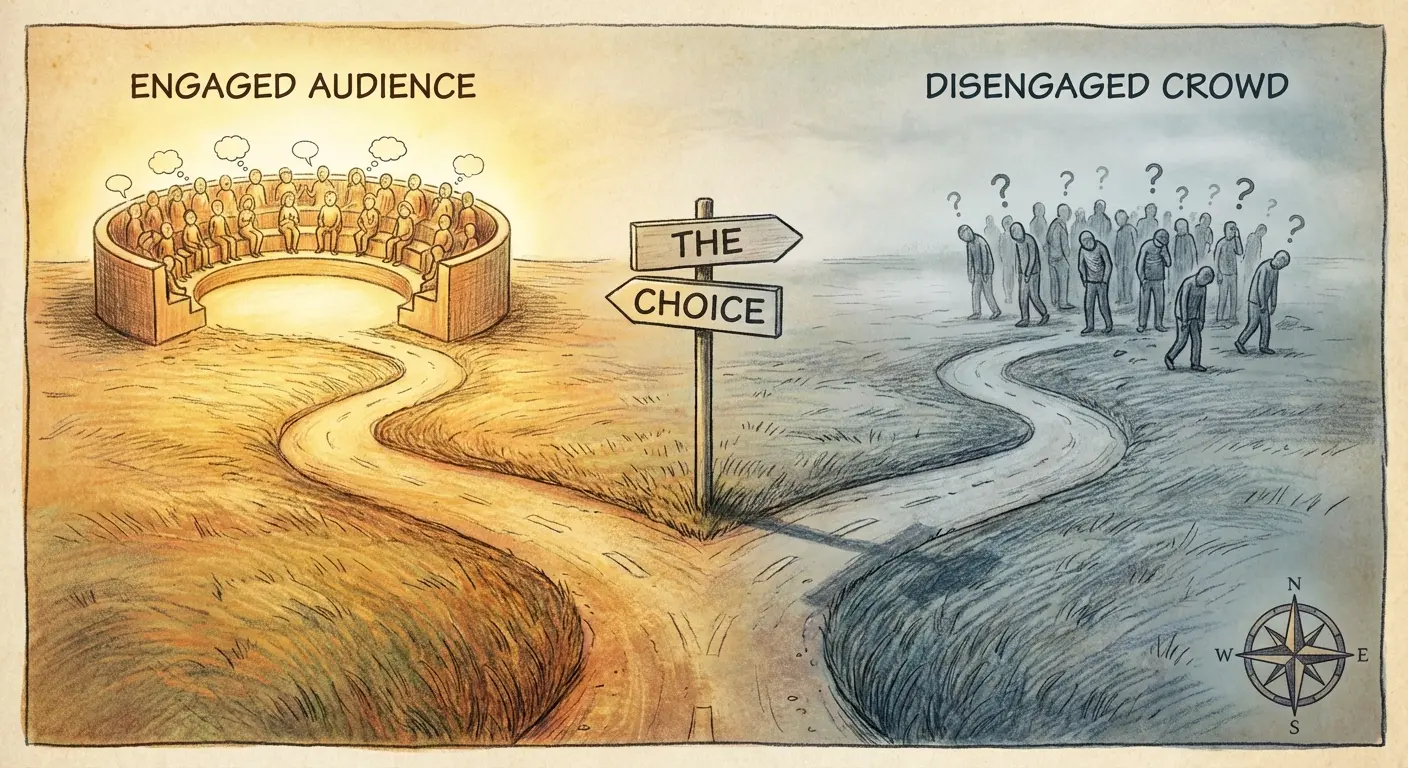
Would you rather have 1,000 followers who buy from you or 100,000 who don’t?
The answer seems obvious, but our behavior suggests otherwise. We chase the bigger number because it looks better in screenshots and pitch decks. Here’s the reality: 1,000 engaged followers generate more revenue, more word-of-mouth growth, and more sustainable business outcomes than 100,000 disinterested ones.
Viral content is only valuable if it attracts people who align with your offering. Otherwise, you’re collecting empty metrics while your competitors build customer relationships. Learn how top social media agencies balance reach with audience quality to drive business results.
How Audience Quality Trumps Raw Numbers
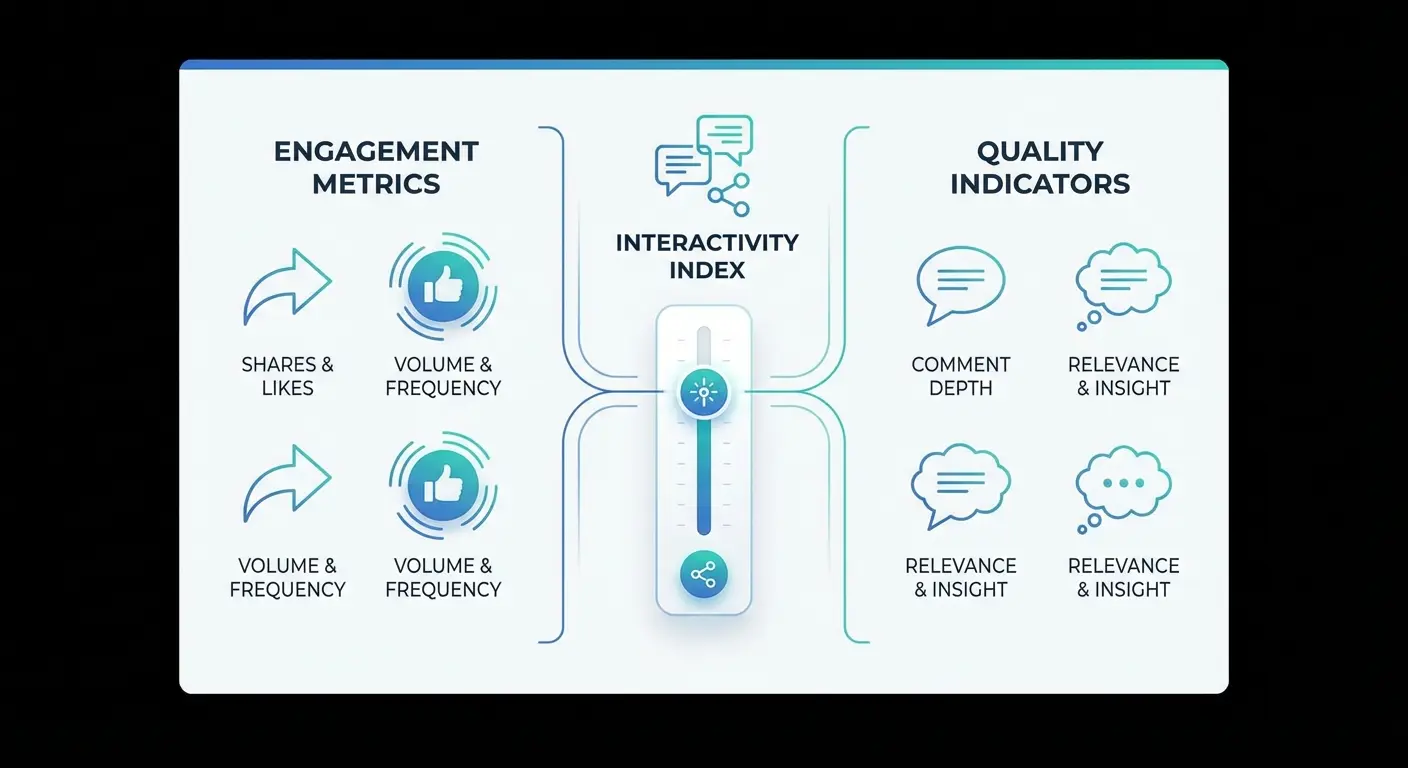
Engagement rate reveals more about viral success than view count.
A video with 20,000 views and a 15% engagement rate (3,000 likes, comments, shares) is more valuable than one with 200,000 views and a 1% engagement rate (2,000 interactions). The first audience is actively participating. They’re invested enough to take action beyond passive consumption.
The second audience mostly scrolled past without caring. Platforms recognize this difference and reward high engagement rates with continued distribution. Low engagement, even with high views, signals that the content isn’t resonating despite being seen. Stop asking how many views is considered viral and start asking what percentage of viewers care enough to interact.
The Share Rate Multiplier
Shares predict viral potential better than any other metric.
When someone shares your content, they’re endorsing it to their network and introducing new distribution channels the algorithm can’t create alone. A 5% share rate (5 shares per 100 views) indicates content with genuine viral potential because each share exposes your content to an entirely new audience who might also share.
Views measure reach. Shares measure resonance. You can manufacture views with paid promotion. You can’t manufacture shares. They require creating something valuable enough that people willingly attach their reputation to it by recommending it to others.
I know this fitness coach (Sarah, she does these quick workout videos) who posted a 60-second ab routine. Got 15,000 views, which for her was solid but not crazy. But here’s what was crazy: 750 people shared it.
I only know that because she DMed me freaking out about it. She’d never had a share rate like that. And each share? That’s going out to, what, 400 people on average? So we’re talking 300,000 new eyeballs from shares alone.
And then those people started sharing it. It snowballed. That “solid but not crazy” video ended up at 280K views without her spending a dollar on ads. The coach’s next three videos all exceeded 100,000 views because the algorithm learned to show fitness content to highly engaged audiences.
Follower Conversion as the Ultimate Test
What percentage of viewers become followers?
This metric separates viral content that builds your brand from viral content that just borrows attention temporarily. If 10,000 people see your content and 50 follow you (0.5% conversion), you’ve created momentary visibility but not lasting impact.
If 10,000 people see your content and 500 follow you (5% conversion), you’ve created something that makes people want more. The content isn’t just entertaining or surprising. It’s establishing you as someone worth following, which is the entire point of content marketing. High conversion rates indicate strong audience-brand alignment, even if absolute view counts are modest.
The Metrics That Actually Predict Viral Success
Completion rate tells you if content is engaging.
On short-form video platforms, you want 70%+ of viewers watching to the end. On YouTube, 50%+ average view duration is strong. High completion rates signal to algorithms that content is worth promoting because people find it valuable enough to finish.
Low completion rates (even with high initial views) tell the algorithm to stop distribution because viewers are leaving quickly. You can’t fake this metric. It requires creating content that delivers on its promise and maintains interest throughout. When you’re wondering how many views is considered viral, remember that completion rate determines whether those views compound or plateau.
The Comment Quality Indicator
Raw comment counts matter less than comment substance.
Ten thoughtful comments asking questions or sharing experiences are more valuable than 100 generic “great post” responses. Substantive comments indicate genuine engagement and often spark conversations that keep people returning to the content.
Algorithms increasingly weight comment quality (length, back-and-forth discussion, time spent in comment section) when determining distribution. They’re trying to identify content that creates community, not just passive consumption. Content that generates real discussion has longer shelf life and continued distribution long after initial posting.

Save Rate as a Hidden Signal
Instagram and TikTok particularly value saves because they indicate content people want to reference later.
High save rates tell the algorithm “this is useful or meaningful enough that people want to keep it,” which is a strong quality signal. Content with 10% save rates (10 saves per 100 views) often gets extended distribution because platforms interpret saves as a proxy for value.
This metric matters more for educational or inspirational content than pure entertainment, but it’s a leading indicator of content that will continue accumulating views long after posting because people keep returning to it.
Building Systems That Create Repeatable Momentum
Viral content isn’t random luck. It’s the result of understanding what resonates and creating conditions for spread.
You need a content testing framework that treats every post as an experiment. Document what you tried, how people responded, and what patterns emerge. Most creators chase virality by copying what worked for others. That’s backward.
You should be identifying what works for your specific audience and doubling down on those patterns. Your viral formula will look different from everyone else’s because your audience, positioning, and strengths are unique. Developing scalable content systems that produce consistent results requires treating virality as a byproduct of quality, not a goal in itself.
The Pattern Recognition Framework
After every 10 posts, analyze your top three performers. What do they have in common?
Topic? Format? Length? Hook structure? Emotional tone? You’re looking for patterns that predict performance. Maybe your audience responds to contrarian takes on industry norms. Maybe they prefer tactical how-to content over theoretical frameworks. Maybe they engage more with personal stories than data-driven analysis.
These patterns tell you what to create more of. Virality becomes less random when you understand the underlying preferences driving it. You’re not guessing. You’re responding to demonstrated audience behavior.

Creating a Content Flywheel
Each piece of content should feed the next.
Viral content attracts new audience members. Your follow-up content converts them into engaged followers. Your consistent posting keeps them engaged until they’re ready to become customers. This requires planning beyond individual posts.
What do new followers see when they visit your profile? Is there a clear value proposition? Do you have cornerstone content that establishes your expertise?
The biggest mistake after viral success is reverting to your previous posting strategy. You now have more people watching. You need content designed to convert that attention into lasting relationships.
When to Amplify Organically Successful Content
If content is performing 3-5x better than your baseline within the first six hours, consider paid amplification.
You’re not creating artificial success. You’re accelerating organic momentum that already exists. The content has proven it resonates. Paid promotion extends its reach beyond what the algorithm alone would provide, potentially triggering additional algorithmic boosts as engagement rates remain high with the expanded audience.
This is the strategic use of paid media: amplifying what’s already working rather than trying to force mediocre content to perform through budget alone. If you’re struggling to identify which content has true viral potential or how to build systems that create consistent growth rather than random spikes, we help brands develop content strategies that align visibility with business outcomes. The Marketing Agency works with you to establish meaningful metrics, test systematically, and scale what’s working (not just what looks good in a dashboard).
Final Thoughts
Virality isn’t a number you hit. It’s a relationship between your content and how people interact with it relative to your baseline performance.
You’ll waste months chasing arbitrary view counts that don’t correlate with business results if you don’t shift your framework. The creators and brands that build sustainable audiences stop asking “how many views is viral” and start asking “what makes my specific audience share content, and how do I create more of that?”
That question leads to systems, patterns, and repeatable processes. The first question leads to disappointment and random acts of content creation.
You’re not trying to win the lottery here. You’re trying to build something that actually, you know, works. Some of that content will occasionally break through to massive audiences. Most of it won’t. Both outcomes are fine as long as you’re attracting people who care about what you offer.
The goal isn’t to be seen by everyone. It’s to be valued by the right ones.
Stop measuring yourself against arbitrary thresholds created by people who don’t understand your business, your audience, or your goals. Build your own benchmarks. Track your own growth. Create content that serves your audience so well that spreading it becomes inevitable.
Look, I get it. It feels good when the numbers go up. I still get a little dopamine hit when something I post does well. We’re all human.
But after doing this for years, I can tell you: the view count high wears off in about 48 hours. You know what doesn’t wear off? Building an audience that actually gives a damn about what you’re doing.
That’s not as sexy as “going viral.” It doesn’t make for a good screenshot. But it’s what actually builds something that lasts.
So yeah, chase the viral moment if you want. Just know what you’re really chasing.
