


You know what’s crazy? I was helping a client last month who was pulling their hair out over their website’s conversion rates. They’d been using Hotjar for two years and kept seeing the same problems but couldn’t figure out what to actually DO about them. We switched them to a different tool, and boom—34% jump in conversions within eight weeks.
Turns out, not all analytics tools are created equal. Some just show you pretty pictures of where people click. Others actually help you fix the problems that are costing you money.
Table of Contents
-
The Quick Version (For People Who Don’t Have All Day)
-
Side-by-Side Comparison: All 10 Tools at a Glance
-
What Actually Matters When You’re Choosing (Spoiler: It’s Not Features)
-
FullSession: The Speed Demon
-
PostHog: The Transparent One
-
Heatmap.com: Shows You the Money
-
Smartlook: Mobile Done Right
-
FullStory: The Enterprise Beast
-
Microsoft Clarity: Free (No, Really)
-
Crazy Egg: The Visual Testing Pro
-
Sprig: AI That Actually Helps
-
Mouseflow: Finds Your Friction Points
-
Lucky Orange: Real-Time Everything
-
The Also-Rans: Other Tools Worth a Look
-
Your Questions Answered
-
How to Actually Pick the Right One
The Quick Version (For People Who Don’t Have All Day)
Look, I get it. You’re busy. You just want to know which tool to pick without reading a novel. Here’s the real talk:
FullSession is your best bet if your website is slow and you can’t afford to make it worse. Zero performance hit, which is basically magic in the analytics world.
PostHog gives you everything for free (up to 5,000 sessions). It’s open-source, so no weird black-box stuff happening with your data. Plus it replaces like five different tools.
Heatmap.com literally shows you which parts of your page make money and which parts lose it. If you’re in e-commerce, this is gold.
Microsoft Clarity is completely free. Forever. No catch. It’s Microsoft flexing, and we all benefit.
Smartlook actually works on mobile apps, not just mobile websites. Most tools fail here miserably.
FullStory is the Ferrari of analytics tools. Expensive, powerful, and probably overkill unless you’re a big company with big problems.
Here’s what nobody tells you: most of these tools are way better at mobile than Hotjar ever was. And the pricing? It’s all over the map—from free to “call us” (which usually means “bend over”).
Side-by-Side: All 10 Tools at a Glance
|
Tool |
Best For |
Price |
Free Option |
Mobile Apps |
What Makes It Special |
|---|---|---|---|---|---|
|
FullSession |
Speed freaks |
$39/month |
Trial only |
Web only |
Won’t slow your site |
|
PostHog |
Open source lovers |
Free |
Yes (5K sessions) |
Actually good |
Shows you the code |
|
Heatmap.com |
E-commerce |
Ask them |
Nope |
Meh |
Revenue tracking |
|
Smartlook |
Mobile apps |
$55/month |
Nope |
Excellent |
Works everywhere |
|
FullStory |
Big companies |
$$ |
Nope |
Good |
AI everything |
|
Microsoft Clarity |
Cheapskates (lovingly) |
Free |
Yes (unlimited) |
Basic |
Microsoft’s gift |
|
Crazy Egg |
Visual people |
$99/month |
Nope |
Limited |
Six heatmap types |
|
Sprig |
AI fans |
$175/month |
Basic version |
Good |
Smart analysis |
|
Mouseflow |
Problem finders |
$31/month |
500 sessions |
Limited |
Friction scoring |
|
Lucky Orange |
Real-time junkies |
$39/month |
100 sessions |
Basic |
Live everything |
What Actually Matters When You’re Choosing
Here’s the thing—most people pick analytics tools like they’re shopping for a car by counting cup holders. They get distracted by feature lists that sound impressive but don’t solve their actual problems.
I’ve watched hundreds of businesses make this choice, and here’s what actually determines success:
Can it collect the data you need? Sounds obvious, right? But you’d be surprised how many tools miss crucial interactions or only work on certain types of websites. If your data has gaps, your insights will too.
Will it play nice with your other tools? Nothing’s worse than having your analytics living on an island. Your new tool needs to talk to Google Analytics, your CRM, your email platform—whatever you’re already using.
Does it actually work on mobile? This isn’t 2015. Most of your traffic is probably mobile, and many tools still treat mobile like an afterthought. Don’t be one of those businesses with a giant blind spot.
What’s the real cost? That $39/month can turn into $400/month real quick when you hit usage limits. Always ask about overage charges and what happens when you grow.
Are you comfortable with their privacy approach? GDPR isn’t going away. Neither is CCPA. Make sure your tool can handle whatever regulations apply to your business.
Will it slow down your website? This is huge. Some analytics tools are like putting a boat anchor on your site. Slower sites = fewer conversions. Kind of defeats the purpose.
Can you actually use the insights? Pretty dashboards are nice, but can you figure out what to DO with the data? Some tools are great at collecting information but terrible at helping you act on it.
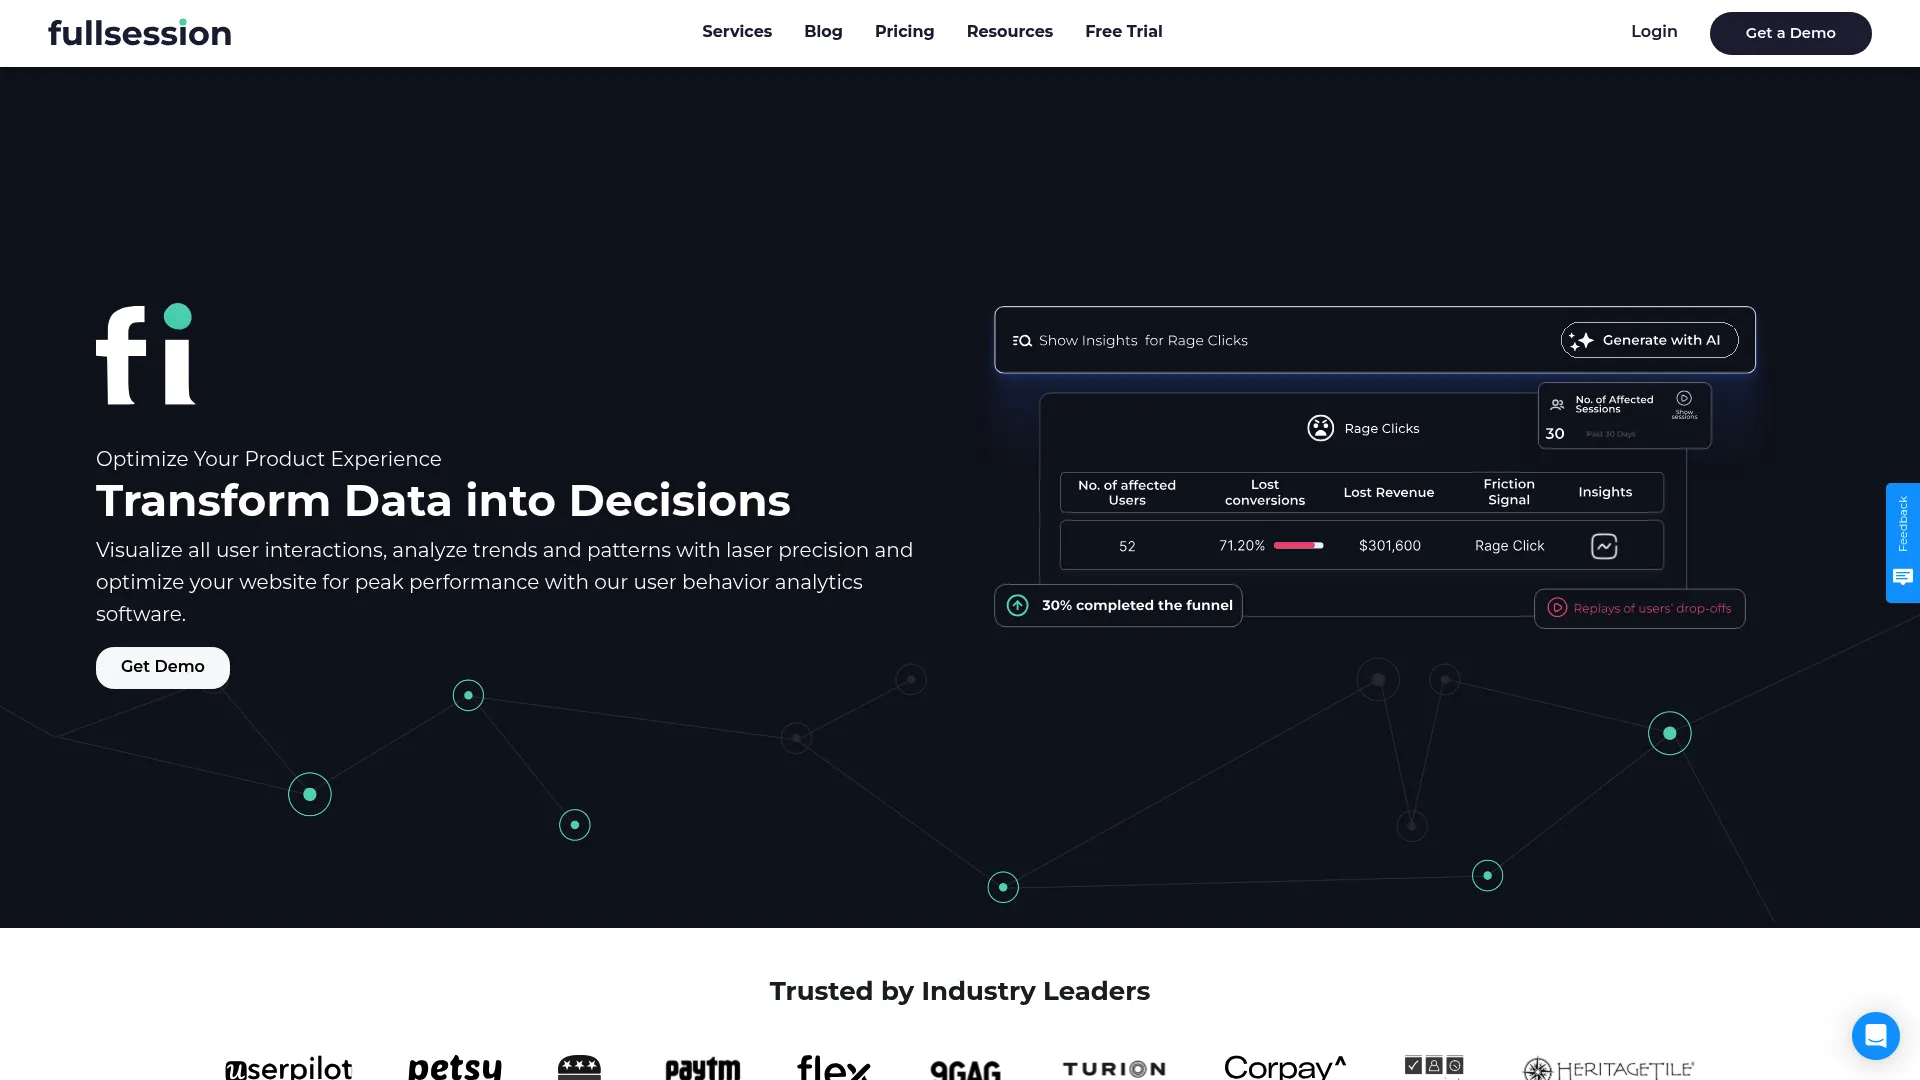
FullSession: The Speed Demon
Look, FullSession is basically the speed freak of analytics tools. While other platforms slow down your site (and drive your users crazy), FullSession figured out how to track everything without making your pages load like molasses.
And honestly? They nailed it. I’ve never seen another tool that can record everything happening on your site while having literally zero impact on page speed. It’s like having your cake and eating it too.
What Makes It Special
The session recordings are incredibly detailed. While other tools miss pop-ups, modals, and all the fancy JavaScript stuff modern websites use, FullSession catches everything. It’s like having a security camera that actually works instead of one that only records when nothing interesting is happening.
They also do something clever with error tracking. Instead of just showing you what users are doing, they show you what’s breaking while users are trying to do it. Super helpful when you’re trying to figure out if people are leaving because your site is confusing or because it’s actually broken.
The heatmaps are processed on their servers, not your website. That’s the secret sauce for the zero performance impact. Your users never feel the analytics running.
The Good Stuff
-
Your site stays fast no matter how much data you’re collecting
-
Catches technical problems that might be killing conversions
-
Timeline scrubbing in session replays (no more watching 10-minute sessions in real time)
-
Actually complies with privacy laws without making you jump through hoops
-
Customer support that knows what they’re talking about
The Not-So-Good Stuff
-
Web only—if you have a mobile app, you’ll need something else
-
Missing some of the fancy AI features that bigger platforms have
-
No built-in A/B testing (though honestly, most built-in testing sucks anyway)
Real Talk Rating
-
Data Collection: 5/5 – Gets everything on web
-
Plays Well With Others: 4/5 – Good integrations, but mobile app gap
-
Mobile Apps: 3/5 – Web-focused
-
Actual Cost: 4/5 – Straightforward pricing
-
Privacy Stuff: 5/5 – They get it
-
Site Speed Impact: 5/5 – None. Seriously.
-
Useful Insights: 5/5 – Great for finding real problems
Bottom Line: $39/month, free trial. Perfect if you want comprehensive web analytics without the performance penalty.
Check them out at fullsession.io.
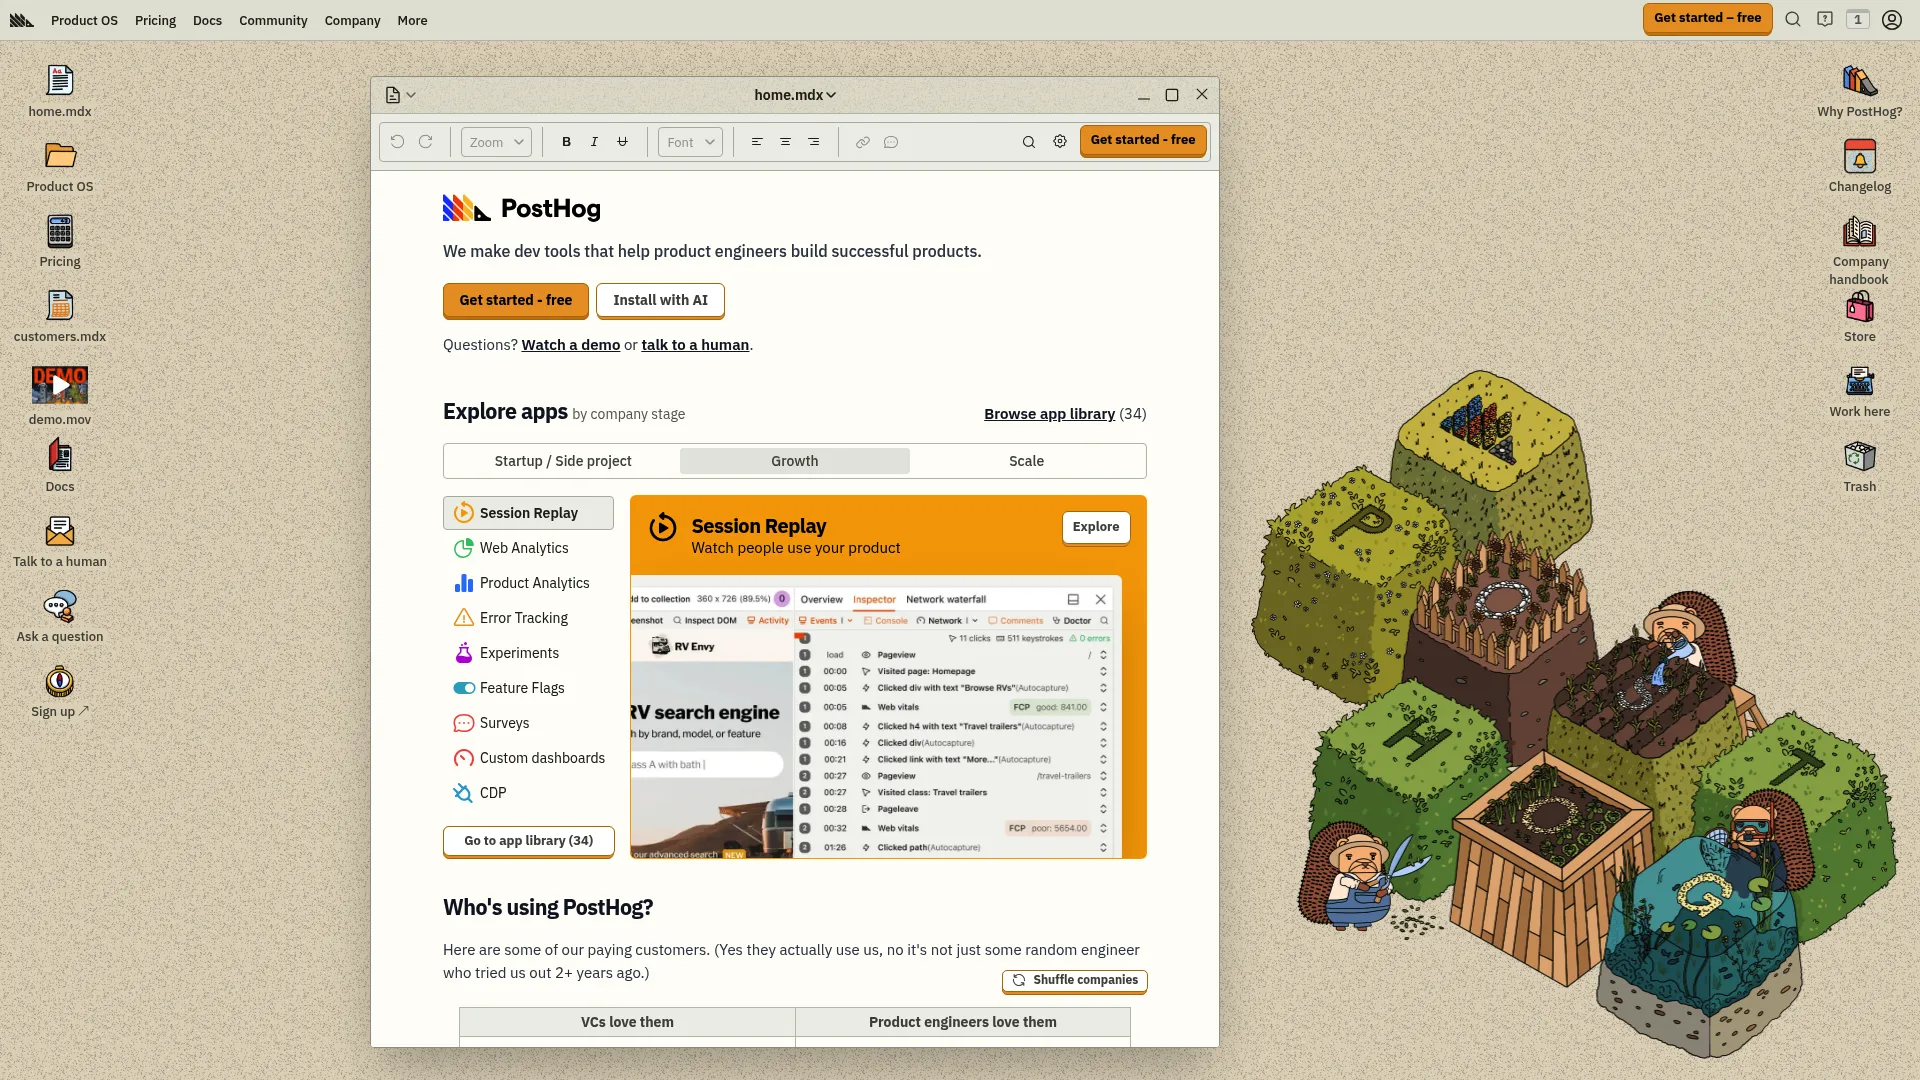
PostHog: The Transparent One
PostHog is different. Instead of making you guess what’s happening under the hood, they show you everything. It’s like having the recipe for Coca-Cola instead of just drinking it and wondering what’s in there.
The free tier is genuinely generous (5,000 sessions!), and if you’re technical enough, you can even host it yourself. No vendor lock-in, no mysterious algorithms, no “trust us, it works.”
What Makes It Special
This thing does everything. Session replays, product analytics, A/B testing, feature flags—it’s like they took every analytics tool you might need and smooshed them together. The SQL query feature is particularly nice if you know what you’re doing.
The mobile support is actually good, covering iOS, Android, React Native, and Flutter. Most tools claim mobile support but really just mean “mobile web.” PostHog means actual apps.
The Good Stuff
-
Open source means no black box mysteries
-
Replaces multiple tools (saves money and headaches)
-
5,000 free sessions per month (way more than most)
-
Self-hosting option for maximum control
-
Mobile apps actually work properly
-
Can write custom SQL queries for complex analysis
The Not-So-Good Stuff
-
Can feel overwhelming if you just want simple heatmaps
-
Updates constantly (good long-term, annoying short-term)
-
Interface gets cluttered with all the features
-
Learning curve is steeper than simpler tools
Real Talk Rating
-
Data Collection: 5/5 – Everything, everywhere
-
Plays Well With Others: 5/5 – Excellent integrations
-
Mobile Apps: 5/5 – Actually works
-
Actual Cost: 5/5 – Great free tier, transparent scaling
-
Privacy Stuff: 4/5 – Good, plus self-hosting option
-
Site Speed Impact: 4/5 – Generally good
-
Useful Insights: 5/5 – Advanced analysis capabilities
Bottom Line: Free up to 5K sessions, then scales up. Perfect if you want one tool to rule them all.
Find it at posthog.com.
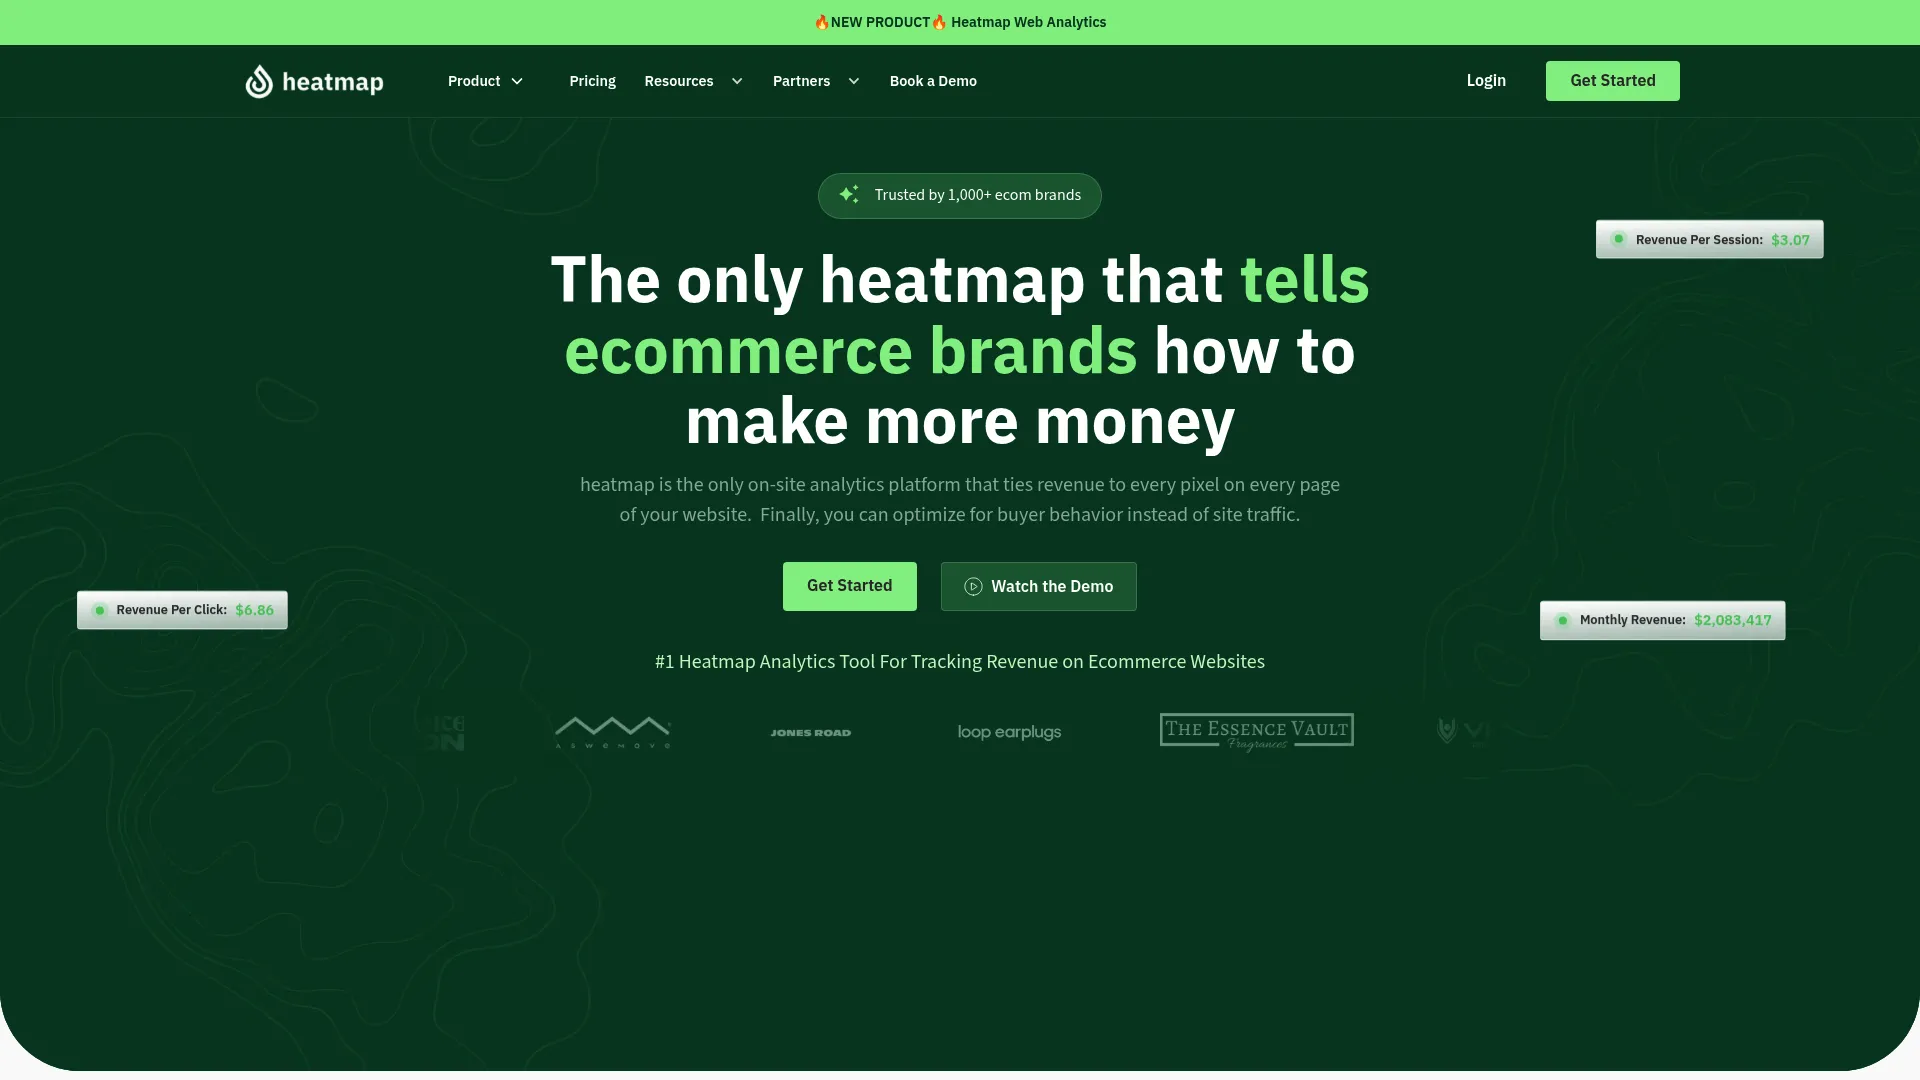
Heatmap.com: Shows You the Money
Here’s a tool that gets straight to the point: which parts of your website make money and which parts lose it. Instead of just showing you where people click, they show you which clicks actually lead to sales.
If you’re running an e-commerce site, this is probably the most useful perspective you can get. Pretty heatmaps are nice, but revenue-connected heatmaps are business-changing.
What Makes It Special
Every click, scroll, and interaction gets tied back to actual purchase data. You can see exactly which page elements contribute to your bottom line and which ones are just pretty decorations that confuse customers.
The AI recommendations aren’t generic “best practices” copied from blog posts. They’re specific suggestions based on your actual data and revenue patterns. Much more useful than “try making your button bigger.”
The Good Stuff
-
Direct connection between user actions and revenue
-
AI suggestions based on your actual data, not generic advice
-
Quick setup (10 minutes, they claim)
-
Customer support includes CRO guidance
-
Focus on business results, not vanity metrics
The Not-So-Good Stuff
-
Really only works for e-commerce businesses
-
Limited mobile app support
-
Newer platform, so smaller user base
-
Fewer integrations than established tools
Real Talk Rating
-
Data Collection: 5/5 – Revenue-focused data
-
Plays Well With Others: 4/5 – Good e-commerce integrations
-
Mobile Apps: 3/5 – Mobile web only
-
Actual Cost: 4/5 – Pricing aligns with value
-
Privacy Stuff: 4/5 – Standard compliance
-
Site Speed Impact: 4/5 – Minimal impact
-
Useful Insights: 5/5 – Directly actionable for revenue
Bottom Line: Custom pricing. Essential if you’re in e-commerce and want to connect analytics to actual money.
Visit heatmap.com.
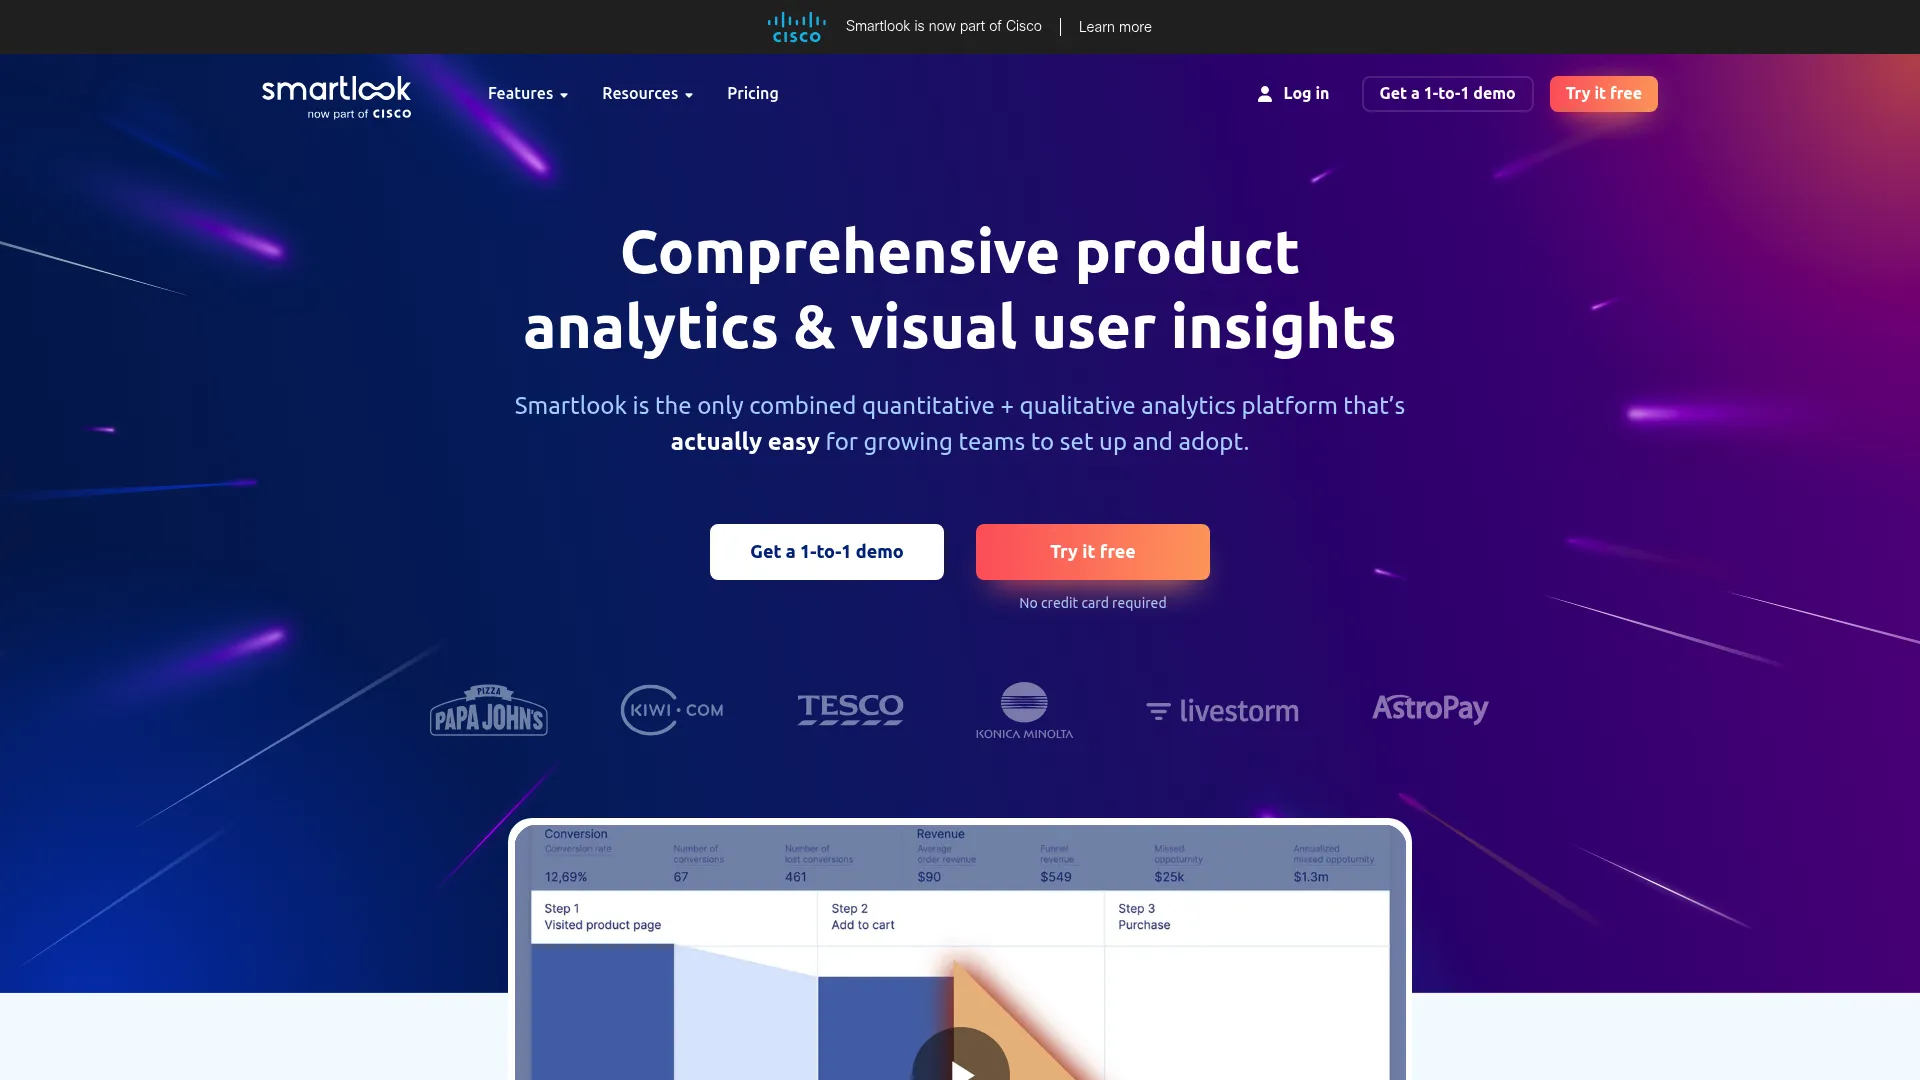
Smartlook: Mobile Done Right
Finally, someone who actually understands that mobile apps exist. Smartlook doesn’t just pay lip service to mobile—they actually built their platform to handle both web and mobile apps properly from day one.
The always-on recording means you get complete data instead of samples. No more wondering if you missed something important because your analytics tool was only recording 10% of sessions.
What Makes It Special
Cross-platform consistency is the big win here. Your web analytics and mobile app analytics look and work the same way. No more trying to piece together user journeys from two completely different tools.
The funnel analysis works across platforms too. You can see how users move between your website and mobile app during their decision process, which is crucial for modern businesses with multiple touchpoints.
The Good Stuff
-
Actually works on mobile apps, not just mobile web
-
Always-on recording (no sampling)
-
Consistent experience across web and mobile
-
Cross-platform funnel analysis
-
User-friendly interface
-
Good integration ecosystem
The Not-So-Good Stuff
-
Free plan only keeps data for 1 month
-
Occasional recording glitches with complex apps
-
Heatmap setup is more manual than some competitors
-
Can get expensive for high-volume sites
Real Talk Rating
-
Data Collection: 4/5 – Strong cross-platform collection
-
Plays Well With Others: 4/5 – Good integrations
-
Mobile Apps: 5/5 – This is their thing
-
Actual Cost: 4/5 – Reasonable with clear scaling
-
Privacy Stuff: 4/5 – Standard compliance features
-
Site Speed Impact: 4/5 – Generally minimal
-
Useful Insights: 4/5 – Good actionable data
Bottom Line: $55/month. Perfect if you need both web and mobile app analytics that actually work together.
Check out smartlook.com.
FullStory: The Enterprise Beast
FullStory is the analytics tool that big companies use when they have big problems and big budgets. The AI-powered insights and search capabilities are legitimately impressive—and legitimately expensive.
This isn’t for everyone. But if you’re dealing with millions of sessions and complex user journeys, FullStory can find patterns that simpler tools would miss entirely.
What Makes It Special
The search functionality is insane. You can literally search for “users who clicked the red button, then scrolled past the fold, then experienced a JavaScript error” and it’ll find those sessions. Across millions of recordings.
The AI session summaries automatically highlight the important moments, so you don’t have to watch hours of recordings to find the good stuff. When you’re analyzing thousands of sessions, this becomes a massive time-saver.
The Good Stuff
-
Handles massive data volumes without breaking
-
Advanced search across millions of sessions
-
Machine learning finds patterns humans would miss
-
Enterprise-grade integrations
-
Real-time monitoring for immediate issue response
The Not-So-Good Stuff
-
Expensive (like, really expensive)
-
Complex setup requires technical expertise
-
No transparent pricing (always a red flag)
-
Overkill for smaller businesses
-
Learning curve is steep
Real Talk Rating
-
Data Collection: 5/5 – Enterprise-level everything
-
Plays Well With Others: 4/5 – Great enterprise integrations, complex setup
-
Mobile Apps: 4/5 – Good mobile with enterprise features
-
Actual Cost: 3/5 – Expensive and opaque
-
Privacy Stuff: 4/5 – Enterprise compliance
-
Site Speed Impact: 4/5 – Generally good with optimization
-
Useful Insights: 5/5 – AI-powered insights are genuinely advanced
Bottom Line: Custom pricing starting around 5,000 sessions. Only makes sense for large organizations with complex needs.
Explore at fullstory.com.
Microsoft Clarity: Free (No, Really)
Microsoft decided to give away a genuinely useful analytics tool for free. Not freemium, not “free trial,” just free. Forever. With unlimited recordings. It’s either the best marketing move ever or Microsoft flexing their cash reserves.
Either way, we win.
What Makes It Special
The AI Copilot feature brings machine learning insights to any business, regardless of budget. That’s usually enterprise-only territory, but Microsoft is democratizing it.
Unlimited everything means you never hit usage caps or surprise overage charges. Your site could get a million visitors tomorrow and Clarity would handle it without charging you extra.
The Good Stuff
-
Completely free with no catches
-
Unlimited recordings and websites
-
AI-powered insights (Copilot)
-
Easy setup and integration
-
Connects with Google Analytics
-
Microsoft’s enterprise-grade privacy standards
The Not-So-Good Stuff
-
Only keeps data for 30 days (can’t analyze long-term trends)
-
Basic mobile support (mobile web only, no apps)
-
Fewer advanced features than paid alternatives
-
Limited customization options
-
No native A/B testing or advanced funnels
Real Talk Rating
-
Data Collection: 3/5 – Good basics, missing advanced stuff
-
Plays Well With Others: 4/5 – Easy integration, especially with Microsoft stuff
-
Mobile Apps: 2/5 – Mobile web only
-
Actual Cost: 5/5 – Free is free
-
Privacy Stuff: 4/5 – Microsoft’s enterprise standards
-
Site Speed Impact: 5/5 – Minimal impact
-
Useful Insights: 3/5 – Basic insights with AI enhancement
Bottom Line: Free forever. Start here if you’re budget-conscious or just getting into analytics.
Get it at clarity.microsoft.com.
Crazy Egg: The Visual Testing Pro
Crazy Egg basically invented visual website analytics, and they’re still pretty good at it. Six different types of heatmaps plus built-in A/B testing means you can spot problems AND test solutions in the same tool.
The visual approach makes it easy to spot issues and communicate findings to stakeholders who glaze over when you show them spreadsheets.
What Makes It Special
Six heatmap types give you different perspectives on the same data. Click maps, scroll maps, move maps—each one reveals something different about how users interact with your site.
The built-in A/B testing eliminates the need for separate optimization tools. See a problem in the heatmap? Test a solution right there.
The Good Stuff
-
Multiple heatmap types reveal different insights
-
Integrated A/B testing streamlines optimization
-
Visual data is easy to understand and share
-
Good traffic segmentation (15 different ways)
-
Connects behavior to business goals
-
Transparent pricing
The Not-So-Good Stuff
-
No free plan (just free trial)
-
Limited mobile app support
-
Traffic sampling on cheaper plans
-
Session recordings cost extra and aren’t cheap
-
Higher overall cost than some alternatives
Real Talk Rating
-
Data Collection: 4/5 – Good visual analytics with multiple heatmap types
-
Plays Well With Others: 4/5 – Solid integrations
-
Mobile Apps: 2/5 – Mobile web only
-
Actual Cost: 3/5 – Transparent but pricey
-
Privacy Stuff: 4/5 – Standard compliance
-
Site Speed Impact: 4/5 – Minimal impact
-
Useful Insights: 4/5 – Visual insights with testing capabilities
Bottom Line: $99/month and up. Good for visual people who want to test their ideas.
Try it at crazyegg.com.
Sprig: AI That Actually Helps
Sprig is what happens when someone builds analytics around AI from the ground up instead of bolting it on as an afterthought. The platform automatically analyzes user behavior and feedback to surface insights you probably wouldn’t find manually.
Instead of drowning you in data, it tells you what the data means and what you should do about it.
What Makes It Special
The AI survey analysis is genuinely useful. Instead of reading through hundreds of open-ended responses, the system identifies themes and sentiment automatically. Saves hours of work and catches patterns you might miss.
Real-time feedback collection happens at the moment users are struggling, not days later when they’ve forgotten what went wrong. Much more accurate insights.
The Good Stuff
-
AI actually provides useful insights (not just buzzwords)
-
Strong mobile app support with mobile-specific insights
-
Real-time feedback captures problems as they happen
-
Easy setup without technical complexity
-
Combines quantitative data with qualitative feedback
-
Good documentation and support
The Not-So-Good Stuff
-
Pricing isn’t transparent (always annoying)
-
Limited advanced survey features compared to dedicated research tools
-
Needs engineering support for complex implementations
-
Newer platform with shorter track record
-
Can be overkill for simple use cases
Real Talk Rating
-
Data Collection: 4/5 – Good AI-enhanced collection
-
Plays Well With Others: 4/5 – Reasonable integrations with some technical needs
-
Mobile Apps: 4/5 – Strong mobile capabilities
-
Actual Cost: 3/5 – Opaque pricing structure
-
Privacy Stuff: 4/5 – Standard compliance features
-
Site Speed Impact: 4/5 – Generally efficient
-
Useful Insights: 5/5 – AI-powered insights are genuinely helpful
Bottom Line: $175/month starting price. Great if you want AI to do the heavy analytical lifting.
Find it at sprig.com.
Mouseflow: Finds Your Friction Points
Mouseflow’s friction scoring system is brilliant—it automatically identifies where users are struggling on your site using objective data instead of guesswork. No more wondering if that high bounce rate means people hate your content or if something’s actually broken.
The form analytics are particularly strong, which makes this a solid choice for lead generation businesses where form completion directly impacts revenue.
What Makes It Special
The friction scoring gives you an objective measure of user experience quality. Instead of subjectively interpreting session recordings, you get quantified data about where users struggle most.
Form analytics go deep into abandonment patterns, showing you exactly which fields cause problems and why completion rates vary between different user segments.
The Good Stuff
-
Objective friction measurement (no guesswork)
-
Excellent form analytics for lead generation
-
Easy migration path from other tools
-
Intuitive interface for non-technical users
-
Six different heatmap types
-
Good value for small businesses
The Not-So-Good Stuff
-
Limited mobile app support (web focus)
-
Session limits can be restrictive for high-traffic sites
-
Basic funnel analysis compared to specialized tools
-
Integration limitations with some platforms
-
Shorter data retention on lower plans
Real Talk Rating
-
Data Collection: 4/5 – Good web analytics with unique friction detection
-
Plays Well With Others: 4/5 – Decent integrations with some gaps
-
Mobile Apps: 2/5 – Mobile web only
-
Actual Cost: 3/5 – Reasonable but session limits bite
-
Privacy Stuff: 4/5 – Standard compliance
-
Site Speed Impact: 4/5 – Minimal impact
-
Useful Insights: 4/5 – Friction scoring is genuinely useful
Bottom Line: $31/month starting, 500 free sessions. Good for form-heavy sites that need friction insights.
Check it out at mouseflow.com.
Lucky Orange: Real-Time Everything
Lucky Orange combines analytics with live engagement tools, which is pretty clever. You can watch users struggle in real-time and actually help them instead of just collecting data about their struggles for later analysis.
The minimal performance impact is impressive—you get comprehensive analytics plus live chat without slowing down your site.
What Makes It Special
Real-time session monitoring lets you intervene when high-value visitors are about to leave. See someone abandon their cart? Jump in with live chat using full context about their journey.
The live chat integration knows exactly what visitors have been doing on your site before the conversation starts, making support much more effective.
The Good Stuff
-
Real-time visitor monitoring and intervention
-
Live chat with full behavioral context
-
Minimal site performance impact
-
Affordable pricing for small businesses
-
Easy setup for non-technical users
-
Dynamic heatmaps that update continuously
The Not-So-Good Stuff
-
Limited advanced analytics compared to specialized platforms
-
Short data retention on lower plans (30 days)
-
Basic mobile support (mobile web only)
-
Fewer customization options
-
Analytics depth is basic compared to dedicated tools
Real Talk Rating
-
Data Collection: 3/5 – Basic analytics with real-time focus
-
Plays Well With Others: 4/5 – Easy integration
-
Mobile Apps: 2/5 – Mobile web only
-
Actual Cost: 4/5 – Affordable with clear scaling
-
Privacy Stuff: 4/5 – Standard compliance
-
Site Speed Impact: 5/5 – Excellent performance
-
Useful Insights: 3/5 – Basic insights with strong engagement features
Bottom Line: $39/month starting, 100 free sessions. Perfect for businesses wanting analytics plus real-time engagement.
Try it at luckyorange.com.
The Also-Rans: Other Tools Worth a Look
A few other platforms deserve mentions, even though they didn’t crack the top 10:
Contentsquare does enterprise-level analytics with zone-based heatmaps and AI insights. Problem is, they won’t tell you what it costs until you talk to sales. Red flag.
Explore Contentsquare at their enterprise analytics platform.
UserTesting focuses on qualitative feedback through video sessions. Great for understanding WHY users do things, but lacks the quantitative behavioral data most businesses need.
Learn more about UserTesting at their user research platform.
Pendo combines analytics with user onboarding tools. Solid for SaaS companies, but missing traditional heatmaps that most businesses expect.
Discover Pendo at their product experience platform.
Matomo offers privacy-focused analytics with complete data ownership. Great for privacy-conscious organizations, but requires technical expertise and lacks advanced behavioral features.
Access Matomo at their privacy-focused platform.
Qualaroo specializes in targeted surveys and feedback collection. Excellent for gathering user insights, but you’ll need another tool for behavioral analytics.
Explore Qualaroo at their survey platform.
Your Questions Answered
Which tool is best for small businesses on a tight budget?
Microsoft Clarity, hands down. It’s completely free with no catches, includes unlimited recordings, and has AI-powered insights. If you need more advanced features, Mouseflow at $31/month offers good value with friction detection capabilities.
How hard is it to switch from Hotjar to these alternatives?
Depends on the tool. Mouseflow makes it easiest since they designed their interface to be familiar. Microsoft Clarity and Lucky Orange have simple setups that don’t require technical expertise. More comprehensive platforms like PostHog might need some technical help but offer migration support.
Do any of these actually work well for mobile apps?
Yes! PostHog and Smartlook both excel at mobile app analytics across iOS, Android, React Native, and Flutter. They’re not just claiming mobile support—they actually built their platforms with mobile in mind from day one.
What’s the real cost difference compared to Hotjar?
It varies wildly. Microsoft Clarity costs nothing. Mid-range options like FullSession ($39/month) and Mouseflow ($31/month) often cost less while offering better features. Enterprise platforms like FullStory can cost significantly more but provide capabilities that justify the premium for large organizations.
Which platform gives actionable insights without requiring a data science degree?
Heatmap.com leads here with AI-powered recommendations that connect directly to revenue impact. Sprig offers excellent AI-driven analysis that automatically surfaces important patterns. Microsoft Clarity’s AI Copilot provides insights in plain English that anyone can understand.
How to Actually Pick the Right One
Here’s the thing—choosing the right analytics tool isn’t about finding the one with the most features. It’s about finding the one that solves your specific problems without creating new ones.
Start with your budget and be honest about it. If you’re bootstrapping, Microsoft Clarity gives you professional-grade analytics for free. Don’t feel guilty about it.
Think about your team’s technical skills. Some tools require developer involvement for setup and maintenance. Others you can implement yourself in an afternoon. Be realistic about what your team can handle.
Consider your traffic patterns. High-traffic sites need tools that won’t slow them down (FullSession) or have generous usage limits (PostHog, Microsoft Clarity). Low-traffic sites can use almost anything.
Mobile matters more than you think. If significant traffic comes from mobile apps, you need PostHog or Smartlook. Mobile web is different from mobile apps, and most tools only handle one well.
Match the tool to your optimization goals. E-commerce businesses benefit most from revenue attribution (Heatmap.com). Lead generation sites need form analytics (Mouseflow). SaaS companies might want integrated user onboarding (Pendo).
Try before you buy. Most platforms offer free trials or free tiers. Use them. What looks good in a demo might be frustrating in daily use.
The right analytics tool becomes a growth accelerator when it fits your business, your team, and your budget. The wrong one becomes expensive shelfware that generates reports nobody acts on.
At The Marketing Agency, we’ve helped dozens of businesses navigate these decisions. The key is connecting behavioral insights to actual business outcomes rather than just collecting data for the sake of having data.
When implementing any of these hotjar alternatives, consider how they integrate with your broader analytics audit strategy to ensure comprehensive data collection and analysis across all touchpoints.
The right user behavior analytics platform becomes a growth accelerator when properly implemented and integrated with your broader marketing strategy. Understanding how to calculate marketing ROI becomes crucial when evaluating the business impact of switching between these analytics platforms. We specialize in connecting these behavioral insights to actual revenue impact through our proprietary attribution modeling and optimization systems.
Ready to stop guessing and start growing? For businesses looking to leverage advanced analytics for strategic growth, our team can help you select, implement, and optimize the perfect analytics solution for your specific needs—one that drives real results instead of just pretty dashboards.
