


Look, I’ll be honest with you – I used to think website analytics were just fancy dashboards that made me look smart in meetings. Then I actually started digging into heatmap tools and realized I had absolutely no clue what my users were really doing on our site. That moment when you watch your first session recording and see someone clicking frantically on something that’s not even a button? Yeah, that’s humbling.
About 3 out of 4 businesses are now using some form of heatmap or session recording software, and after testing most of these tools myself, I get why. The gap between what we think users do and what they actually do is… well, it’s huge.
Crazy Egg basically invented this whole space, but honestly, the competition has caught up and then some. Today’s crazy egg alternatives often blow the original out of the water with better features, pricing that won’t make your CFO cry, and capabilities that would’ve seemed like magic five years ago.
Table of Contents
-
The Quick and Dirty: What You Need to Know Right Now
-
Side-by-Side Comparison (The Good Stuff)
-
How I Actually Tested These Things
-
Hotjar – The People’s Choice
-
Microsoft Clarity – Wait, This is Actually Free?
-
Mouseflow – For When You Need to Go Deep
-
Lucky Orange – Real-Time Everything
-
Smartlook – Web + Mobile Done Right
-
FullStory – Enterprise Beast Mode
-
Plerdy – The Kitchen Sink Approach
-
VWO – Testing Meets Analytics
-
Amplitude – Product Nerd Paradise
-
PostHog – Open Source FTW
-
The Also-Rans Worth Mentioning
-
Your Burning Questions Answered
-
Real Talk: What Should You Actually Pick?
The Quick and Dirty: What You Need to Know Right Now
Here’s what I learned after spending way too much time testing these tools:
Hotjar is like that reliable friend – easy to use, does what it says, and the free version actually works. Microsoft Clarity is the “wait, what’s the catch?” option because it’s legitimately free forever (I kept waiting for the gotcha moment that never came).
Mouseflow is for when you want to slice and dice your data like a data scientist. Lucky Orange lets you creep on visitors in real-time (in a totally professional way, of course). Smartlook figured out how to make web and mobile analytics not suck.
FullStory is the Rolls Royce – amazing if you can afford it, overkill if you just need to get from A to B. Plerdy tries to be everything to everyone (with mixed results). VWO combines testing with analytics like peanut butter and chocolate.
Amplitude is what product managers dream about, and PostHog is for teams who want to own their data completely.
The thing is, most of these crazy egg alternatives will give you more insights than you know what to do with. The trick is picking one you’ll actually use.
Side-by-Side Comparison (The Good Stuff)
|
Tool |
Best For |
Starting Price |
Free Plan |
Key Features |
Setup Difficulty |
|---|---|---|---|---|---|
|
Hotjar |
Most people, honestly |
$32/month |
Yes (35 sessions/day) |
Everything you need, nothing you don’t |
Easy peasy |
|
Microsoft Clarity |
Anyone with a pulse |
Free forever |
Unlimited everything |
AI insights that actually work |
Stupidly simple |
|
Mouseflow |
Data nerds |
$31/month |
Yes (500 sessions) |
30+ ways to filter sessions |
Bit of a learning curve |
|
Lucky Orange |
Real-time stalkers (kidding) |
$32/month |
7-day trial |
Watch visitors live + chat |
Pretty straightforward |
|
Smartlook |
Web + mobile teams |
$55/month |
Yes (3,000 sessions) |
Cross-platform that works |
Set it and forget it |
|
FullStory |
Enterprise with deep pockets |
Call for pricing (uh oh) |
14-day trial |
Everything, everywhere, all at once |
You’ll need help |
|
Plerdy |
People who hate multiple tools |
$32/month |
14-day trial |
Analytics + SEO + kitchen sink |
Manageable but cluttered |
|
VWO |
Serious A/B testers |
$176/month (ouch) |
Basic free plan |
Testing + analytics combo |
Buckle up |
|
Amplitude |
Product teams |
$49/month |
Yes (10M events) |
User journey wizardry |
Steep but worth it |
|
PostHog |
Dev teams who want control |
Pay as you go |
Yes (1M events) |
Self-hosted option |
Technical but flexible |
How I Actually Tested These Things
Look, I could give you some fancy methodology, but here’s what really happened: I installed these tools on real client sites, my own projects, and even convinced a few friends to let me experiment on their businesses.
I looked at seven things that actually matter when you’re trying to get insights without losing your mind:
Does it have the features you need? Not want – need. Half these tools have features you’ll never touch.
Will it bankrupt you as you grow? Some tools start cheap then hit you with surprise costs when your traffic picks up.
Can normal humans figure it out? If your marketing team needs a PhD to use it, it’s not worth it.
Is the data actually accurate? You’d be surprised how many tools give you pretty charts with garbage data.
Does it play nice with your other tools? Integration hell is real, folks.
Will it slow down your site? Nothing kills conversions like a slow website.
What happens when things break? Because they will break, and you’ll need help.
When evaluating hotjar alternatives and other behavioral analytics tools, these factors determine which ones actually deliver value versus just pretty dashboards.
Hotjar – The People’s Choice
Hotjar is basically the Toyota Camry of analytics tools – reliable, does everything most people need, and you won’t hate yourself for choosing it. After using it on probably 50+ sites, I can see why it’s become the default choice for so many teams.
The thing that gets me about Hotjar is how they nailed the user experience. Most analytics tools feel like they were designed by engineers for engineers. Hotjar feels like it was designed by someone who actually has to explain website performance to their boss.
What You Get
The heatmaps show you exactly where people click, tap, and scroll. Sounds basic, but watching a heatmap reveal that everyone’s trying to click on your non-clickable headline is one of those “aha” moments that makes you feel smart and stupid at the same time.
Session recordings are where the magic happens. It’s like having a tiny person sitting behind each visitor, taking notes on everything they do. You’ll watch someone struggle with your checkout process and think “Oh no, we’re idiots” – which is exactly the kind of revelation you need.
The feedback tools let you ask users what they’re thinking, which is revolutionary because we’re usually just guessing. And the funnel tracking shows you exactly where people bail out of your conversion process.
The Good Stuff
That free plan isn’t just a teaser – it’s actually useful. 35 sessions per day might not sound like much, but for a small business just getting started, it’s plenty to spot obvious problems.
The interface makes sense immediately. I’ve literally had clients start finding insights within their first hour of using it. Try doing that with Google Analytics.
The mobile app support is solid, and the integrations work without making you want to throw your laptop out the window.
The Not-So-Good Stuff
High-traffic sites might notice some slowdown. It’s not terrible, but it’s there. And if your site gets busy, those session limits on the paid plans can get expensive fast.
Some of the advanced features feel a bit shallow compared to specialized tools. It’s the jack-of-all-trades problem – good at everything, great at nothing.
My Honest Take
-
Features: 5/5 – Has everything most teams need
-
Price: 4/5 – Fair, but can add up with traffic
-
Ease of Use: 5/5 – Your grandma could probably figure this out
-
Data Quality: 4/5 – Reliable and accurate
-
Integrations: 4/5 – Plays well with popular tools
-
Site Speed Impact: 3/5 – Noticeable on busy sites
-
Support: 4/5 – Actually helpful humans
What People Are Saying
Marketing teams love how quickly they can get insights without needing a data science degree. The main complaint? Sites with heavy traffic find the performance impact annoying.
One client told me: “We finally understand why our checkout sucks.” That’s the Hotjar experience in a nutshell.
Source: G2 and Capterra user reviews
The Money Talk
Free plan covers basic needs. Paid plans start at $32/month and go up based on how much traffic you have. You can explore Hotjar’s pricing options on their website.
Microsoft Clarity – Wait, This is Actually Free?
I spent weeks waiting for the catch with Microsoft Clarity. Unlimited everything, forever, for free? From Microsoft? I kept checking my credit card for mysterious charges.
Turns out, there’s no catch. Microsoft is basically using this as a loss leader to get people into their ecosystem, and honestly, I’m not complaining.
What You Get
Unlimited session recordings and heatmaps. Let me repeat that – unlimited. No “first 100 sessions free” nonsense. You could have a million visitors and record every single session if you wanted to.
The AI insights are actually useful, which is rare. It automatically spots things like rage clicking (when someone clicks the same thing over and over because it’s not working) and dead clicks (clicking on things that aren’t clickable).
Privacy features are built-in, so you don’t have to worry about accidentally recording someone’s credit card info. And it integrates nicely with Google Analytics if you’re already using that.
The Good Stuff
Did I mention it’s free? Because it’s free. Forever. With no limits. I still can’t believe this.
The performance impact is minimal because Microsoft has good infrastructure. Your site won’t slow down like it might with some other tools.
The AI actually finds problems you’d miss. I’ve had it flag issues that took me weeks to spot manually on other tools.
The Not-So-Good Stuff
Customization is limited. You get what you get, and while it’s good, you can’t tweak much.
Support is basically “read the docs and hope for the best.” There’s no phone number to call when things go wrong.
No A/B testing or survey features. It’s purely behavioral analytics – nothing else.
My Honest Take
-
Features: 4/5 – Solid core features, missing some extras
-
Price: 5/5 – Free is hard to beat
-
Ease of Use: 5/5 – Install and forget
-
Data Quality: 4/5 – No sampling means complete data
-
Integrations: 4/5 – Google Analytics integration is solid
-
Site Speed Impact: 4/5 – Microsoft’s infrastructure helps
-
Support: 2/5 – You’re mostly on your own
What People Are Saying
Small businesses love the unlimited free access. Enterprise teams appreciate the privacy features. The main gripe is the limited customization and support options.
One startup founder told me: “We went from rationing our session recordings to watching everything. Game changer.”
Source: Product Hunt and Reddit user discussions
The Money Talk
It’s free. Seriously. Just go to Microsoft Clarity and sign up.
Mouseflow – For When You Need to Go Deep
Mouseflow is for people who look at basic analytics and think “But I need MORE data.” If you’re the type who wants to filter session recordings by 30 different criteria, this is your tool.
I’ll be honest – Mouseflow can be overwhelming. It’s like being handed the controls to a spaceship when you just wanted to drive to the store. But if you need that level of detail, nothing else comes close. For those seeking a mouseflow alternative , you’d be hard-pressed to find something with comparable filtering depth.
What You Get
Session recordings with more filtering options than you’ll ever use. Want to see only mobile users from California who rage-clicked on your pricing page? Mouseflow can do that.
The friction detection automatically spots problem areas. It’ll tell you exactly where users get frustrated, which is incredibly useful for optimization.
Form analytics go deep – you’ll know which specific fields cause people to abandon your forms. Heatmaps cover all the basics, and the real-time visitor monitoring shows current activity.
The Good Stuff
The filtering capabilities are insane. You can slice and dice user behavior data in ways that would make a data scientist weep with joy.
Friction detection saves hours of manual analysis. Instead of watching hundreds of recordings to find problems, the tool surfaces them automatically.
No data sampling means you get complete accuracy, even with high traffic volumes.
The Not-So-Good Stuff
The learning curve is steep. Your team will need training to use this effectively.
Pricing gets expensive fast as your traffic grows. Those session limits can be restrictive for busy sites.
The interface feels dated compared to newer tools like Hotjar. It works, but it’s not pretty.
My Honest Take
-
Features: 5/5 – Most comprehensive filtering available
-
Price: 3/5 – Gets expensive with scale
-
Ease of Use: 4/5 – Powerful but complex
-
Data Quality: 5/5 – Complete accuracy, no sampling
-
Integrations: 4/5 – Good ecosystem of connections
-
Site Speed Impact: 3/5 – Can slow down high-traffic sites
-
Support: 4/5 – Knowledgeable but sometimes slow
What People Are Saying
CRO specialists love the advanced filtering. Teams appreciate the friction detection for finding optimization opportunities. Main complaint is the cost scaling and learning curve.
A conversion consultant told me: “Mouseflow lets me find needle-in-haystack problems that other tools miss.”
Source: Trustpilot and industry expert reviews
The Money Talk
Free plan with basic features. Paid plans start at $31/month and go up based on recorded sessions. You can explore Mouseflow’s pricing on their website.
Lucky Orange – Real-Time Everything
Lucky Orange combines traditional analytics with real-time visitor tracking, which sounds creepy but is actually brilliant for customer service and sales.
The first time I saw someone struggling on a client’s checkout page and was able to pop up a chat window to help them complete their purchase, I felt like a wizard. It’s that immediate connection between data and action that makes Lucky Orange unique.
What You Get
Live visitor tracking shows you exactly who’s on your site right now and what they’re doing. Dynamic heatmaps handle interactive elements better than static alternatives.
Built-in live chat lets you help visitors in real-time based on their behavior. Session recordings capture complete user journeys. Form analytics reveal abandonment points, and conversion funnels show drop-off locations.
Visitor profiles maintain complete interaction history for returning users.
The Good Stuff
The real-time capabilities are unmatched. Being able to see and help struggling visitors live is incredibly powerful.
All features come with every plan – no “upgrade to get basic functionality” nonsense.
Customer support is genuinely excellent. They actually help you get set up properly instead of just pointing you to documentation.
Dynamic heatmaps work better with modern interactive websites than the static versions other tools use.
The Not-So-Good Stuff
Scalability might be limited for very high-traffic sites. The platform works great for most businesses but could struggle with enterprise-level volume.
Advanced segmentation options are more limited than specialized analytics tools.
The interface could use a visual refresh to match current design standards.
My Honest Take
-
Features: 4/5 – Solid core features with unique engagement tools
-
Price: 4/5 – Good value, all features included
-
Ease of Use: 5/5 – Simple setup with great onboarding
-
Data Quality: 4/5 – Reliable data collection
-
Integrations: 4/5 – Decent integration options
-
Site Speed Impact: 4/5 – Minimal performance hit
-
Support: 5/5 – Actually helpful humans who care
What People Are Saying
Small to medium businesses love the combination of analytics and engagement tools. Users consistently rave about the customer support quality. Some larger businesses find it limiting as their complexity needs grow.
A SaaS founder told me: “Lucky Orange helped us catch users before they churned. We literally saved deals by chatting with people who were struggling.”
Source: G2 and software review platforms
The Money Talk
7-day free trial, then $32/month with all features included. You can start your Lucky Orange trial today.
Smartlook – Web + Mobile Done Right
Most analytics tools either do web OR mobile well. Smartlook actually nailed both, which is harder than it sounds.
The automatic event tracking is what sold me. Instead of spending hours setting up custom events, Smartlook just… figures it out. It’s like having a really smart intern who knows exactly what you want to track.
What You Get
Unified analytics across web and mobile apps – no switching between different tools. Automatic event tracking captures user interactions without manual setup.
Unlimited session recordings give you complete user journey visibility. Funnel analysis works across platforms. Advanced user segmentation lets you analyze specific groups, and retroactive analytics mean you can analyze historical data for events you didn’t initially track.
The Good Stuff
Cross-platform analytics eliminate the need for separate web and mobile tools. The automatic tracking saves massive amounts of setup time.
Simple implementation gets you collecting useful data quickly. Good value considering you’re getting comprehensive analytics for multiple platforms.
Strong funnel and conversion analysis help optimize user flows.
The Not-So-Good Stuff
Customization options aren’t as deep as specialized tools. Support can be slow to respond, especially for technical issues.
Mobile features are still catching up to the web analytics capabilities. Advanced filtering is more limited than tools like Mouseflow.
My Honest Take
-
Features: 5/5 – Excellent cross-platform coverage
-
Price: 4/5 – Good value for what you get
-
Ease of Use: 5/5 – Automatic tracking is brilliant
-
Data Quality: 4/5 – Reliable across platforms
-
Integrations: 4/5 – Good ecosystem
-
Site Speed Impact: 4/5 – Minimal performance impact
-
Support: 3/5 – Can be slow to respond
What People Are Saying
Product teams love the unified view across platforms. Users praise the automatic event tracking for reducing setup complexity. Main complaints are about slow support and limited customization for advanced use cases.
A mobile app developer said: “Finally, one tool that actually understands both web and mobile. No more juggling three different analytics platforms.”
Source: Product management forums and user reviews
The Money Talk
Free plan with basic features. Paid plans start at $55/month based on tracked sessions. Visit Smartlook for current pricing.
FullStory – Enterprise Beast Mode
FullStory is what happens when you take behavioral analytics and crank everything up to 11. It’s incredibly powerful, but it’s also like using a Formula 1 car to pick up groceries – probably overkill for most people.
The pixel-perfect session recordings are legitimately impressive. You can see every mouse movement, every click, even console errors. It’s almost too much information.
What You Get
Pixel-perfect session capture that records literally everything. AI-powered insights automatically detect user frustration and technical issues.
Advanced search lets you find specific user behaviors across millions of sessions. Developer debugging tools include console logs and error tracking. Cross-platform analytics cover web, mobile, and even workplace applications.
Enterprise security and compliance features meet the strictest organizational requirements.
The Good Stuff
Most comprehensive session capture technology available. The AI insights actually work – they’ll surface problems automatically that would take forever to find manually.
Excellent debugging capabilities help development teams identify technical issues quickly. Enterprise-grade security satisfies even paranoid IT departments.
Robust integrations connect with virtually any tool in your tech stack.
The Not-So-Good Stuff
Extremely expensive – this is definitely enterprise pricing. Complex setup requires technical expertise that most marketing teams don’t have.
The platform can be overkill if you just need basic behavioral insights. Poor pricing transparency makes budget planning difficult.
My Honest Take
-
Features: 5/5 – Most comprehensive platform available
-
Price: 2/5 – Very expensive for most businesses
-
Ease of Use: 3/5 – Complex but powerful
-
Data Quality: 5/5 – Pixel-perfect accuracy
-
Integrations: 5/5 – Extensive ecosystem
-
Site Speed Impact: 3/5 – Comprehensive tracking has performance cost
-
Support: 4/5 – Good for enterprise clients
What People Are Saying
Enterprise development teams love the debugging capabilities and comprehensive data capture. Users appreciate the AI insights for automatically surfacing issues. However, smaller businesses find the cost prohibitive and the platform overly complex.
An enterprise UX director told me: “FullStory shows us things we never knew we didn’t know. But it took months to learn how to use it effectively.”
Source: Enterprise software review platforms and developer communities
The Money Talk
14-day free trial, then contact sales for pricing. Expect enterprise-level costs. You can request a FullStory demo to discuss pricing options.
Plerdy – The Kitchen Sink Approach
Plerdy tries to be your analytics tool, SEO tool, CRO platform, and probably your coffee maker too. Sometimes this works great. Sometimes it feels like using a Swiss Army knife when you need a proper screwdriver.
I appreciate what they’re trying to do – tool consolidation is a real problem for marketing teams. But execution can be… inconsistent.
What You Get
Standard behavioral analytics plus SEO audits and SERP tracking. A/B testing and pop-up creation tools. AI UX Assistant provides optimization recommendations.
Single Page Application support handles modern web apps. The platform claims 99% data accuracy with no sampling at any traffic level.
The Good Stuff
Comprehensive toolkit reduces the need for multiple subscriptions. Good value when it replaces several individual tools.
Unique SPA support works better with modern web applications than many alternatives. AI-powered recommendations provide actionable optimization suggestions.
Competitive pricing structure offers decent value for the feature breadth.
The Not-So-Good Stuff
Platform can be buggy – I’ve experienced loading issues and performance problems. Complex pricing structure makes cost prediction difficult.
Free version only stores data for one month, which is pretty limiting. Less mature platform compared to established competitors, with some features feeling half-baked.
My Honest Take
-
Features: 4/5 – Good breadth but inconsistent depth
-
Price: 3/5 – Good value but confusing structure
-
Ease of Use: 4/5 – Reasonable setup process
-
Data Quality: 4/5 – Claims high accuracy but reliability concerns
-
Integrations: 3/5 – Limited compared to specialized tools
-
Site Speed Impact: 3/5 – Some performance issues reported
-
Support: 3/5 – Average support quality
What People Are Saying
Users like the all-in-one approach for consolidating tools. The SEO features get positive feedback from digital marketers. However, reliability concerns and platform bugs frustrate users, especially those with high-traffic sites.
A marketing manager said: “Great concept, but feels like it’s trying to do too much. I’d rather have tools that do fewer things really well.”
Source: Digital marketing forums and software review sites
The Money Talk
14-day free trial. Paid plans start at $32/month with various feature tiers. Check Plerdy’s pricing for current options.
VWO – Testing Meets Analytics
VWO is what you get when serious A/B testing meets behavioral analytics. If you’re running sophisticated optimization programs, this is probably your best bet. If you just want to see some heatmaps, it’s massive overkill.
The testing capabilities are genuinely impressive, but you’ll need someone who knows what they’re doing to get value from this platform. When comparing hotjar vs VWO, the key difference lies in VWO’s advanced testing capabilities versus Hotjar’s user-friendly behavioral insights.
What You Get
Advanced A/B and multivariate testing with statistical rigor. Heatmaps and session recordings complement testing data.
Funnel analysis and user journey mapping identify optimization opportunities. Personalization and targeting deliver customized experiences. Mobile optimization ensures cross-device consistency.
AI-powered insights guide optimization decisions.
The Good Stuff
Complete experimentation platform eliminates the need for multiple testing tools. Strong mobile testing capabilities ensure cross-device optimization.
Advanced targeting and personalization support sophisticated marketing strategies. Excellent for enterprise-level testing programs. Comprehensive analytics integration provides complete optimization insights.
The Not-So-Good Stuff
Very expensive pricing makes it inaccessible for smaller businesses. Steep learning curve requires significant training.
Interface can feel overwhelming initially due to feature complexity. Some advanced features require coding knowledge, limiting accessibility for non-technical users.
My Honest Take
-
Features: 5/5 – Comprehensive optimization and testing platform
-
Price: 2/5 – Very expensive for most businesses
-
Ease of Use: 3/5 – Powerful but complex
-
Data Quality: 5/5 – High-quality testing and analytics data
-
Integrations: 5/5 – Extensive integration ecosystem
-
Site Speed Impact: 3/5 – Testing scripts can impact performance
-
Support: 4/5 – Good support for enterprise clients
What People Are Saying
Conversion optimization professionals praise the comprehensive testing capabilities. Enterprise teams appreciate the advanced personalization features. However, smaller businesses often find it too expensive and complex for their needs.
A CRO consultant told me: “VWO is the gold standard for serious testing programs. But you need the budget and expertise to use it properly.”
Source: Conversion optimization communities and enterprise software reviews
The Money Talk
Free basic plan with limited features. Paid plans start at $176/month and scale significantly with traffic and features. You can explore VWO’s pricing on their website.
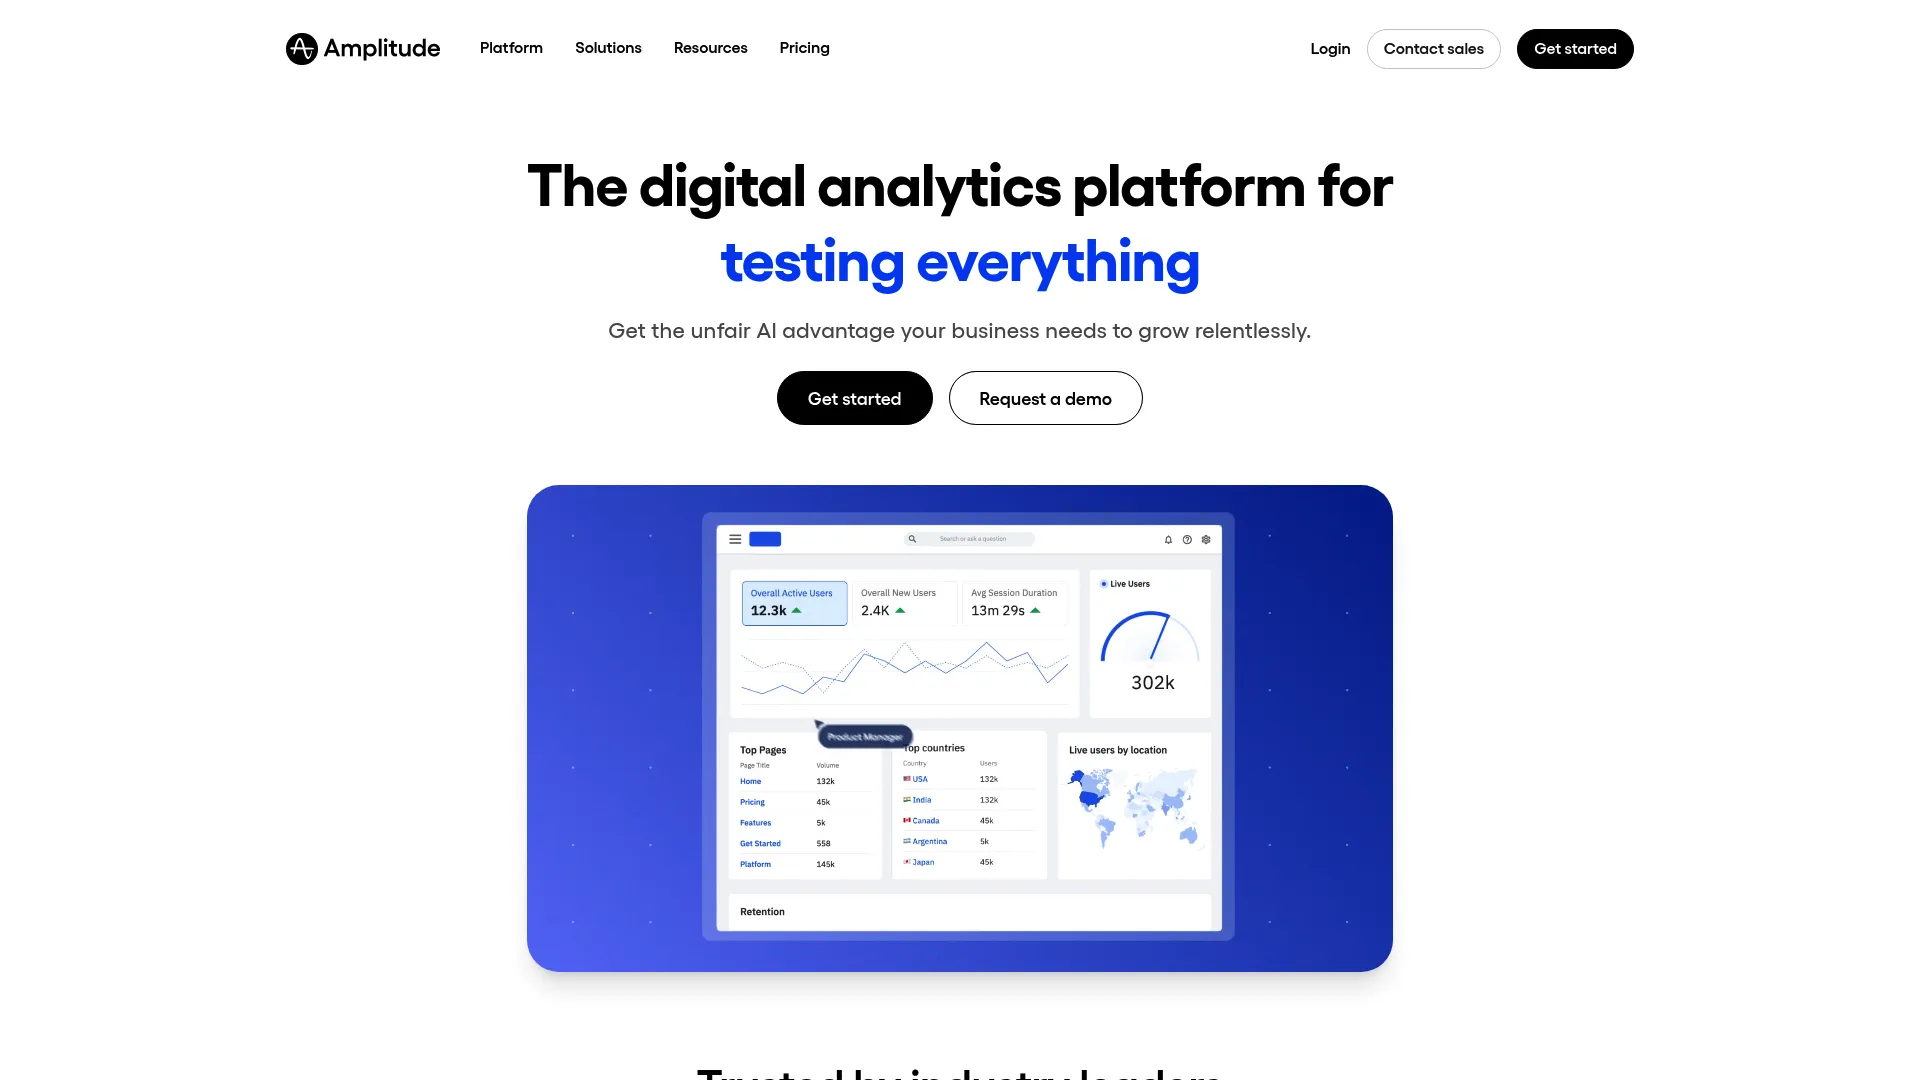
Amplitude – Product Nerd Paradise
Amplitude is built for product teams who live and breathe user behavior data. If you’re optimizing a SaaS product or mobile app, this is probably the most powerful tool available. If you’re just trying to improve your marketing website, it might be overkill.
The user journey visualization is genuinely mind-blowing. You can see exactly how users flow through your product and identify optimization opportunities that would be impossible to spot otherwise.
What You Get
Advanced user journey and path analysis reveals product usage patterns. Behavioral cohort creation enables sophisticated user segmentation.
Experiment tracking integrates with product development workflows. AI-powered insights and anomaly detection surface important behavioral changes. Advanced funnel analysis supports product optimization.
Real-time analytics keep teams informed of current performance.
The Good Stuff
Excellent for product-focused analytics and user behavior understanding. Advanced user journey visualization identifies optimization opportunities.
Strong cohort analysis supports retention and engagement strategies. Good collaboration features enable team-wide insights sharing. Comprehensive integration ecosystem connects with development and product tools.
The Not-So-Good Stuff
Limited traditional website heatmap functionality. Steep learning curve requires training for effective use.
Costs can escalate quickly as usage and data volume increase. More complex than necessary for basic website analytics needs.
My Honest Take
-
Features: 4/5 – Excellent for product analytics, limited for website optimization
-
Price: 3/5 – Can become expensive with scale
-
Ease of Use: 3/5 – Requires technical knowledge
-
Data Quality: 5/5 – High-quality product analytics data
-
Integrations: 5/5 – Strong ecosystem for product tools
-
Site Speed Impact: 4/5 – Minimal impact on application performance
-
Support: 4/5 – Good support for product teams
What People Are Saying
Product managers and analysts love the sophisticated user journey analysis capabilities. Teams appreciate the collaboration features and real-time insights. However, marketing teams often find it less suitable than traditional website analytics tools.
A product manager said: “Amplitude helped us understand our user journey in ways we never could before. But it took months to get comfortable with all the features.”
Source: Product management communities and analytics professional forums
The Money Talk
Free plan with basic features. Paid plans start at $49/month based on monthly tracked users. You can explore Amplitude’s pricing on their website.
PostHog – Open Source FTW
PostHog brings open-source flexibility to analytics, which is refreshing in a world of black-box SaaS tools. If you’re technically inclined and want complete control over your data, this is worth serious consideration.
The self-hosting option is genuinely appealing for organizations with strict data requirements. Plus, being able to see exactly how the tool works and even contribute improvements is pretty cool.
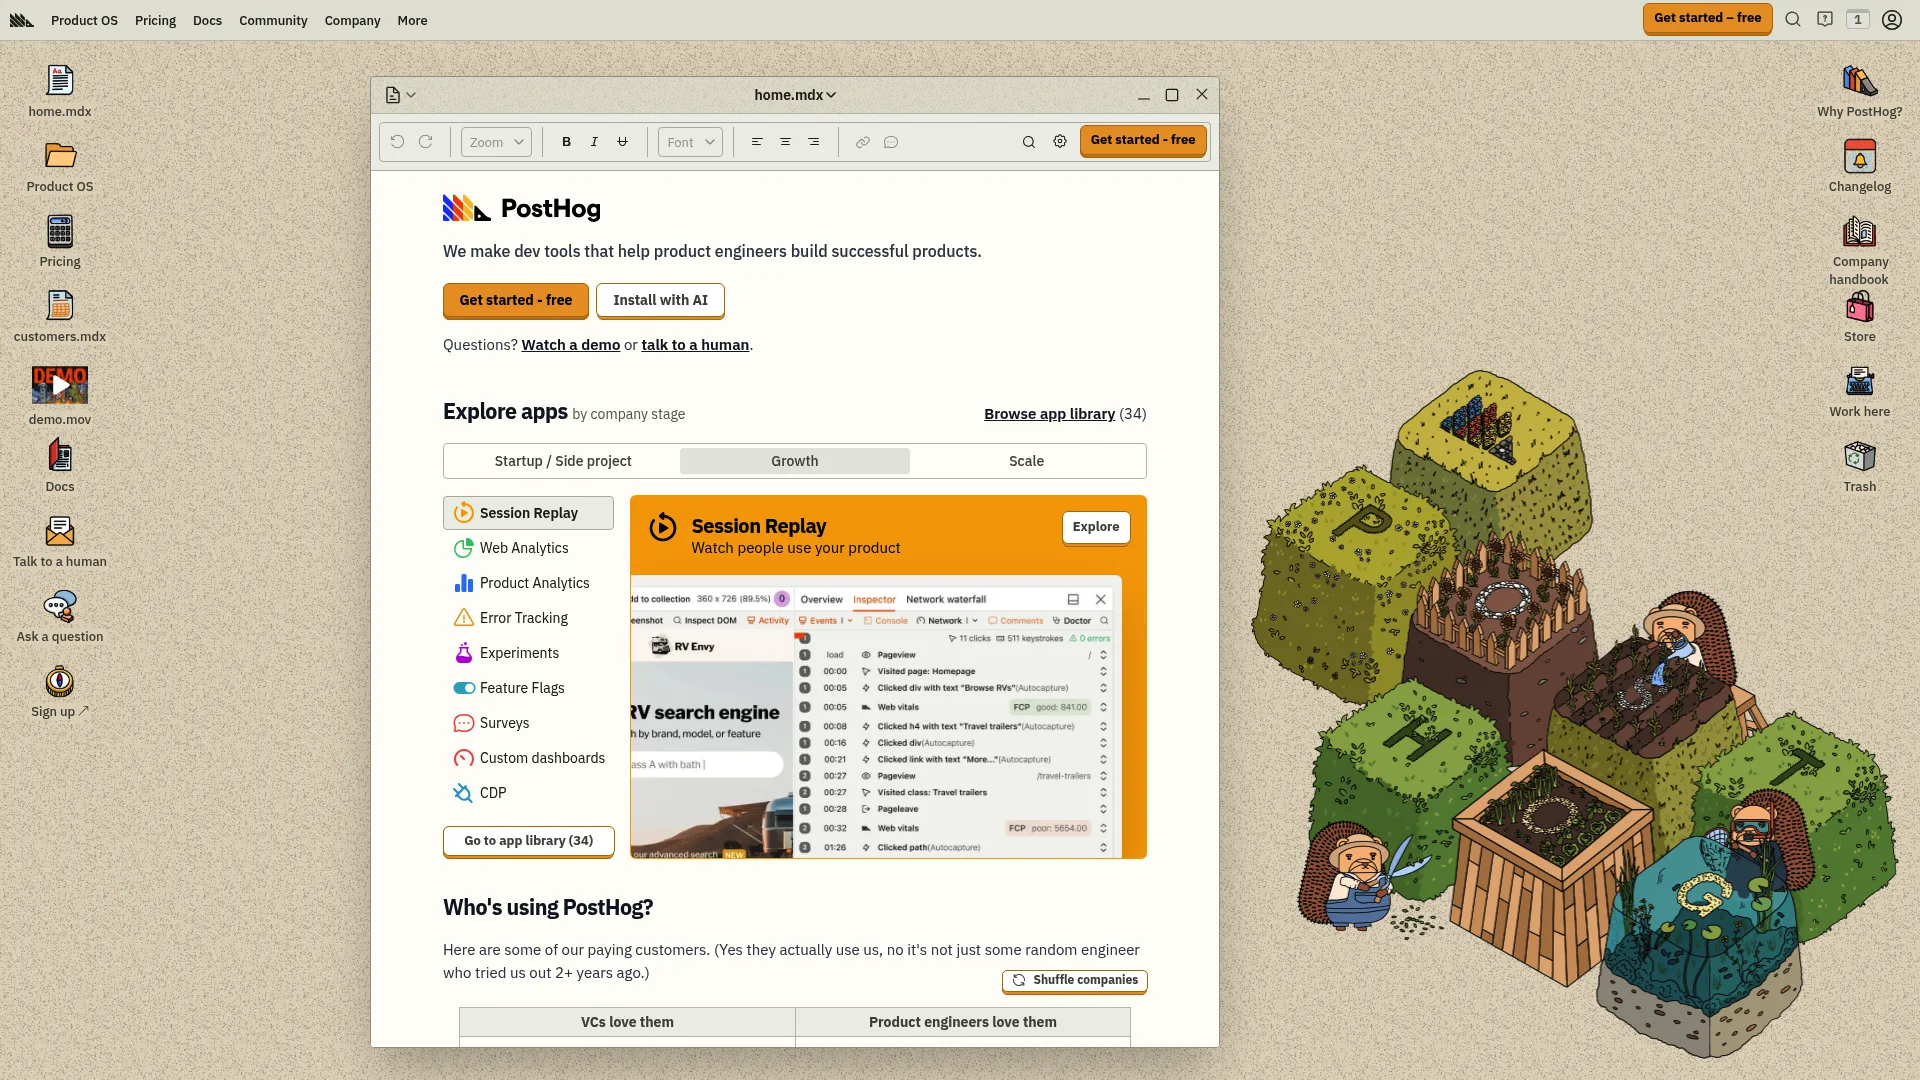
What You Get
Session replays with detailed event timelines. Product analytics include funnel and retention analysis.
Feature flags and A/B testing integrate with development workflows. User surveys gather qualitative insights alongside behavioral data. Heatmaps and interaction tracking cover traditional website analytics.
Self-hosted and cloud deployment options provide flexibility.
The Good Stuff
Open-source platform with self-hosting provides complete data control. Comprehensive product analytics rival expensive proprietary solutions.
Good free tier with generous limits supports smaller businesses. Strong developer-friendly features integrate well with technical workflows. Transparent pricing model makes cost planning straightforward.
The Not-So-Good Stuff
More complex setup process compared to traditional SaaS tools. Better suited for product teams than marketing-focused organizations.
Newer platform with evolving feature set may lack some mature capabilities. Requires more technical knowledge than user-friendly alternatives.
My Honest Take
-
Features: 5/5 – Comprehensive product analytics platform
-
Price: 4/5 – Transparent pricing with good free tier
-
Ease of Use: 4/5 – Requires technical knowledge but well-documented
-
Data Quality: 4/5 – Good quality with self-hosting control
-
Integrations: 4/5 – Strong developer-focused integrations
-
Site Speed Impact: 4/5 – Minimal performance impact
-
Support: 4/5 – Good community and documentation
What People Are Saying
Developer and product teams appreciate the open-source approach and comprehensive feature set. Users value the transparency and data control . However, marketing teams often find it more technical than necessary.
A startup CTO told me: “PostHog gives us enterprise-grade analytics without the enterprise price tag or vendor lock-in.”
Source: Developer communities and open-source software forums
The Money Talk
Generous free tier. Usage-based pricing starts at $0.000248 per event with transparent usage-based pricing. You can get started with PostHog immediately.
The Also-Rans Worth Mentioning
Mixpanel – Great for app-based businesses that need detailed event tracking. More complex than necessary for traditional website analytics. Check out Mixpanel if you’re tracking user actions in a product.
LogRocket – Advanced session replay with AI-powered issue detection. Higher price point but excellent for debugging technical problems. Explore LogRocket if you need technical optimization tools.
Kissmetrics – Focuses on individual user journey tracking and customer lifetime value. Good for businesses prioritizing customer-centric analytics. Learn about Kissmetrics for customer journey analysis.
Inspectlet – Simple, affordable session recording with basic heatmaps. Good entry-level option for small businesses needing basic insights. Try Inspectlet for straightforward analytics.
Your Burning Questions Answered
What’s the best free alternative to Crazy Egg?
Microsoft Clarity, hands down. It’s legitimately free forever with unlimited everything. I kept waiting for the catch, but there isn’t one. Unlike other “free” plans that limit you to death, Clarity actually gives you enterprise-grade analytics for nothing. For those exploring hotjar alternatives, Clarity’s unlimited nature makes it particularly compelling for budget-conscious businesses.
Which tool is easiest for non-technical teams?
Hotjar and Lucky Orange are both dead simple. Hotjar’s interface makes sense immediately, while Lucky Orange provides excellent onboarding support. Both can have you gathering insights within hours, not days.
What’s the most cost-effective for high-traffic sites?
Microsoft Clarity wins again since it’s free with no limits. For paid options, Hotjar and Smartlook offer reasonable scaling, though costs will climb with traffic.
Which has the most advanced features?
FullStory is the feature king with pixel-perfect capture and AI insights. But VWO offers the best combo of behavioral analytics plus advanced A/B testing if you need both.
Can these replace Google Analytics?
Nope, they complement it. These tools show you HOW users behave on your site, while Google Analytics shows you WHO they are and WHERE they came from. Most successful businesses use both.
Real Talk: What Should You Actually Pick?
Here’s what I learned after way too much time testing these tools: the best analytics platform isn’t about having the most features – it’s about finding something your team will actually use to make improvements.
Start with your budget and traffic. If you’re bootstrapping, Microsoft Clarity is incredible value. If you have budget for a paid tool, Hotjar hits the sweet spot for most teams.
Consider your technical chops. Non-technical teams should prioritize ease of use over advanced features. You can always upgrade later when you know what you’re doing.
Think beyond basic analytics. If you need A/B testing, VWO or Plerdy might make sense. If you’re optimizing a product, Amplitude or PostHog could be worth the learning curve.
Don’t underestimate setup complexity. Even “simple” tools need proper implementation to give you useful insights. Factor in the time to actually learn and use whatever you pick.
Focus on actionable insights. The prettiest dashboard in the world is useless if you’re not making changes based on what you learn.
Here’s the thing – most businesses collect tons of behavioral data but have no clue what to do with it. That’s where having someone who actually knows this stuff becomes crucial.
Look, I’ve been doing this for years, and I’ve seen teams waste months collecting data they never act on. The tools are just the beginning. The real value comes from knowing how to interpret what you’re seeing and turn those insights into actual improvements.
For businesses looking to maximize their analytics investment, understanding how to properly audit your GA4 setup ensures your behavioral insights integrate seamlessly with broader performance tracking.
Whether you’re trying to figure out why your checkout process sucks, optimize conversion funnels based on user behavior, or just understand why people bounce from your landing pages, the right strategy matters as much as the right tool.
At The Marketing Agency, we help bridge this gap by combining behavioral insights with comprehensive optimization strategies. Whether you’re trying to interpret heatmap data, optimize conversion funnels based on user behavior patterns, or integrate analytics insights with broader marketing initiatives, our team ensures your chosen platform drives real business results.
Understanding how to calculate marketing ROI becomes essential when justifying analytics tool investments and measuring the impact of behavioral optimizations on your bottom line.
We work with whatever analytics platform makes sense for your business, then help you actually use the data to grow. From spotting friction points that kill conversions to developing optimization strategies that improve your bottom line, it’s about turning insights into results.
When implementing behavioral analytics, consider how they fit into your broader advanced analytics strategy for strategic growth, ensuring data-driven decisions across all marketing channels.
And honestly? Most of these tools will give you more data than you know what to do with. The trick is picking one that fits your team and your budget, then actually using it to make your website better.
Ready to stop collecting data and start improving results? We can help you maximize your analytics investment while building a comprehensive digital marketing strategy that delivers sustainable results.
