


Last month, I watched our dev team spend three weeks just setting up event tracking in Mixpanel. Three weeks! Meanwhile, our product launch was sitting there waiting for basic user data we should have had on day one.
You know that sinking feeling when you realize you forgot to track a crucial event six months ago? That’s exactly what happened to us. We needed to understand user behavior retroactively, but our manual setup meant that data was gone forever.
What started as pure frustration with endless tagging requirements turned into discovering some genuinely impressive mixpanel alternatives that solve real problems. The manual setup requirements were killing our development velocity, and we needed solutions that could deliver insights without the engineering overhead.
Here’s what I learned from testing these platforms over the past six months.
Table of Contents
-
TL;DR: Quick Decision Guide
-
How I Actually Figured This Out
-
OpenPanel – Open-Source Simplicity
-
PostHog – All-in-One Analytics Powerhouse
-
Heap – Autocapture Innovation
-
Amplitude – Enterprise Behavioral Analytics
-
Hotjar – Visual User Insights
-
FullStory – Digital Experience Intelligence
-
Heatmap.com – Revenue-Focused Analytics
-
Google Analytics 4 – Free Comprehensive Solution
-
Matomo – Privacy-First Analytics
-
Microsoft Clarity – Free Behavioral Insights
-
Other Options Worth Mentioning
-
Questions Everyone Asks Me
-
Final Thoughts
TL;DR: Quick Decision Guide
Look, I’m not going to bore you with a massive comparison chart. Here’s what actually matters:
Just starting out? OpenPanel gives you everything you need without vendor lock-in, and it’s free to self-host.
Need everything in one place? PostHog replaces like five different tools, though you’ll spend a week figuring out the interface.
Hate manual setup? Heap tracks everything automatically, but your wallet won’t love the pricing.
Want to see what users actually do? Hotjar’s heatmaps and recordings are still unmatched for visual insights.
Working with zero budget? Microsoft Clarity is completely free and honestly pretty amazing.
Privacy is non-negotiable? Matomo keeps all your data under your control and doesn’t need cookie banners.
When I’m evaluating mixpanel alternatives, I focus on three things: how much setup headache you’ll have, whether your team can actually use it, and if it fits your budget without surprise costs later.
Quick Reality Check
|
Platform |
Setup Pain Level |
Learning Curve |
Best For |
Biggest Downside |
|---|---|---|---|---|
|
OpenPanel |
Super easy |
Gentle |
Startups wanting control |
Still pretty new |
|
PostHog |
Moderate |
Steep at first |
Teams wanting everything |
Can feel overwhelming |
|
Heap |
Zero setup pain |
Easy |
Retroactive analysis |
Expensive |
|
Amplitude |
Major headache |
Complex |
Enterprise teams |
Overkill for most |
|
Hotjar |
Plug and play |
None |
UX optimization |
Limited analytics |
|
FullStory |
Moderate |
Steep |
Enterprise UX |
Premium pricing |
|
Heatmap.com |
Easy |
Gentle |
eCommerce sites |
Pretty niche |
|
Google Analytics 4 |
Painful |
Frustrating |
Universal access |
Privacy concerns |
|
Matomo |
Depends on hosting |
Moderate |
Privacy-focused |
Self-hosting complexity |
|
Microsoft Clarity |
Dead simple |
None |
Budget-conscious |
UI could be better |
How I Actually Figured This Out
Here’s how I really evaluated these platforms, not some academic framework that sounds good in theory.
Setup headaches (this matters most): Can your team actually implement this without losing weeks of development time? Manual event tracking sounds fine until you’re three months in and realize you’re missing half the data you need.
Real-world usability: Will your marketing team actually use this, or will it become another expensive dashboard that only the analytics person touches?
Hidden costs and gotchas: That “starts at $99/month” pricing usually becomes “$500/month” real quick when you hit their usage limits.
Getting insights without a PhD: Some platforms make you feel like you need a data science degree just to answer “why did users drop off at checkout?”
Playing nice with your existing tools: If it doesn’t integrate with your current stack, you’re building data silos that’ll bite you later.
Privacy stuff that actually matters: European users, GDPR compliance, and not having to plaster cookie banners everywhere.
The platforms that made this list solve real problems without creating new ones. Trust me, I tested plenty that didn’t make the cut.
OpenPanel – Open-Source Simplicity
Why It’s Getting Attention
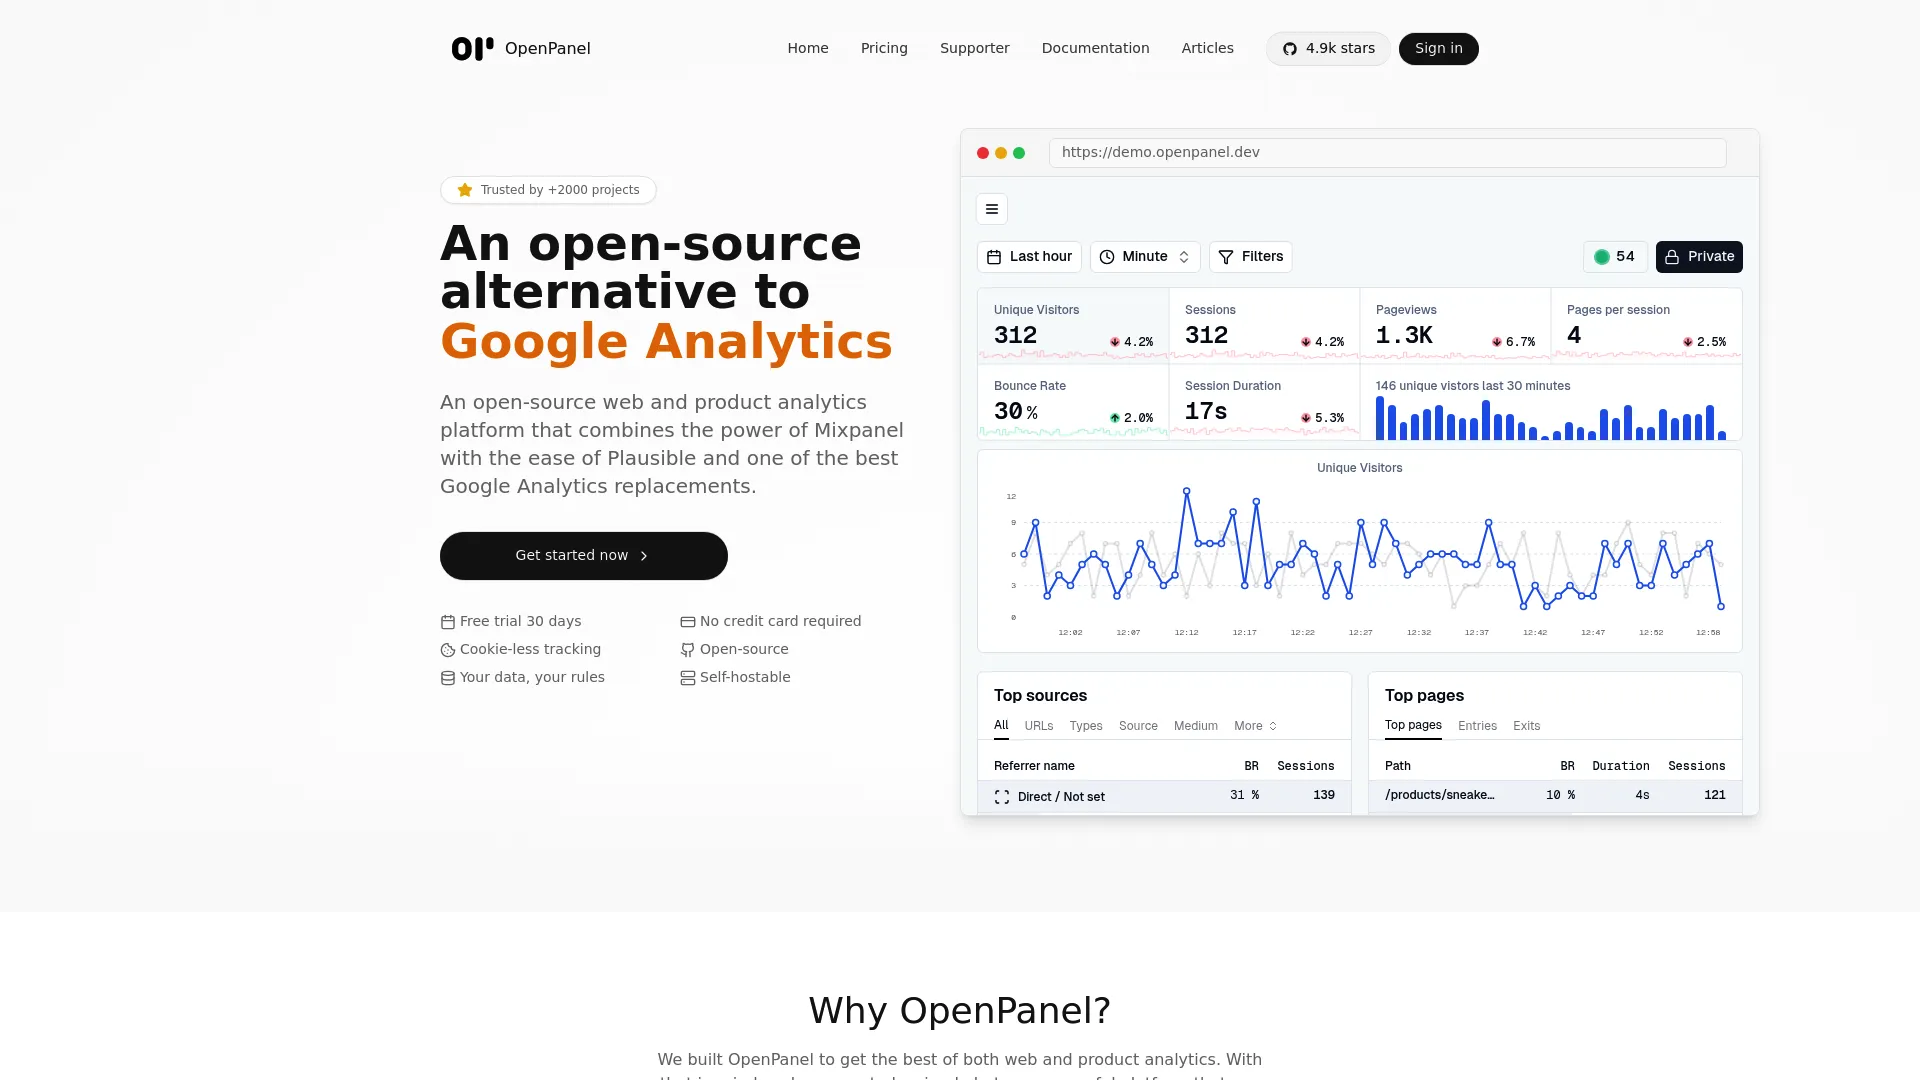
OpenPanel feels like what analytics should have been from the start – simple, fast, and completely under your control. No vendor lock-in, no cookie banners, no surprise billing.
I was honestly skeptical at first. Free and open-source analytics platforms usually suck compared to paid options. But OpenPanel actually delivers on the promise of “just works” without the complexity overhead.
The thing that sold me? You can literally see exactly how users move through your site in real-time, and it takes about five minutes to set up. No joke.
What You Actually Get
Here’s what OpenPanel does without making your head spin:
-
Tracks everything automatically without cookies or privacy headaches
-
Shows user journeys in real-time (this is actually pretty cool to watch)
-
Works on your own servers or their cloud hosting
-
Integrates with React, Vue, Next.js – basically whatever you’re already using
-
Gives you actual user profiles, not just anonymous session data
-
GDPR compliant by design, so no legal nightmares
The Good Stuff
The setup is ridiculously easy. I’m talking “add one script tag and you’re done” easy. The interface focuses on what you actually need to know instead of drowning you in metrics that don’t matter.
Since it’s open-source, you can customize anything that bugs you. And the privacy-first approach means European users won’t bounce because of cookie consent fatigue.
The best part? You own your data completely. No vendor lock-in means if you want to switch later, you just export everything and go.
The Not-So-Good
It’s still pretty new, so the community isn’t huge yet. Some advanced features that enterprise teams expect just aren’t there. The documentation is improving but isn’t as comprehensive as platforms that have been around for years.
If you need really complex funnel analysis or AI-powered insights, you’ll probably outgrow it eventually.
Bottom Line
-
Setup: 5/5 – Seriously, it’s that easy
-
Features: 4/5 – Everything you need, nothing you don’t
-
Visual insights: 3/5 – Basic but functional
-
Learning curve: 5/5 – Your team will get it immediately
-
Cost: 5/5 – Free to self-host
-
Privacy: 5/5 – Built for the GDPR world
What People Are Saying
Early adopters love how straightforward it is compared to the complexity of other platforms. Developers appreciate that they can actually understand and modify the tracking code.
Source: GitHub community discussions and early user feedback
Pricing Reality
Free if you host it yourself. Cloud hosting is available with transparent pricing – no “contact sales” nonsense.
Check out OpenPanel at their website.
PostHog – All-in-One Analytics Powerhouse
The Swiss Army Knife Approach
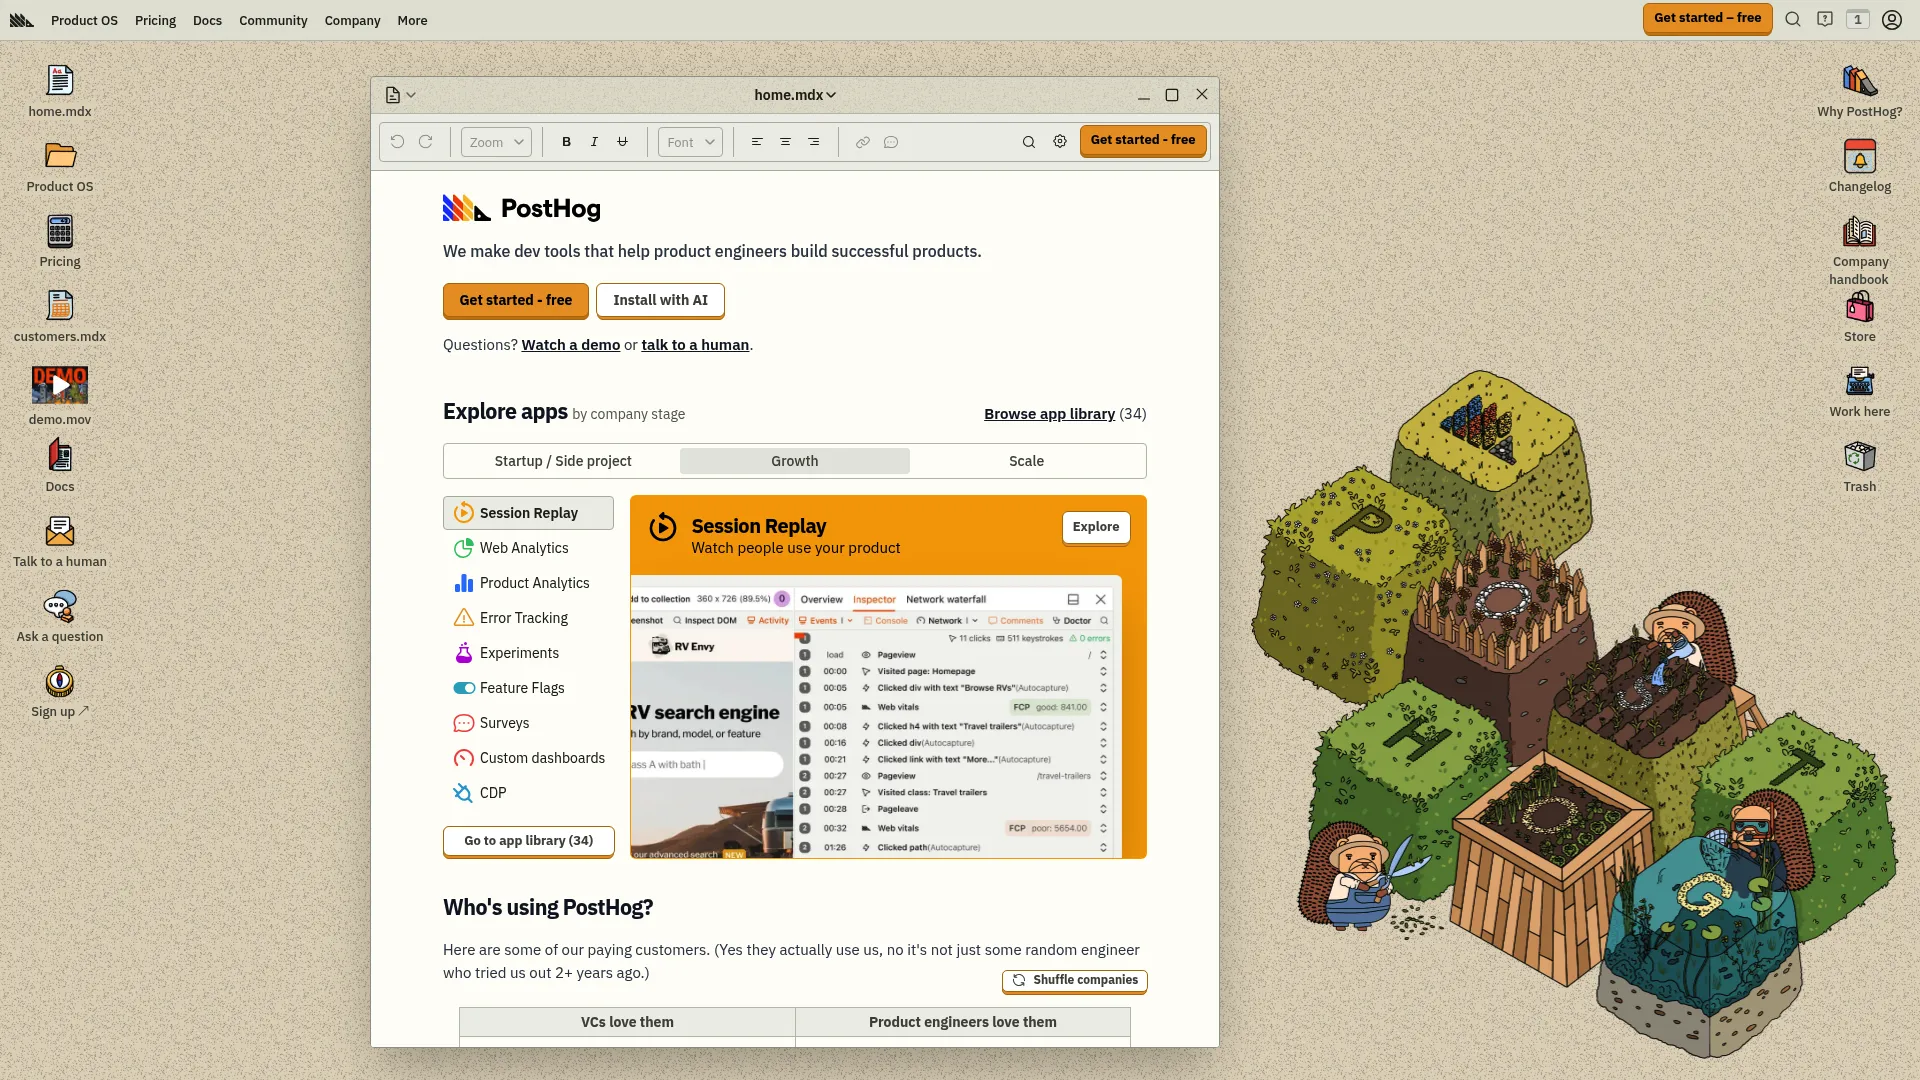
PostHog tries to replace your entire analytics stack with one platform. Product analytics, session recordings, A/B testing, feature flags, user surveys – it does everything.
Sounds great in theory, right? In practice, it’s both awesome and overwhelming. Like getting a Swiss Army knife when you just needed a bottle opener.
I’ll be honest – PostHog’s interface made my head spin for the first week. But once you get past the learning curve, having everything in one place is actually pretty nice.
Everything and the Kitchen Sink
Here’s what you get when PostHog decides to do everything:
-
Full product analytics with funnels, cohorts, and retention analysis
-
Session recordings that show exactly what users did (and where they got frustrated)
-
A/B testing with proper statistical significance calculations
-
Feature flags for rolling out changes safely
-
User surveys to ask people what they actually think
-
SQL access for when you want to dig deep into the data
Why It’s Actually Pretty Great
The autocapture means you can analyze historical data even for events you never thought to track. That “oh crap, we should have been measuring that six months ago” moment? PostHog’s got you covered.
Being open-source builds trust, and you can self-host if data control is important. The pricing is transparent – no surprise bills when you hit arbitrary usage limits.
The SQL access is clutch if you have someone technical who wants to do custom analysis without export/import headaches.
The Reality Check
It’s a lot. Like, a LOT. New team members get overwhelmed by all the options. The interface can feel cluttered when you just want to answer a simple question.
Some individual features aren’t as polished as dedicated tools. Their heatmaps are decent but not as good as Hotjar’s. The A/B testing works but isn’t as sophisticated as Optimizely.
Performance can get sluggish with really large datasets, though most businesses won’t hit those limits.
Bottom Line
-
Setup: 5/5 – Autocapture gets you started immediately
-
Features: 5/5 – Literally everything you could want
-
Visual insights: 5/5 – Sessions, heatmaps, surveys, the works
-
Learning curve: 3/5 – Lots to learn but worth it
-
Cost: 5/5 – Generous free tier, honest pricing
-
Privacy: 5/5 – Self-hosting options available
What Users Actually Say
Product teams love consolidating tools, but many mention the initial overwhelm. The open-source community is active and helpful when you get stuck.
Source: Product Hunt reviews and open-source community feedback
Real Pricing
Generous free tier that actually works for small teams. Paid features scale with usage, no minimum commitments or sales calls required.
Explore PostHog at their platform.
Heap – Autocapture Innovation
The “Track Everything” Philosophy
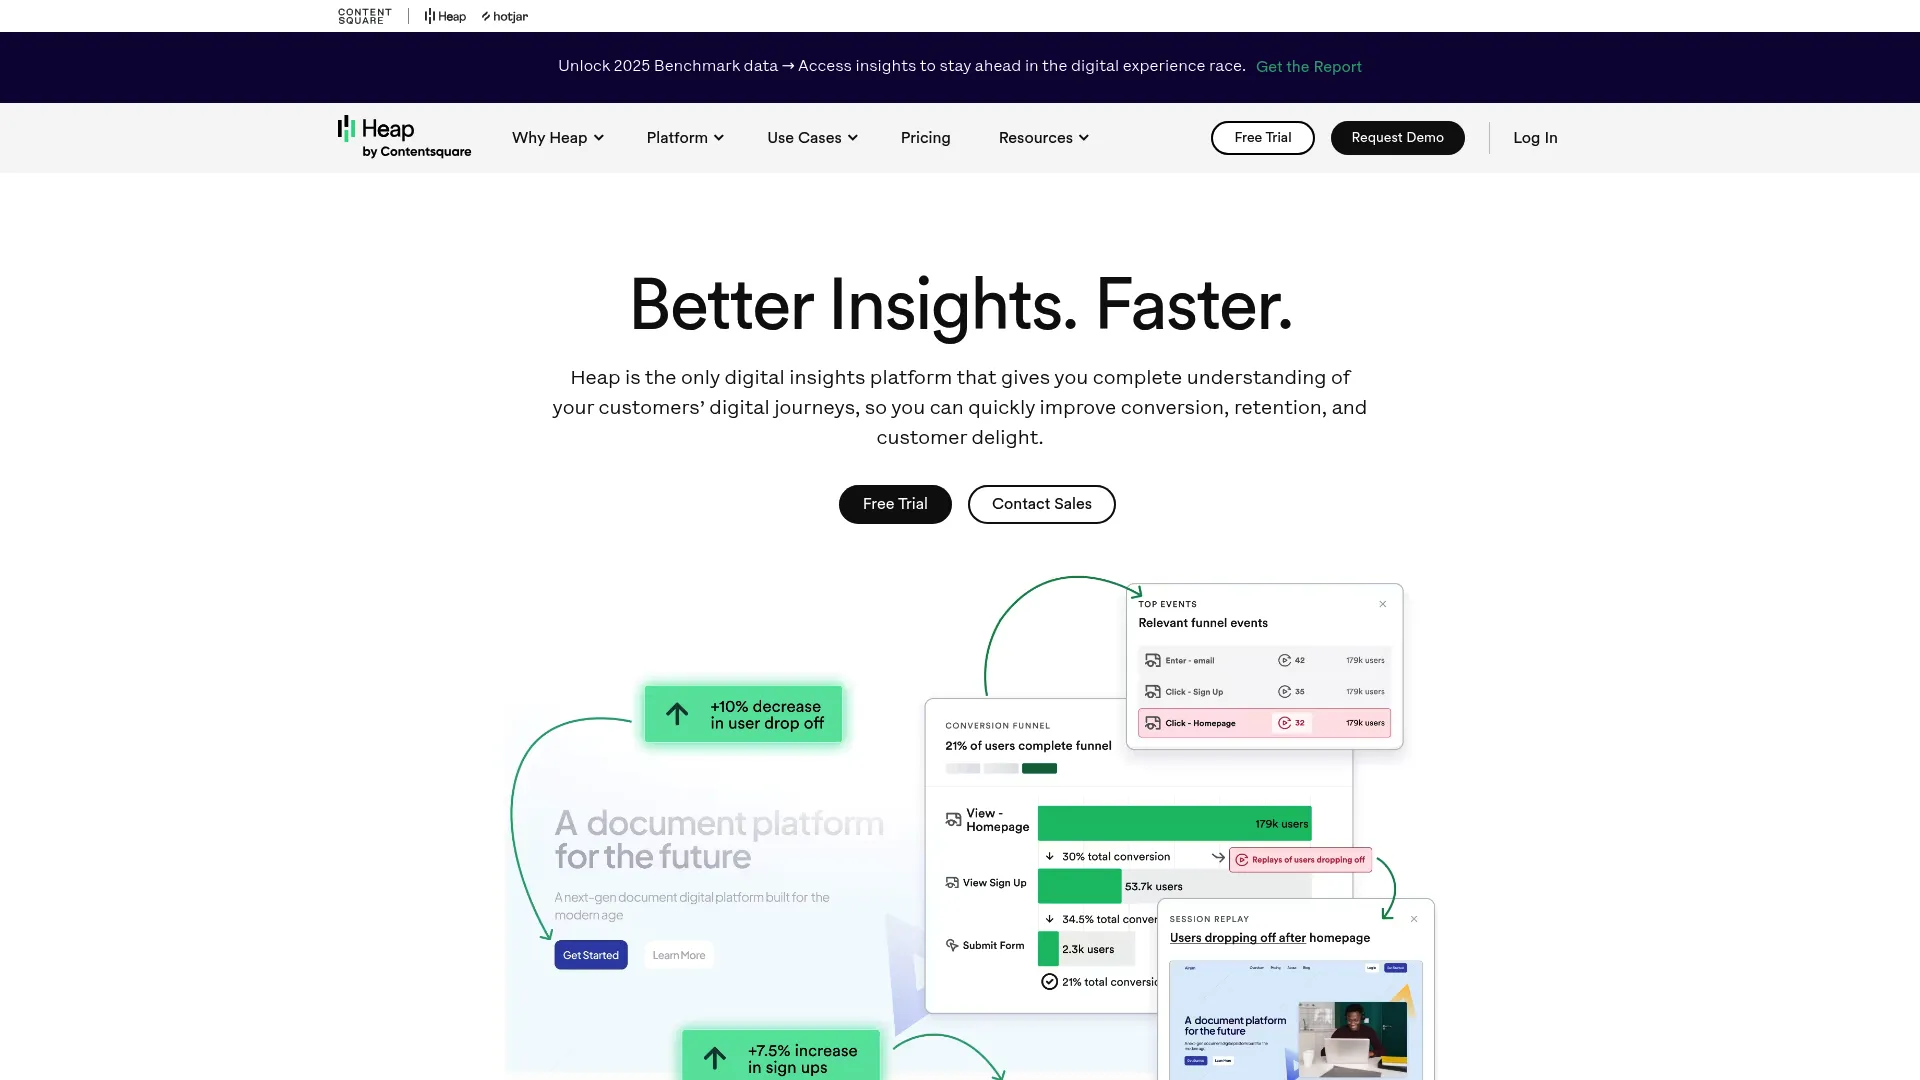
Heap pioneered the “capture everything automatically” approach that everyone else is now copying. Every click, scroll, form fill, page view – it all gets tracked without you having to think about it.
The magic happens when you realize you can retroactively analyze events from months ago that you never explicitly set up. It’s like having a time machine for your user data.
But here’s the thing – that magic comes with a price tag that’ll make your CFO ask questions.
Set It and Forget It
Heap’s approach is beautifully simple:
-
Automatically captures every user interaction without manual setup
-
Retroactive event creation means you can analyze historical data
-
Visual event creator so non-technical people can define events by clicking
-
Advanced segmentation that actually makes sense
-
Data governance features for enterprise compliance
-
Integrations with your existing marketing and sales tools
Why People Love It
Zero setup time means you get value immediately. No more “we should have been tracking that” moments because everything is already being tracked.
The visual event creator is genius – your marketing team can define conversion events by literally clicking on page elements instead of bothering developers.
Retroactive analysis has saved my bacon more times than I can count. Being able to go back and analyze user behavior from before you knew it mattered is incredibly powerful.
The Sticker Shock
Heap is expensive. Like, really expensive for small teams. They don’t publish pricing, which usually means “if you have to ask, you can’t afford it.”
The automatic capture creates massive amounts of data, which can be overwhelming. You’ll spend time figuring out what actually matters versus what’s just noise.
Visualizations are pretty basic compared to dedicated BI tools. You get the data but might need other tools to make it look pretty for executives.
Bottom Line
-
Setup: 5/5 – Literally zero manual work required
-
Features: 4/5 – Strong analytics, basic visualizations
-
Visual insights: 4/5 – Good session replay and behavioral data
-
Learning curve: 4/5 – Easy for non-technical users
-
Cost: 2/5 – Premium pricing, no transparency
-
Privacy: 3/5 – Standard enterprise features
What Teams Report
Product managers rave about the retroactive analysis capabilities. Finance teams often push back on the pricing. Marketing teams love the visual event creator.
Source: G2 and Capterra user reviews
Pricing Reality
Custom pricing through sales only. Expect to pay significantly more than other options on this list.
Learn more at Heap’s website.
Amplitude – Enterprise Behavioral Analytics
When You Need the Big Guns
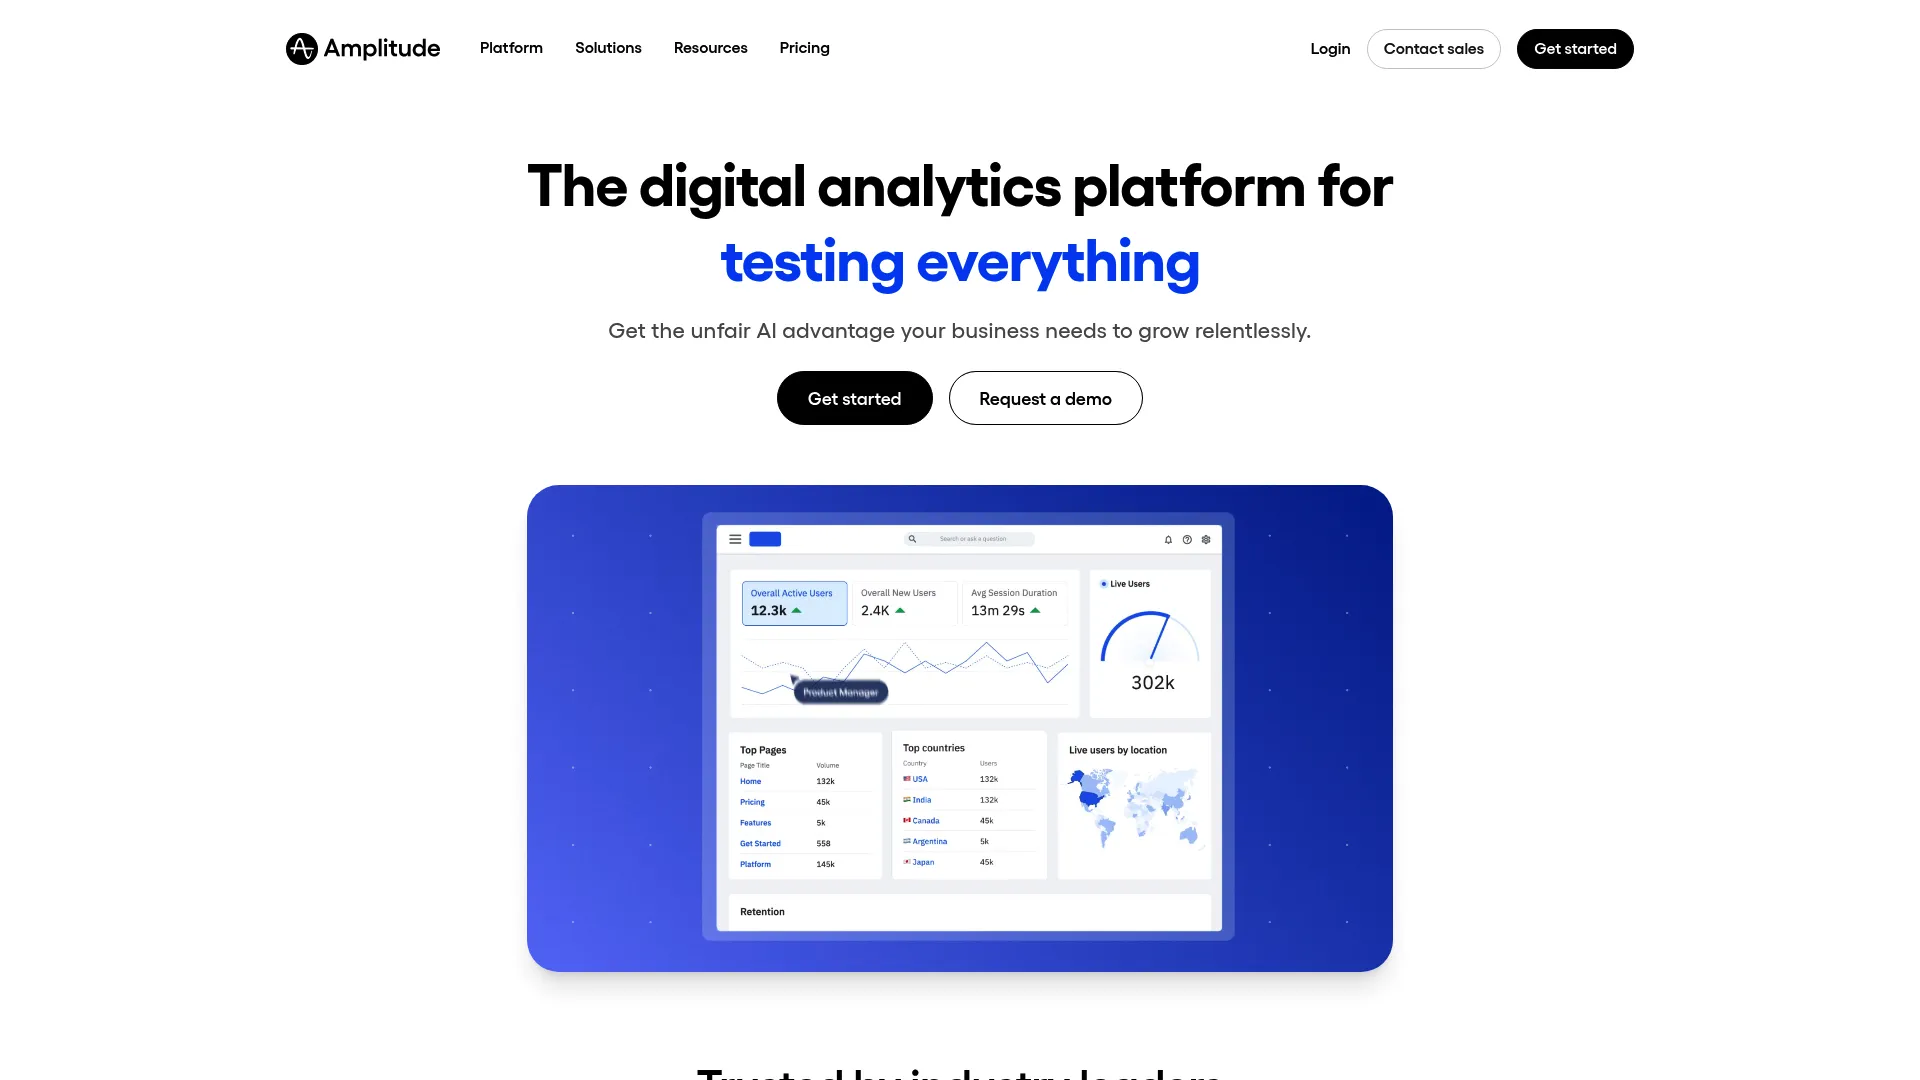
Amplitude is what happens when data scientists build an analytics platform. It’s incredibly powerful, has AI insights that actually work, and can handle enterprise-scale data without breaking a sweat.
It’s also complete overkill for most businesses. Like bringing a Formula 1 car to your daily commute.
The manual event setup requirements mean you’ll need dedicated engineering time just to get basic tracking working. But if you’ve got the resources and need sophisticated behavioral analysis, Amplitude delivers.
Built for Data Scientists
Amplitude doesn’t mess around with basic analytics:
-
Advanced behavioral cohorts that slice data in ways you didn’t know were possible
-
AI-powered insights that surface patterns you’d never find manually
-
A/B testing with statistical rigor that would make researchers proud
-
Revenue analytics that connect user actions to actual dollars
-
Enterprise security that meets the strictest compliance requirements
-
Predictive analytics that forecast user behavior
When It Makes Sense
If you have a data team that lives and breathes user behavior analysis, Amplitude gives them superpowers. The AI insights genuinely surface patterns that would take weeks to find manually.
Enterprise organizations with complex user journeys and multiple touchpoints benefit from the sophisticated attribution modeling.
The predictive capabilities help you identify users likely to churn or convert before they actually do, which is pretty valuable for high-LTV businesses.
The Reality Check
Manual event tracking means weeks of development work before you see any value. Your engineering team will need to instrument every interaction you want to measure.
The learning curve is steep. Really steep. Non-technical team members will struggle with the interface complexity.
Pricing starts high and goes up quickly. The “starter” plan assumes you’re already a pretty big business.
Limited session replay and visual insights mean you’ll need additional tools to understand the qualitative side of user behavior.
Bottom Line
-
Setup: 2/5 – Manual tracking requires significant dev work
-
Features: 5/5 – Most sophisticated analytics available
-
Visual insights: 3/5 – Limited qualitative features
-
Learning curve: 3/5 – Complex but powerful
-
Cost: 2/5 – Enterprise pricing from day one
-
Privacy: 4/5 – Strong enterprise compliance features
Enterprise Feedback
Large product teams appreciate the analytical depth and AI capabilities. Smaller teams often find it overwhelming and expensive for their needs.
Source: Enterprise software review platforms and product management communities
Pricing Expectations
Free tier for startups with limited features. Premium plans start at $49/month but realistically expect much higher costs for useful feature sets.
Discover Amplitude at their platform.
Hotjar – Visual User Insights
The “Show, Don’t Tell” Platform
Hotjar revolutionized analytics by making user behavior visual. Instead of staring at conversion rates wondering why they’re low, you can literally watch users struggle with your checkout flow.
Heatmaps show where people click, scroll, and get stuck. Session recordings let you see exactly what frustrated that user who abandoned their cart. It’s like having x-ray vision for your website.
When people ask me “Do I really need to see recordings of users clicking around my site?” my answer is always: if you’re guessing why people aren’t converting, yes.
Visual Insights That Actually Help
Hotjar focuses on showing you what users do rather than just telling you numbers:
-
Click, move, and scroll heatmaps that reveal user attention patterns
-
Session recordings with privacy controls (no personal data captured)
-
On-site surveys and feedback widgets to ask users directly what’s wrong
-
Funnel analysis to see exactly where people drop off
-
User interview recruitment tools to talk to real customers
-
Integrates seamlessly with Google Analytics and other platforms
Why It Just Works
The setup is dead simple – add one script and you’re collecting insights within minutes. The visual nature means anyone on your team can understand what’s happening without needing analytics training.
Privacy controls are built-in, so you’re not accidentally recording sensitive information. The heatmaps immediately show you if your important buttons are getting ignored or if people are clicking on things that aren’t clickable.
Session recordings are addictive once you start watching them. You’ll finally understand why that “obvious” call-to-action button isn’t working.
The Limitations
Hotjar doesn’t replace your main analytics platform – it complements it. You won’t get sophisticated funnel analysis or cohort studies here.
The quantitative side is pretty basic. If you need complex segmentation or advanced behavioral analytics, you’ll need something else alongside Hotjar.
Site performance can take a small hit from the recording scripts, though it’s usually not noticeable.
Bottom Line
-
Setup: 5/5 – Add script, start learning immediately
-
Features: 2/5 – Limited quantitative analytics
-
Visual insights: 5/5 – Industry standard for heatmaps and recordings
-
Learning curve: 5/5 – Anyone can use it
-
Cost: 4/5 – Reasonable pricing with functional free tier
-
Privacy: 4/5 – Good privacy controls built-in
What UX Teams Say
Designers and conversion specialists swear by Hotjar’s visual insights. Marketing teams love being able to see user frustration points without needing technical help.
Source: UX design communities and conversion optimization forums
Pricing That Makes Sense
Free tier with basic features. Paid plans start at $39/month with reasonable usage limits.
Start with Hotjar at their website.
FullStory – Digital Experience Intelligence
Enterprise-Grade User Experience Analysis
FullStory takes session recordings to the next level with AI that automatically identifies user frustration, errors, and optimization opportunities. It’s like having a UX researcher watching every user session and flagging problems.
The platform captures pixel-perfect recordings of user sessions, then uses machine learning to surface patterns you’d never find manually. Pretty cool tech, but it comes with enterprise complexity and pricing.
AI-Powered Experience Insights
FullStory goes beyond basic session recordings:
-
Pixel-perfect session replays with advanced search and filtering
-
AI automatically identifies user frustration, rage clicks, and errors
-
Heatmaps and click tracking for visual behavior analysis
-
Performance monitoring that connects slow pages to user abandonment
-
Conversion funnel analysis with detailed user journey context
-
Enterprise security features for sensitive data handling
When It Shines
The AI insights genuinely save time by surfacing problems automatically. Instead of watching hundreds of recordings, you get flagged sessions where users had issues.
Enterprise organizations appreciate the advanced privacy controls and compliance features. The search functionality lets you find specific user behaviors across thousands of sessions.
Integration with customer support tools means you can see exactly what a frustrated customer experienced before they contacted support.
The Enterprise Tax
FullStory is built for big organizations with big budgets. The pricing starts high and the complexity can overwhelm smaller teams.
The learning curve is steep – you’ll need time to understand all the features and set up proper filtering to avoid data overload.
Billing can get expensive quickly as your traffic grows, and the complex feature set means you might pay for capabilities you never use.
Bottom Line
-
Setup: 4/5 – Good autocapture with some configuration needed
-
Features: 4/5 – Comprehensive digital experience analytics
-
Visual insights: 5/5 – Excellent recordings and AI insights
-
Learning curve: 3/5 – Takes time to master
-
Cost: 2/5 – Enterprise pricing from the start
-
Privacy: 4/5 – Strong enterprise privacy features
Enterprise User Feedback
Large UX teams love the AI-powered insights and advanced search capabilities. Smaller teams often find the complexity and cost prohibitive.
Source: Enterprise UX and product management communities
Pricing Expectations
Starts at $299/month with no free tier. Enterprise features require custom pricing discussions.
Explore FullStory at their platform.
Heatmap.com – Revenue-Focused Analytics
Every Click Connected to Revenue
Heatmap.com takes a unique approach by connecting every user interaction directly to revenue impact. Instead of just showing you where people click, it shows you which clicks actually lead to sales.
This eCommerce-focused platform uses AI to identify exactly which page elements drive conversions and which create friction in your buying process. It’s like having a conversion optimization consultant built into your analytics.

Revenue-First Analytics
Heatmap.com focuses on what actually matters for online businesses:
-
Revenue-based heatmaps showing dollar impact of each page element
-
AI-powered recommendations for specific optimization changes
-
Pixel-level attribution connecting design elements to actual sales
-
Site speed tracking with revenue impact analysis
-
Direct integrations with Shopify, WooCommerce, and other eCommerce platforms
-
Customer journey mapping focused on purchase behavior
Why eCommerce Teams Love It
The revenue attribution eliminates guesswork – you know exactly which changes will impact your bottom line. AI recommendations give you specific actions to take rather than just data to interpret.
The eCommerce focus means features are tailored for online retail challenges like cart abandonment, product page optimization, and checkout flow improvement.
Customer support actually helps you implement their recommendations, which is refreshing compared to platforms that just dump data on you.
The Niche Limitation
It’s really built for eCommerce, so if you’re not selling products online, most features won’t apply to your business. Being newer means fewer case studies and community resources.
The specialized focus means you’ll still need other tools for comprehensive user analytics beyond commerce behavior.
Integration options are limited compared to more established platforms, though they cover the major eCommerce platforms well.
Bottom Line
-
Setup: 4/5 – Easy for eCommerce sites
-
Features: 4/5 – Revenue-focused with good depth
-
Visual insights: 4/5 – Heatmaps and session recordings available
-
Learning curve: 5/5 – Simple and focused interface
-
Cost: 4/5 – Competitive for eCommerce-specific features
-
Privacy: 4/5 – Privacy-focused approach
eCommerce User Reviews
Online retailers appreciate the direct revenue connection and specific optimization recommendations. Some note the narrow focus limits broader application.
Source: eCommerce optimization communities and retail analytics forums
Pricing Structure
Starts at $117/month for businesses with $0-$4.9M annual revenue, with tiers based on business size.
Check out Heatmap.com at their website.
Google Analytics 4 – Free Comprehensive Solution
The Free Option Everyone Uses (And Complains About)
Google Analytics 4 is like that free gym membership that comes with your health insurance – it’s comprehensive, it’s free, and it’ll frustrate you regularly. But hey, it’s free and handles massive scale without breaking a sweat.
GA4 provides enterprise-grade analytics capabilities at no cost, which is pretty amazing when you think about it. The catch? You’ll spend hours trying to find simple data that used to take 30 seconds in Universal Analytics.
The privacy concerns in Europe are real, but for many businesses, the comprehensive tracking and Google ecosystem integration make it hard to ignore.
Everything You Need (Hidden Behind Confusing Menus)
GA4 covers most analytics needs without costing anything:
-
Event-based tracking that can capture pretty much any user interaction
-
Conversion funnel analysis and audience segmentation
-
Predictive insights powered by Google’s machine learning
-
Cross-platform tracking for web and mobile apps
-
Deep integration with Google Ads and other Google marketing tools
-
Free data export to BigQuery for advanced analysis
Why It’s Still Everywhere
It’s free. That alone makes it accessible to any organization regardless of budget. The Google ecosystem integration provides powerful marketing attribution that’s hard to replicate elsewhere.
Scalability is never an issue – Google’s infrastructure handles whatever traffic you throw at it. The machine learning insights can surface patterns in large datasets that would be impossible to find manually.
For teams already using Google Workspace and Google Ads, the integration feels natural.
The Frustration Factor
The interface is confusing and finding simple metrics often requires multiple clicks through unintuitive menus. The learning curve from Universal Analytics to GA4 has been painful for many users.
Privacy concerns in Europe mean some businesses can’t use it due to GDPR compliance issues. The AI-driven sampling can affect data accuracy for detailed analysis.
Limited qualitative insights mean you’ll need additional tools for session recordings and heatmaps.
Bottom Line
-
Setup: 3/5 – Event tracking requires some technical work
-
Features: 4/5 – Comprehensive web and marketing analytics
-
Visual insights: 2/5 – Limited session replay and heatmap features
-
Learning curve: 3/5 – Confusing interface, powerful features
-
Cost: 5/5 – Free for most business needs
-
Privacy: 2/5 – GDPR concerns in some regions
What Users Actually Think
Digital marketers appreciate the comprehensive tracking and Google integration. Many complain about the interface complexity and data accessibility compared to Universal Analytics.
Source: Digital marketing communities and privacy advocacy groups
Pricing Reality
Free for most businesses. GA 360 enterprise version starts at $50,000/year (which most businesses don’t need).
Access Google Analytics 4 at Google Analytics.
Matomo – Privacy-First Analytics
Complete Data Ownership Without Compromise
Matomo is what happens when privacy advocates build an analytics platform. You own 100% of your data, need zero cookie banners, and can self-host everything on your own servers.
The privacy-first approach doesn’t mean sacrificing analytical capabilities. You get comprehensive web analytics, heatmaps, and session recordings while maintaining complete control over data handling.
European businesses especially love Matomo because it solves GDPR compliance headaches without limiting analytical insights.
Privacy Without Compromise
Matomo delivers comprehensive analytics while respecting user privacy:
-
Full web and mobile analytics with privacy protection built-in
-
Heatmaps and session recordings with user consent controls
-
Marketing attribution and campaign tracking
-
Custom reporting and dashboard creation that actually works
-
API access for data integration and export
-
GDPR compliance tools and privacy impact assessments
Why Privacy-Conscious Organizations Choose It
100% data ownership means no vendor dependency or privacy concerns about third-party data handling. The open-source nature builds trust and enables customization.
No cookie banners required due to privacy-compliant tracking methods. Self-hosting options provide complete control over data location and handling.
The privacy-first approach appeals to organizations that can’t risk data breaches or compliance issues.
The Self-Hosting Reality
Self-hosted deployment requires technical expertise and ongoing server maintenance. Some advanced features differ between self-hosted and cloud versions.
The privacy focus means certain tracking capabilities are limited compared to more aggressive platforms. Community support is active but doesn’t match the resources of larger commercial platforms.
Performance optimization and scaling become your responsibility with self-hosted deployments.
Bottom Line
-
Setup: 4/5 – Good tracking with privacy focus
-
Features: 4/5 – Comprehensive analytics capabilities
-
Visual insights: 4/5 – Heatmaps and recordings available
-
Learning curve: 4/5 – User-friendly with some technical requirements
-
Cost: 4/5 – Free self-hosted, reasonable cloud pricing
-
Privacy: 5/5 – Industry-leading privacy protection
User Feedback
Privacy-conscious organizations consistently choose Matomo for data ownership guarantees. European businesses particularly appreciate GDPR compliance and local hosting options.
Source: Privacy advocacy communities and European business forums
Pricing Options
Free for self-hosted deployments. Cloud plans start at €22/month with usage-based scaling.
Discover Matomo at their website.
Microsoft Clarity – Free Behavioral Insights
Microsoft’s Gift to the Analytics World
Microsoft Clarity being completely free felt like a trap at first. Unlimited session recordings, heatmaps, and AI insights with no traffic limits or feature restrictions? What’s the catch?
Turns out there really isn’t one. Microsoft built this as a loss leader to compete with Google Analytics, and the result is genuinely useful behavioral analytics at zero cost.
The AI insights automatically identify user frustration points and optimization opportunities, making advanced behavioral analysis accessible regardless of budget.
Everything Free, Forever
Clarity provides essential behavioral analytics without any cost:
-
Unlimited session recordings with privacy controls
-
Click and scroll heatmaps for visual behavior analysis
-
AI insights that identify user frustration and dead clicks automatically
-
Google Analytics integration for enhanced data context
-
Mobile app analytics for cross-platform tracking
-
Dashboard sharing and collaboration tools
Why It’s Actually Great
Completely free forever with no traffic limitations makes it accessible to any organization. The AI-powered insights surface user experience issues automatically without manual analysis.
Strong integration with Google Analytics enhances your existing data rather than replacing it. Setup is simple enough that non-technical team members can implement it.
The unlimited nature removes concerns about scaling costs as your traffic grows.
The Interface Reality
The UI navigation can be frustrating when you’re trying to find specific insights quickly. Limited customization options restrict advanced analysis capabilities.
Occasional data accuracy issues affect reliability for critical business decisions. The free model raises questions about long-term feature development priorities.
Some advanced filtering and segmentation features lag behind paid alternatives.
Bottom Line
-
Setup: 4/5 – Simple automatic capture
-
Features: 3/5 – Good behavioral insights, limited advanced analytics
-
Visual insights: 4/5 – Strong heatmaps and session recordings
-
Learning curve: 3/5 – UI complexity affects navigation
-
Cost: 5/5 – Completely free forever
-
Privacy: 3/5 – Standard privacy features
What Teams Report
Budget-conscious teams love the comprehensive free offering. UX researchers appreciate the AI insights, though many suggest interface improvements would help usability.
Source: Budget-focused business communities and UX research forums
Pricing Truth
Free forever with no limitations on traffic or features.
Start using Microsoft Clarity at their platform.
Other Options Worth Mentioning
These didn’t make the top 10 but solve specific problems you might have.
FullSession
FullSession focuses on user behavior analytics with session recordings and heatmaps. GDPR compliant with competitive pricing starting at $39/month. Good middle ground between basic and enterprise-level complexity.
Kissmetrics
Kissmetrics specializes in marketing-focused analytics with excellent customer journey tracking. Best for marketing teams needing behavior-based automation, though pricing starts at $199/month.
Smartlook
Smartlook combines quantitative and qualitative data through recordings and heatmaps. Solid value with free plans available, but users report UI improvements needed and occasional recording bugs.
Lucky Orange
Lucky Orange provides conversion optimization with dynamic heatmaps and live chat functionality. Delivers immediate insights but can overwhelm users with information volume.
Questions Everyone Asks Me
Do I really need session recordings and heatmaps?
If you’re seeing weird user behavior in your data – like high bounce rates on important pages or people dropping off at checkout for no obvious reason – then yes, you need to see what’s actually happening.
Session recordings show you the user’s actual experience: where they get confused, what they click that doesn’t work, or why they abandon forms halfway through. It’s like having someone look over users’ shoulders while they navigate your site.
Short answer: if you’re guessing why people aren’t converting, visual insights will save you weeks of A/B testing random changes.
Can I use multiple platforms together without going crazy?
Absolutely, and most successful teams do exactly this. The key is picking one primary platform for your main analytics, then adding specialized tools for specific insights.
Common combo: PostHog or Amplitude for comprehensive analytics, plus Hotjar for visual insights. Or Google Analytics 4 for basic tracking with Microsoft Clarity for behavioral data.
Just don’t try to use five different platforms – you’ll spend more time jumping between dashboards than actually making decisions.
What if I’m bootstrapping and have zero budget?
Start with Microsoft Clarity for behavioral insights and either OpenPanel (self-hosted) or Google Analytics 4 for basic tracking. This combo covers 80% of what most businesses need without spending a dime.
The GA4 audit guide helps identify data quality issues that complement behavioral insights from session recordings, providing a framework for validating quantitative data accuracy alongside qualitative observations.
Upgrade to paid tools only when free options clearly limit your growth or decision-making ability.
How important is self-hosting for data privacy?
It depends on your business and location. If you’re handling sensitive data, operating in privacy-focused regions like Europe, or have strict security requirements, self-hosting gives you complete control.
For most businesses, cloud-hosted solutions with strong privacy commitments (like Matomo Cloud or PostHog Cloud) provide good middle ground without the technical overhead.
The main trade-off is control versus convenience. Self-hosting requires technical expertise and ongoing maintenance.
Should I switch from Mixpanel right now?
Only if Mixpanel is actively causing problems. The manual event tracking overhead, high costs, or missing features are good reasons to switch.
If it’s working for your team and budget, there’s no rush. But if you’re hitting limitations or your team is frustrated with the complexity, the alternatives we’ve covered solve those specific pain points.
The advanced analytics strategic growth framework helps determine when upgrading from current tools becomes necessary, providing decision criteria for platform investment timing based on business maturity and data requirements.
Final Thoughts
Here’s what I learned after six months of testing these platforms: the best analytics tool is the one your team actually uses to make decisions.
I’ve seen businesses collect mountains of data in sophisticated platforms while making gut-based decisions because the insights were buried in complex interfaces. I’ve also seen teams drive significant growth with simple tools because they focused on actionable metrics.
Start with your biggest pain point: If manual event tracking is killing your development velocity, prioritize autocapture solutions like Heap or PostHog.
Match your team’s skills: Non-technical teams benefit from visual platforms like Hotjar, while technical teams can leverage open-source flexibility from OpenPanel or Matomo.
Budget constraints don’t mean settling: Microsoft Clarity and OpenPanel prove powerful analytics don’t require premium pricing.
Privacy isn’t optional: European organizations and privacy-conscious businesses should prioritize Matomo or self-hosted solutions from day one.
Integration complexity compounds: Choose platforms that play well with your existing tech stack to avoid future headaches.
The mixpanel alternatives we’ve covered solve real problems without creating new ones. Whether you choose PostHog’s comprehensive suite, Hotjar’s visual insights, or OpenPanel’s simplicity, focus on extracting actionable insights rather than collecting perfect data.
The marketing ROI calculator helps measure the financial impact of your analytics platform investment, providing quantitative assessment tools for platform selection ROI based on expected data-driven improvements.
At The Marketing Agency, we don’t just help you pick the right analytics platform – we make sure your data actually drives profitable decisions. Too many businesses get stuck in “analysis paralysis” mode, collecting data without turning insights into growth strategies.
Whether you’re implementing PostHog’s feature flags, interpreting Hotjar’s session recordings, or setting up proper attribution in GA4, we help you avoid the common trap of having great data but making the same old decisions.
Ready to turn your analytics setup into a growth engine? Let’s talk about how the right platform and strategic expertise can accelerate your business objectives.
