


Look, I’ll be straight with you – most of us are drowning in session recordings but starving for actual insights that help us fix problems and grow our business. We’ve all been there, staring at user analytics data that feels more like hieroglyphics than actionable information.
Last month, I was on a call with Sarah from our product team, and she said something that stuck with me: “We have 10,000 session recordings, but I still don’t know why people are abandoning our checkout page.” Sound familiar? You’re definitely not alone in this frustration.
Here’s the thing about the user analytics space – it’s packed with tools that all promise to be your magic bullet for understanding users. After testing way too many platforms (and probably annoying my team in the process), I’ve learned this: the right choice isn’t about finding the tool with the most bells and whistles. It’s about finding one that your team will actually use and that fits your budget without making your CFO cry.
Table of Contents
-
TL;DR: Quick Decision Guide
-
Comparison Table
-
Criteria Breakdown Summary
-
LogRocket – Best Known for AI-Powered Session Intelligence
-
FullSession – Best Known for Transparent Pricing
-
Hotjar – Best Known for User-Friendly Interface
-
Amplitude – Best Known for Product Analytics
-
Mixpanel – Best Known for Event Tracking
-
Smartlook – Best Known for Mobile Support
-
Mouseflow – Best Known for Form Analysis
-
Heap – Best Known for Automatic Data Capture
-
Pendo – Best Known for Product Experience
-
UXCam – Best Known for Mobile Analytics
-
Notable Mentions
-
FAQ
-
Final Thoughts
TL;DR: Quick Decision Guide
Let me save you some time with rapid-fire recommendations based on what you actually need (not what sounds cool in a demo):
Best Overall Pick: LogRocket – Yes, it’s pricey, but the AI actually works and saves you hours of digging through useless recordings
Best Bang for Your Buck: FullSession – Enterprise features at $39/month? Yeah, I was skeptical too until I tried it
Easiest to Get Started: Hotjar – Your marketing team can set this up during lunch break (just watch your site speed)
Best for Product Nerds: Amplitude – If you love cohort analysis and statistical significance, this is your jam
Best for Mobile Apps: UXCam – They actually understand touch interactions and app crashes
Best for Lazy Developers: Heap – Set it once, capture everything forever (your wallet might not love it though)
Best for Broke Startups: Mixpanel – 20M events free is no joke
Best Enterprise Solution: Smartlook – Plays nice with everything you’re already using
Need help figuring out which FullStory alternatives won’t make you regret your life choices? The comparison table below cuts through the marketing fluff.
Comparison Table
|
Platform |
Best For |
Starting Price |
Data Collection |
AI Intelligence |
Session Replay |
Mobile Support |
|---|---|---|---|---|---|---|
|
LogRocket |
AI-Powered Intelligence |
$199/month |
5/5 |
5/5 |
5/5 |
✓ |
|
FullSession |
Transparent Pricing |
$39/month |
5/5 |
4/5 |
5/5 |
✓ |
|
Hotjar |
User-Friendly Interface |
$39/month |
3/5 |
2/5 |
3/5 |
Limited |
|
Amplitude |
Product Analytics |
$61/month |
4/5 |
3/5 |
3/5 |
✓ |
|
Mixpanel |
Event Tracking |
$24/month |
4/5 |
2/5 |
2/5 |
✓ |
|
Smartlook |
Mobile Support |
€55/month |
4/5 |
3/5 |
4/5 |
✓ |
|
Mouseflow |
Form Analysis |
$34/month |
4/5 |
3/5 |
4/5 |
Limited |
|
Heap |
Automatic Data Capture |
Contact Sales |
5/5 |
3/5 |
3/5 |
✓ |
|
Pendo |
Product Experience |
Contact Sales |
3/5 |
3/5 |
2/5 |
✓ |
|
UXCam |
Mobile Analytics |
Contact Sales |
4/5 |
3/5 |
4/5 |
✓ |
Criteria Breakdown Summary
Here’s the thing about choosing analytics tools – everyone gets distracted by shiny features they’ll never use. After watching teams struggle with this decision, I’ve boiled it down to six things that actually matter in real life.
Data collection is about whether the tool captures what you need without breaking your site. Some tools auto-capture everything (convenient but expensive), others make you manually tag events (tedious but flexible).
Ease of use determines if your team will actually use the damn thing. I’ve seen $50K analytics platforms gathering dust because they required a PhD to operate.
AI intelligence separates the tools that just collect data from ones that help you find the sessions that matter. Trust me, manually reviewing 1,000 recordings gets old fast.
Pricing transparency affects whether you can actually budget for this thing. “Contact sales” pricing is usually code for “prepare your wallet for impact.”
Session replay quality is crucial if you want to understand what users are actually doing (versus guessing from charts).
Integration capabilities determine if this tool plays nice with your existing setup or becomes another data silo.
I’ve rated each alternative on a 1-5 scale across these dimensions based on real-world usage, not marketing promises.
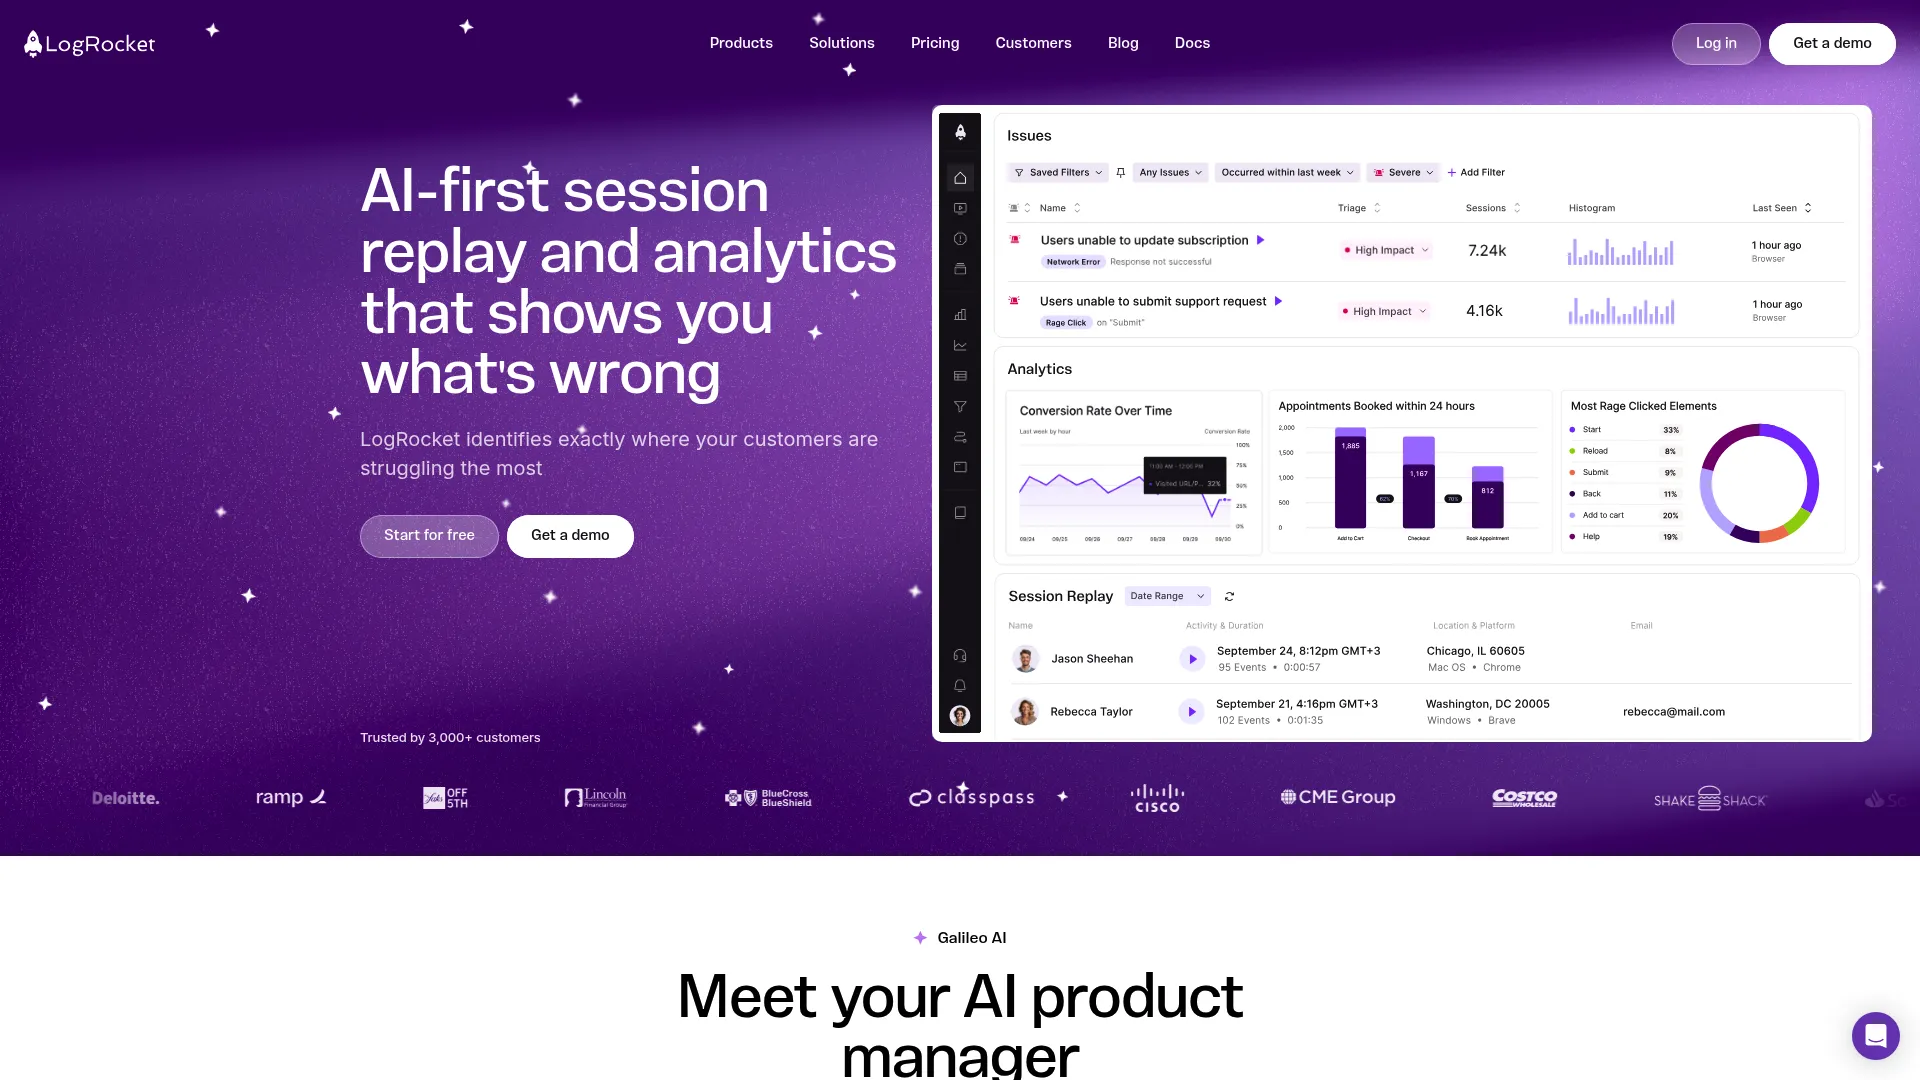
LogRocket
Best Known for AI-Powered Intelligence
LogRocket’s Galileo AI actually works – and I say this as someone who’s usually skeptical of “AI-powered” marketing claims. Instead of drowning in random session recordings, it surfaces the ones where users hit bugs or got frustrated.
Here’s what happened when we tested LogRocket: within the first week, Galileo flagged a session where a user tried to complete checkout seven times before giving up. Turns out our payment processor was failing silently on certain credit card types. We never would have found that manually sifting through recordings.
The platform doesn’t just show you what users did – it shows you what broke while they were doing it. CPU spikes, slow API calls, JavaScript errors – all tied to specific user sessions. It’s like having a developer sitting next to every user, taking notes.
Features
LogRocket captures everything: clicks, scrolls, form inputs, even rage clicks (when someone frantically clicks a broken button). But here’s the kicker – it also monitors your app’s performance in real-time. So when a user abandons your checkout, you can see if it was because the page took 8 seconds to load.
The error tracking integration means you’re not just watching user behavior in isolation. You see exactly what technical issues happened during each session. Custom events let you track business-specific actions, and the search functionality actually works (unlike some tools where finding specific sessions feels like archaeology).
Pros
The AI session prioritization genuinely saves time. Instead of randomly clicking through recordings, Galileo shows you sessions with errors, performance issues, or unusual behavior patterns. Our product team went from spending entire afternoons reviewing sessions to getting actionable insights in 30 minutes.
Real-time alerts catch problems as they happen. Last month, we got pinged about a sudden spike in checkout errors and fixed it before losing significant revenue. The mobile and web coverage means you’re not juggling multiple tools.
Cons
Let’s talk about the elephant in the room: price. At $199/month minimum, this isn’t pocket change for smaller teams. I’ve had to justify this cost to finance more than once (though the bug catches usually pay for themselves).
The feature richness can overwhelm teams that just want basic session replay. You’re paying for AI and performance monitoring whether you use them or not. Some users report the filtering can be finicky when you’re looking for very specific scenarios.
Criteria Evaluation
-
Data Collection: 5/5 – Captures user behavior plus technical performance context
-
Ease of Use: 4/5 – Intuitive once you learn it, but there’s definitely a learning curve
-
AI Intelligence: 5/5 – Galileo actually delivers on the AI promises
-
Pricing: 3/5 – Expensive but justifiable if you use the advanced features
-
Session Replay: 5/5 – High-quality recordings with excellent search
-
Integration: 5/5 – Plays well with development tools and error tracking
Community Reviews and Expert Recommendations
Developers love LogRocket because it connects user frustration to actual technical problems. Product managers appreciate not having to guess why conversion rates dropped – they can see exactly what went wrong in user sessions.
The main complaint is cost, especially from smaller teams. Some users wish the AI was more customizable for industry-specific use cases. Enterprise teams consistently praise the integration ecosystem.
Source: G2, Capterra, and user interviews
Pricing
Starts at $199/month and goes up from there based on usage. Yes, it’s expensive, but if you’re losing revenue to bugs you can’t reproduce, it pays for itself quickly.
View LogRocket pricing details
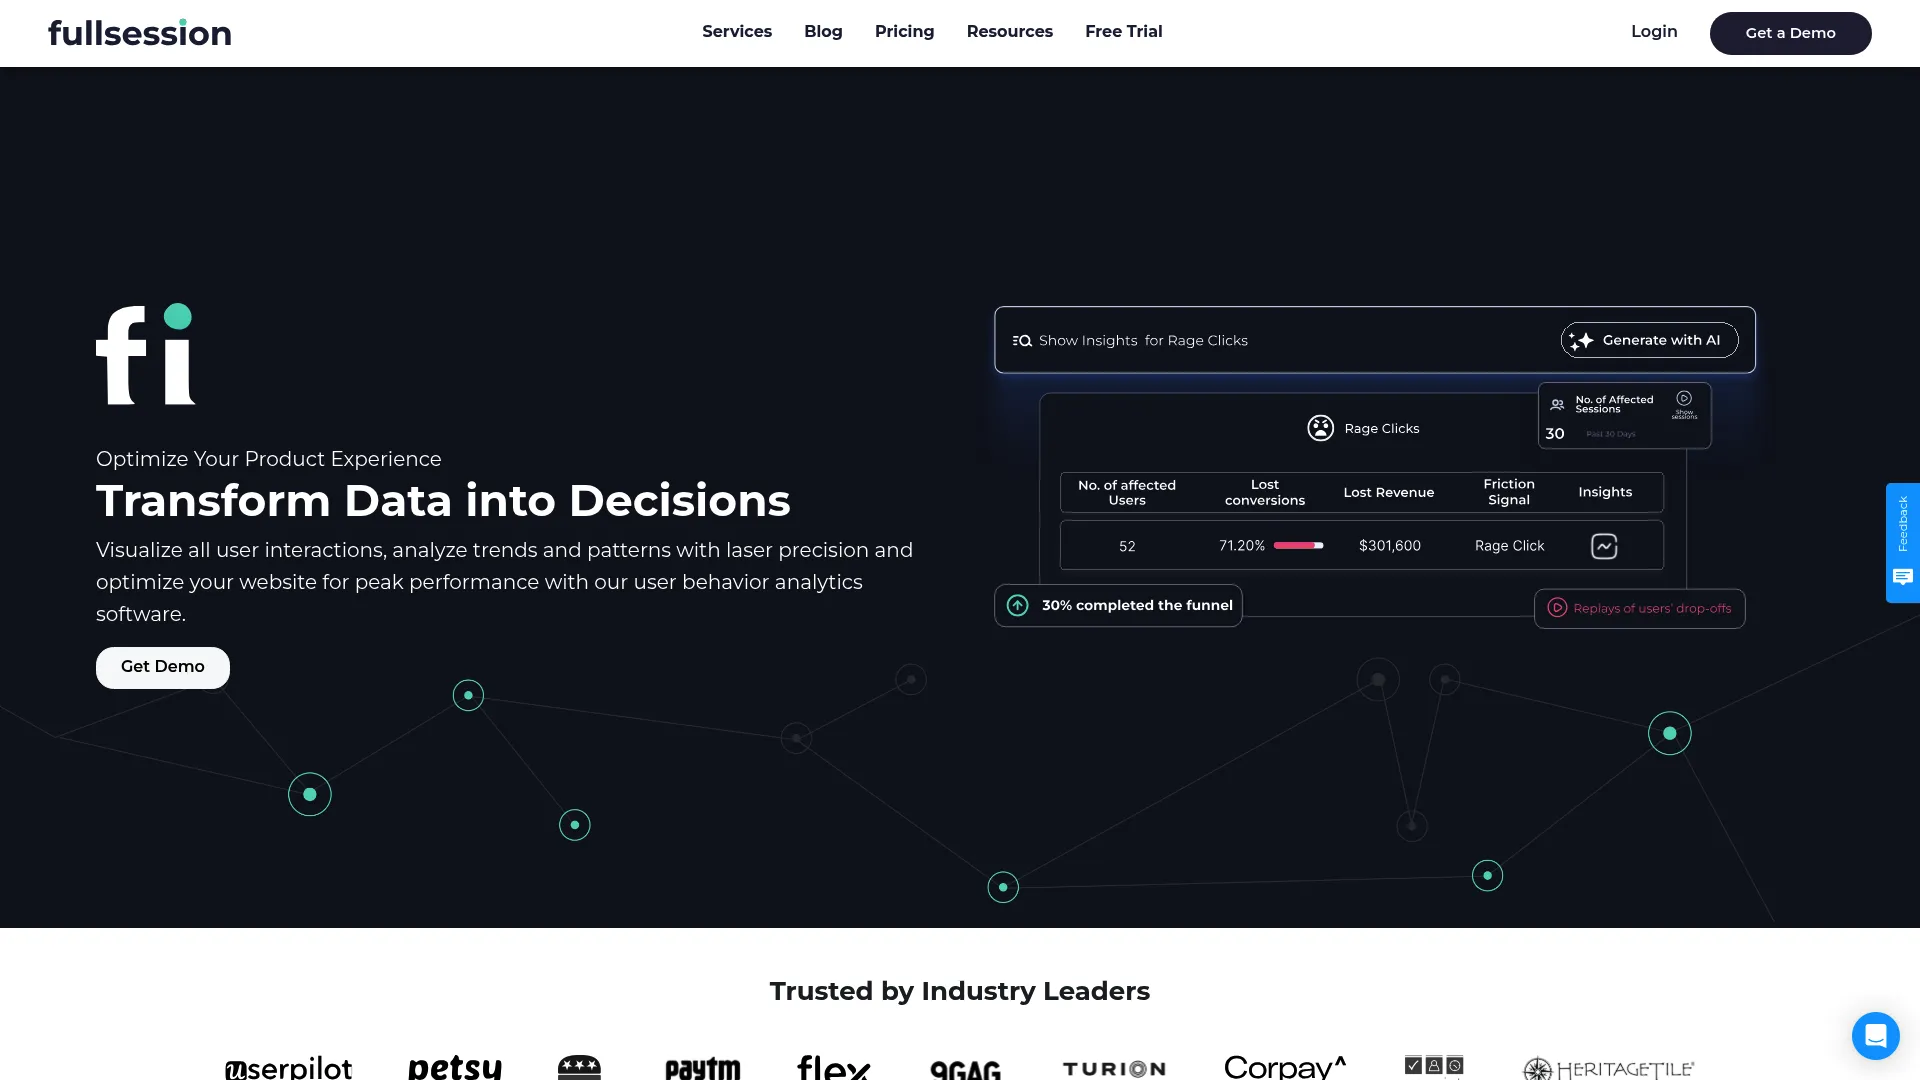
FullSession
Best Known for Transparent Pricing
FullSession does something revolutionary in the analytics world: they actually tell you what it costs upfront. No “contact sales” games, no hidden fees that appear after you’re hooked. Just honest pricing starting at $39/month.
But don’t mistake affordable for basic. I was honestly surprised by how much this platform delivers for the price. Real-time processing, comprehensive privacy compliance, and session replay quality that rivals tools costing 5x more.
The best part? Your website won’t slow down. We’ve tested this on several client sites, and page load times stayed consistent. That’s not something you can say about every session replay tool.
Features
FullSession takes an all-in-one approach that actually works. User segmentation lets you slice data by practically any criteria you can think of. The heatmaps cover clicks, scrolls, and mouse movements – giving you the full picture of user engagement.
Built-in feedback forms mean you can ask users directly what went wrong instead of just guessing from their behavior. The conversion funnel tools help identify exactly where people drop off, while error analysis catches JavaScript problems that might be breaking experiences.
Pros
The pricing transparency is refreshing in an industry full of “contact sales” pricing. At $39/month for 5,000 sessions, it’s accessible for small businesses while packing features that bigger companies need.
Zero performance impact isn’t just marketing speak – we’ve verified this across multiple implementations. The real-time processing means you can spot trends as they develop instead of waiting for overnight batch processing.
Cons
Being newer means fewer case studies and less market buzz (though that’s changing fast). The integration ecosystem isn’t as extensive as established players, but they’re adding new ones regularly.
Some power users might want more advanced analytics features, though this could be a plus for teams that prefer simplicity over complexity.
Criteria Evaluation
-
Data Collection: 5/5 – Comprehensive capture without performance impact
-
Ease of Use: 5/5 – Non-technical team members can extract insights immediately
-
AI Intelligence: 4/5 – Smart filtering and automated insights
-
Pricing: 5/5 – Actually tells you what it costs (revolutionary!)
-
Session Replay: 5/5 – Real-time, high-quality recordings with privacy protection
-
Integration: 4/5 – Growing integration library, all-in-one approach reduces need
Community Reviews and Expert Recommendations
Early adopters consistently mention the value proposition – enterprise features without enterprise pricing. Teams appreciate that non-technical members can get insights without extensive training.
Customer support gets high marks for responsiveness and actually helping (not just sending knowledge base links). Privacy-focused businesses love the comprehensive compliance features.
Source: Early user feedback and beta testing programs
PricingStarts at $39/month for 5,000 sessions with 20% off annual plans. The transparent pricing makes budget planning actually possible. Check FullSession pricing options
Hotjar
Best Known for User-Friendly Interface
Hotjar is like the Honda Civic of user analytics – reliable, affordable, and everyone knows how to use it. If you need your marketing team to extract insights without bothering the developers, Hotjar delivers.
The interface feels intuitive from day one. No training sessions, no complex setup wizards – just install the tracking code and start seeing how users interact with your site. This simplicity is both Hotjar’s biggest strength and its main limitation.
Here’s the thing though: Hotjar can slow down your site. We’ve seen load times increase by 1-2 seconds on some implementations, which is a real problem if you care about SEO and user experience.
Features
Hotjar focuses on the fundamentals without overwhelming you with advanced features. Heatmaps show where people click and scroll, session recordings reveal user journeys, and feedback widgets let you ask users directly what they think.
The conversion funnel visualization helps identify drop-off points, though it’s not as detailed as specialized product analytics tools. User interview scheduling is a nice touch for teams that want to combine quantitative data with qualitative insights.
Pros
Implementation takes about an hour, and most teams can start extracting value immediately. The user-friendly interface means your customer success and marketing teams can find insights without depending on technical resources.
The feedback collection features are particularly strong – multiple ways to gather user opinions that provide context behavioral data often misses. For small businesses just starting with user analytics, it’s hard to beat the combination of simplicity and affordability.
Cons
The performance impact is real. We’ve had clients whose Core Web Vitals scores dropped after implementing Hotjar, affecting their SEO rankings. The recording prioritization is basic, so you might miss important sessions while capturing routine browsing.
Real-time data isn’t available – there’s always a delay between user actions and data showing up in your dashboard. Advanced users often outgrow Hotjar’s capabilities as their analytics needs become more sophisticated.
Criteria Evaluation
-
Data Collection: 3/5 – Captures the basics but misses technical context
-
Ease of Use: 5/5 – Your grandmother could probably figure this out
-
AI Intelligence: 2/5 – Limited smart features
-
Pricing: 4/5 – Affordable for small businesses, free tier available
-
Session Replay: 3/5 – Basic functionality with some limitations
-
Integration: 4/5 – Decent third-party connections
Community Reviews and Expert Recommendations
Marketing teams love Hotjar’s simplicity and the ability to share insights through easy-to-understand visualizations. It’s often the first analytics tool non-technical teams adopt successfully.
However, growing businesses frequently hit limitations as their needs become more sophisticated. The site performance impact is a common complaint, especially from teams focused on page speed optimization.
Source: G2, Capterra, and user surveys
Pricing
Free plan covers 35 daily sessions, paid plans start at $39/month. Competitive pricing for basic user behavior analytics.
Amplitude
Best Known for Product Analytics
Amplitude is for teams that love data science and have the technical chops to use it properly. If you need to understand user cohorts, run proper A/B tests, and dig deep into product analytics, Amplitude delivers insights that simpler tools can’t touch.
But let’s be real – this isn’t a tool for casual analytics. The learning curve is steep, and you’ll need someone on your team who understands statistical significance and cohort analysis. If you just want to see where people click, look elsewhere.
The platform excels at answering complex questions about user engagement and retention over time. However, getting those answers requires significant setup time and technical expertise.

Features
Amplitude’s comprehensive event tracking captures user interactions across your entire product. Cohort analysis reveals how different user groups behave over time, while A/B testing capabilities let you validate hypotheses with proper statistical rigor.
Real-time data streaming keeps your analysis current, and the Snowflake integration appeals to enterprises with complex data infrastructure. Advanced segmentation goes beyond basic demographics to include behavioral patterns and engagement levels.
Pros
The product analytics capabilities are genuinely best-in-class for teams that need sophisticated analysis. If you want to understand which features drive retention or how user behavior changes over time, Amplitude provides the tools and statistical rigor to get reliable answers.
Enterprise-scale analytics handle massive data volumes without breaking. Data-driven teams appreciate the ability to validate assumptions with proper testing methodologies instead of making decisions based on gut feelings.
Cons
Data discrepancies with internal systems create headaches when trying to reconcile different data sources. Implementation is complex and typically requires dedicated technical resources – not something you can set up over lunch.
The expensive pricing puts it out of reach for smaller companies. Session replay is still early-stage, so you’ll need additional tools for qualitative user behavior analysis.
Criteria Evaluation
-
Data Collection: 4/5 – Strong event tracking, less comprehensive than session replay tools
-
Ease of Use: 3/5 – Powerful but requires significant technical knowledge
-
AI Intelligence: 3/5 – Basic AI features, improving but not market-leading
-
Pricing: 2/5 – Expensive, especially for smaller teams
-
Session Replay: 3/5 – Recently added but still developing
-
Integration: 4/5 – Good data warehouse integrations
Community Reviews and Expert Recommendations
Product managers and data analysts praise Amplitude’s analytical depth and statistical capabilities. Enterprise users appreciate the scalability and integration with existing data infrastructure.
Smaller teams often find the complexity overwhelming and the pricing prohibitive. Many users supplement Amplitude with dedicated session replay tools for qualitative insights.
Source: Product management communities and enterprise user feedback
Pricing
Free plan with limited features, paid plans start at $61/month. Enterprise pricing requires sales conversations and typically involves significant investment.
Explore Amplitude pricing options
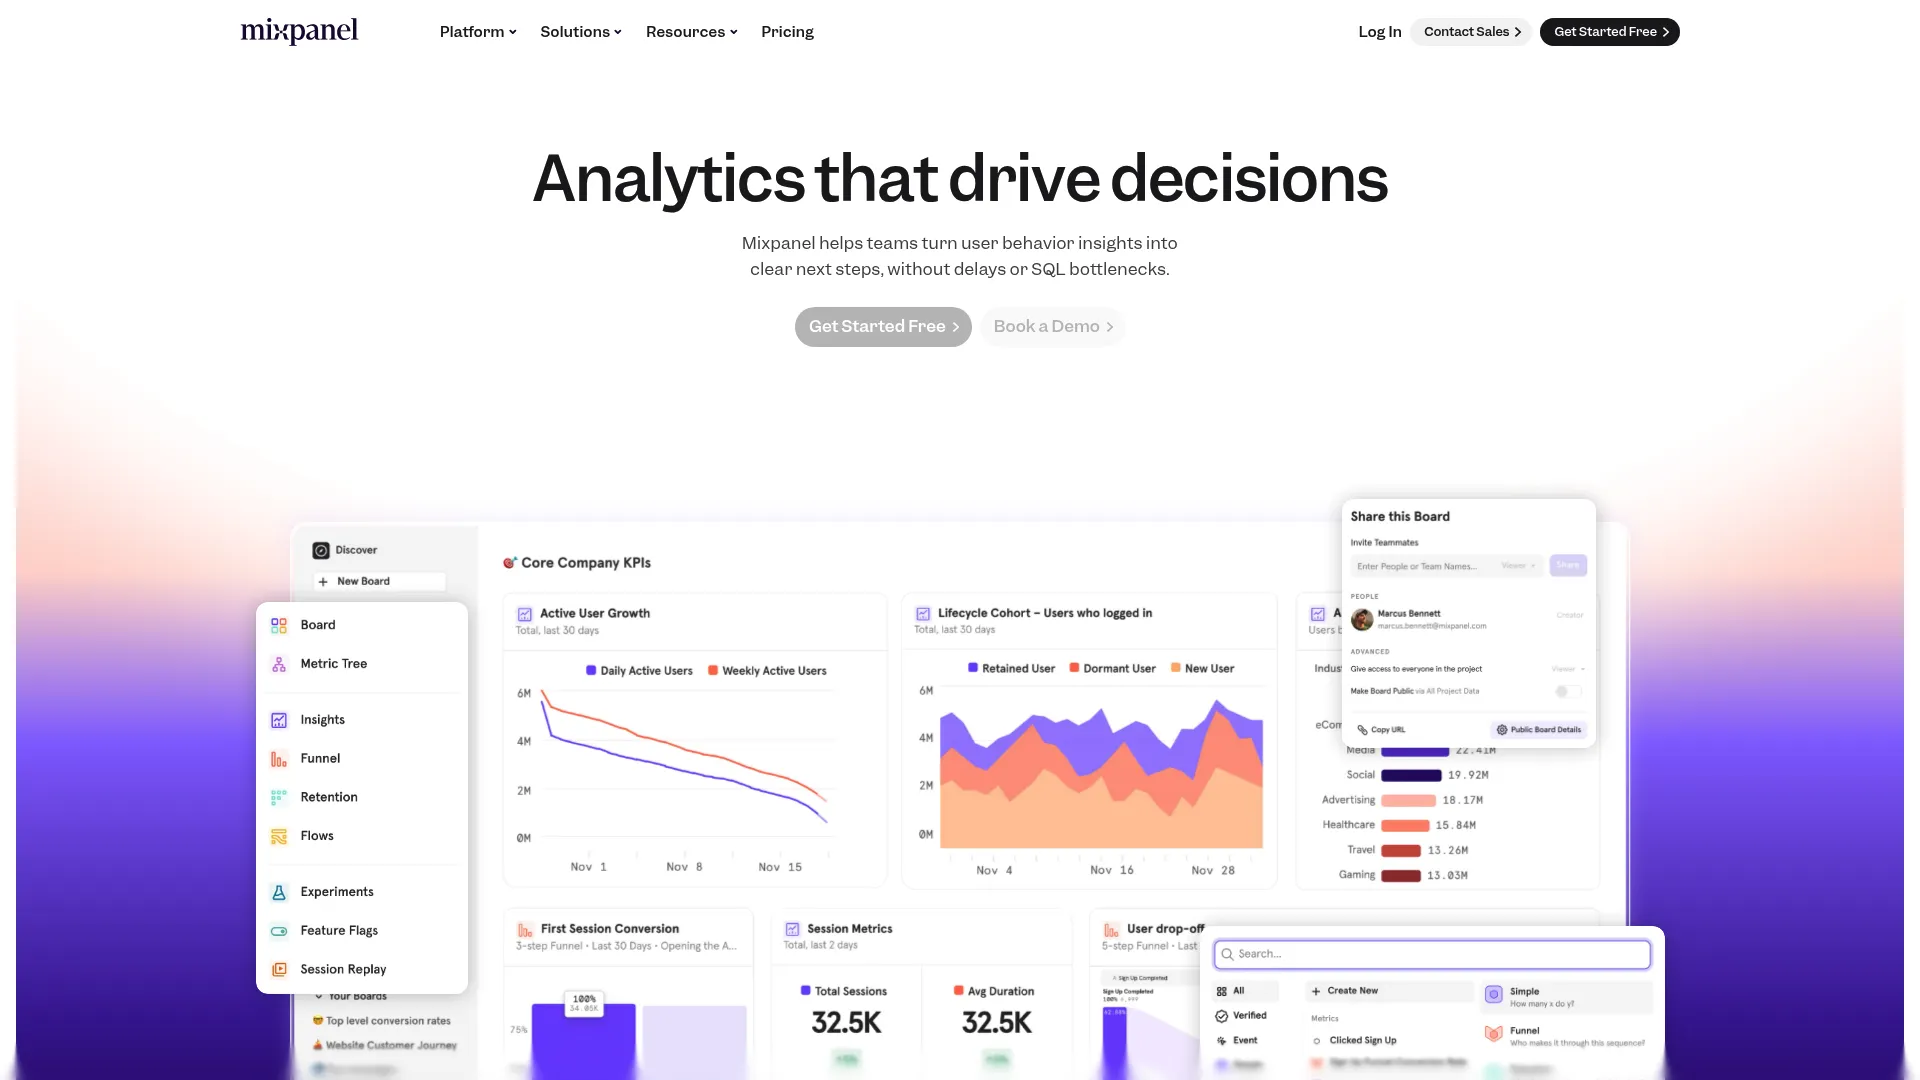
Mixpanel
Best Known for Event Tracking
Mixpanel pioneered event-based analytics, and they’ve spent years perfecting this approach. If you need granular tracking of specific user actions and want to understand how these events correlate with business outcomes, Mixpanel provides the detailed data you’re looking for.
The generous free tier (20 million events) makes it accessible for growing businesses. However, extracting maximum value requires significant setup time and technical understanding – this isn’t a plug-and-play solution.
Here’s the reality: most teams need weeks to become proficient with Mixpanel. But once you get there, the insights can be incredibly valuable for understanding user behavior patterns.
Features
Advanced event tracking and user properties form the foundation of Mixpanel’s approach. Customer journey mapping reveals how users navigate through your product ecosystem. User segmentation and cohort analysis help identify patterns across different user groups.
Interactive reports and dashboards provide flexible visualization options, while real-time analytics ensure you’re working with current data. Mobile and web platform support covers your entire digital presence, though the focus remains heavily on quantitative analysis.
Pros
The generous free plan provides serious analytics power for growing businesses without upfront investment. If you’re a startup tracking user actions across your app, 20 million events goes pretty far.
Strong quantitative analysis capabilities support data-driven decision making with statistical confidence. The event-based pricing model scales naturally with your business growth – you pay for what you actually use.
Mobile app analytics get particular attention, making this an excellent choice for app-focused businesses. The platform handles complex user journeys across multiple touchpoints effectively.
Cons
The steep learning curve means most teams need weeks or months to become proficient. I’ve seen teams abandon Mixpanel after struggling with the initial setup complexity.
Limited chart types and visualization options can frustrate users accustomed to more flexible reporting tools. Session replay remains in beta, so you’ll need additional tools for qualitative insights.
Setup time is significant – expect to invest considerable resources in proper implementation. The interface feels dated compared to newer analytics platforms.
Criteria Evaluation
-
Data Collection: 4/5 – Strong event-based tracking when properly configured
-
Ease of Use: 2/5 – Requires thorough setup and technical understanding
-
AI Intelligence: 2/5 – Limited AI capabilities compared to newer platforms
-
Pricing: 4/5 – Generous free tier, scales with actual usage
-
Session Replay: 2/5 – Beta feature, not fully developed
-
Integration: 4/5 – Good API and integration options
Community Reviews and Expert Recommendations
Technical teams appreciate Mixpanel’s analytical depth and the ability to track complex user journeys. The free tier receives consistent praise from startups that need sophisticated analytics without budget constraints.
However, non-technical users often struggle with the complexity and setup requirements. Many teams end up supplementing Mixpanel with other tools for session replay and qualitative analysis.
Source: Developer communities and startup user feedback
Pricing
Free plan supports 20 million events monthly, with paid plans beginning at $24/month. The event-based pricing model aligns costs with actual usage.
Check Mixpanel pricing structure
Smartlook
Best Known for Mobile Support
Smartlook bridges the gap between simple session replay tools and complex analytics platforms. The combination of visual insights with event-based analytics provides both the “what” and “why” of user behavior. Their mobile app support stands out in a market where many tools treat mobile as an afterthought.
The platform requires no developer involvement for basic setup, which is a godsend for marketing and product teams that need insights without technical dependencies. You can literally get started in 15 minutes.
Features
Session recording works across web and mobile platforms, capturing user interactions in high fidelity. Heatmaps and user interaction visualization reveal engagement patterns across different page elements. Event tracking and funnel analysis help identify conversion bottlenecks.
User segmentation capabilities allow analysis of specific user groups, while error reporting and anomaly detection automatically flag potential issues. The mobile app analytics cover both iOS and Android platforms comprehensively.
Pros
The extensive integration ecosystem (50+ platforms) means Smartlook fits into existing tech stacks without major disruptions. Setup requires no developer involvement, enabling non-technical teams to implement and extract value quickly.
Mobile analytics capabilities rival specialized mobile-only platforms. The balance between features and usability makes it accessible for teams that need more than basic analytics but don’t want enterprise complexity.
Real-time processing ensures data availability without delays – you can watch user sessions as they happen.
Cons
Advanced features come with a learning curve that can frustrate teams expecting plug-and-play simplicity. Costs escalate quickly for larger teams or high-volume usage.
Some users report bugs in funnel analysis functionality. The behavior flow functionality is limited compared to specialized product analytics platforms. Customer support quality varies based on pricing tier.
Criteria Evaluation
-
Data Collection: 4/5 – Good session recording and event tracking
-
Ease of Use: 4/5 – Simple setup, no developer involvement needed
-
AI Intelligence: 3/5 – Error reporting and anomaly detection
-
Pricing: 3/5 – Mid-range pricing, can add up for large teams
-
Session Replay: 4/5 – Quality recordings with mobile support
-
Integration: 5/5 – Over 50 integrations available
Community Reviews and Expert Recommendations
Users consistently highlight the mobile analytics capabilities and the extensive integration options. Product teams appreciate the combination of qualitative and quantitative insights in a single platform.
However, pricing concerns emerge as teams scale, and some users report inconsistencies in data accuracy. The learning curve for advanced features can slow adoption across larger organizations.
Source: Product management forums and mobile app developer communities
Pricing
Free plan for 3,000 monthly sessions, with paid plans starting at €55/month. Pricing scales based on session volume and feature requirements.
View Smartlook pricing details
Mouseflow
Best Known for Form Analysis
Mouseflow carved out a niche by focusing intensely on form analytics and friction scoring. While other platforms treat form analysis as a checkbox feature, Mouseflow makes it the star of the show. This focus pays off for businesses where form completion drives conversions.
The friction scoring system automatically identifies problem areas in user journeys, helping teams prioritize optimization efforts based on actual data rather than assumptions. It’s like having a UX consultant built into your analytics platform.
Features
Session replays include
Session replays include detailed user segment analysis that reveals how different groups interact with your site. Heatmaps visualize interaction patterns across page elements. User journey analytics and path tracking show how visitors navigate through your site.
Conversion funnel monitoring identifies drop-off points, while form analytics reveal which fields cause abandonment. The friction score assessment quantifies user experience problems, helping prioritize improvements.
Pros
The value proposition is compelling – comprehensive analytics at competitive prices. Form analysis capabilities exceed most FullStory competitors, providing detailed insights into field-level interactions.
The user-friendly interface makes insights accessible to non-technical team members. Friction scoring helps identify problem areas automatically rather than requiring manual analysis. The platform provides good value for money compared to enterprise-focused alternatives.
Cons
Advanced tagging features aren’t available in lower pricing tiers, limiting customization options. Survey capabilities are restricted to NPS surveys only. Credit usage transparency could be clearer, making budget planning more difficult.
The feature set is less comprehensive than enterprise solutions, which may limit scalability for growing businesses. Some advanced analytics capabilities lag behind specialized platforms.
Criteria Evaluation
-
Data Collection: 4/5 – Comprehensive user behavior capture with form focus
-
Ease of Use: 4/5 – User-friendly interface and setup
-
AI Intelligence: 3/5 – Friction scoring and basic analytics
-
Pricing: 4/5 – Competitive pricing structure
-
Session Replay: 4/5 – Good replay quality and segmentation
-
Integration: 3/5 – Decent integration options
Community Reviews and Expert Recommendations
Users praise the form analysis capabilities and the friction scoring system. Small to medium businesses appreciate the competitive pricing and ease of implementation.
However, enterprise users often find the feature set limiting as their needs become more sophisticated. The credit-based pricing model can be confusing for teams trying to predict monthly costs.
Source: SMB user reviews and conversion optimization communities
Pricing
Free trial available with paid plans starting at $34/month annually. The pricing structure is competitive for small to medium businesses.
Explore Mouseflow pricing options
Heap
Best Known for Automatic Data Capture
Heap revolutionized analytics by eliminating the need for manual event tracking. The platform automatically captures every user interaction, creating a comprehensive dataset that you can analyze retroactively. This means you never miss important events because you forgot to track them.
The automatic capture philosophy appeals to teams that want comprehensive data without the overhead of maintaining tracking implementations. However, this comprehensive approach comes with complexity that can overwhelm smaller teams.
Here’s the catch: Heap’s pricing is completely opaque. Good luck trying to budget for this without a lengthy sales process.
Features
Autocapture functionality records all user interactions without manual setup requirements. Behavioral analytics work with comprehensive datasets that include historical interactions. Journey analysis and friction point identification reveal user experience problems.
Data science integration capabilities support advanced analysis workflows. Session replay functionality provides qualitative context for quantitative insights. The extensive integration ecosystem includes over 100 platforms.
Pros
Automatic data capture eliminates the ongoing maintenance burden of manual event tracking. You can analyze user behaviors retroactively that you didn’t even know you needed to track.
Comprehensive historical data analysis enables investigation of user behavior patterns over time. Strong integration capabilities support complex data workflows. The platform appeals to data science teams that need comprehensive datasets for advanced analysis.
Cons
Pricing transparency is non-existent, making budget planning impossible without sales conversations. The complex interface requires significant training for most users.
Session replay quality lags behind specialized session replay platforms. The comprehensive data capture can create information overload for teams that need focused insights.
Criteria Evaluation
-
Data Collection: 5/5 – Automatic capture of all user interactions
-
Ease of Use: 3/5 – Powerful but complex interface
-
AI Intelligence: 3/5 – Data science integration capabilities
-
Pricing: 2/5 – Pricing not transparent, typically expensive
-
Session Replay: 3/5 – Basic replay functionality
-
Integration: 5/5 – Over 100 integrations available
Community Reviews and Expert Recommendations
Data science teams appreciate the comprehensive data capture and the ability to perform retroactive analysis. Enterprise users value the integration capabilities and the elimination of manual tracking overhead.
However, smaller teams often find the complexity overwhelming and the pricing prohibitive. Many users supplement Heap with dedicated session replay tools for better qualitative insights.
Source: Data science communities and enterprise analytics teams
Pricing
Heap requires sales consultation for pricing information, with costs typically reflecting enterprise-level investment requirements.
Contact Heap for pricing information
Pendo
Best Known for Product Experience
Pendo approaches user analytics from a product experience perspective, combining analytics with in-app guidance and user onboarding tools. The platform excels at helping users discover and adopt product features through guided experiences and contextual help.
This product-led growth focus makes Pendo particularly valuable for SaaS companies that need to drive feature adoption and reduce churn through better user experiences.
But here’s the thing – session replay is still in beta. If you need comprehensive user behavior analysis, you’ll likely need additional tools.
Features
Product analytics and usage insights reveal how users interact with specific features. In-app guides and onboarding flows help users discover value quickly. User feedback collection through surveys provides qualitative context for behavioral data.
User segmentation and behavior analysis support targeted engagement strategies. Mobile support covers iOS and Android applications. AI-powered user insights help identify patterns and opportunities automatically.
Pros
The platform excels at product-led growth strategies, combining analytics with user engagement tools. In-app guidance capabilities are best-in-class for driving feature adoption.
Most features require no coding, making implementation accessible for product teams. Mobile application support is comprehensive, covering both analytics and engagement features. The combination of analytics and user experience tools eliminates the need for multiple platforms.
Cons
Pricing can be prohibitive for startups and small businesses, limiting accessibility. Session replay functionality remains in beta, requiring additional tools for comprehensive user behavior analysis.
The knowledge base can be outdated, creating frustration during implementation. The feedback module needs improvement compared to specialized survey tools. Enterprise focus means smaller teams may not receive adequate support.
Criteria Evaluation
-
Data Collection: 3/5 – Good product analytics, limited session data
-
Ease of Use: 4/5 – User-friendly for product teams
-
AI Intelligence: 3/5 – AI-powered insights and personalization
-
Pricing: 2/5 – Expensive, especially for startups
-
Session Replay: 2/5 – Beta feature, still developing
-
Integration: 4/5 – Good mobile and platform support
Community Reviews and Expert Recommendations
Product managers praise Pendo’s ability to combine analytics with user engagement tools. The in-app guidance capabilities receive consistent positive feedback for driving feature adoption and reducing support tickets.
However, smaller businesses often find the pricing prohibitive, and the session replay limitations require supplementary tools. Enterprise users appreciate the comprehensive feature set but note implementation complexity.
Source: Product management communities and SaaS user feedback
Pricing
Free trial available with enterprise pricing requiring sales consultation. Costs typically reflect enterprise-level investment requirements.
Contact Pendo for pricing details
UXCam
Best Known for Mobile Analytics
UXCam built their entire platform around mobile app analytics, and this laser focus shows in the quality and depth of their mobile-specific features. While other platforms treat mobile as an afterthought, UXCam makes it the primary focus with features designed specifically for mobile user experiences.
The platform excels at mobile session replays and provides insights that are difficult to obtain through traditional mobile analytics tools. If your business is mobile-first, this deserves serious consideration.
Features
Mobile-focused session replays capture user interactions with high fidelity across iOS and Android platforms. Heatmaps designed for mobile interfaces reveal touch patterns and engagement areas. User journey analysis within apps shows how users navigate through different screens and features.
Issue analytics identify crashes and bugs that impact user experience. Retention analytics and churn analysis help understand user lifecycle patterns. Smart events tracking automatically captures key interactions without manual setup.
Pros
Mobile app analytics capabilities are genuinely best-in-class with features designed specifically for mobile user experiences. High-quality session replays provide clear insights into mobile user behavior patterns.
Retention and churn analysis help understand user lifecycle dynamics. Automatic report generation saves time on routine analysis tasks. The platform understands mobile-specific challenges like touch interactions, screen orientations, and app lifecycle events.
Cons
The mobile-only focus limits usefulness for businesses with significant web presence. Pricing transparency is lacking, requiring sales conversations for detailed cost information.
Lower pricing tiers offer limited customization options. Integration options are fewer compared to web-focused platforms. The specialized focus means you’ll likely need additional tools for comprehensive digital analytics.
Criteria Evaluation
-
Data Collection: 4/5 – Strong mobile app focus
-
Ease of Use: 4/5 – Intuitive for mobile analytics
-
AI Intelligence: 3/5 – Smart events and issue detection
-
Pricing: 3/5 – Contact sales for pricing details
-
Session Replay: 4/5 – High-quality mobile session replays
-
Integration: 3/5 – Mobile-focused integrations
Community Reviews and Expert Recommendations
Mobile app developers consistently praise UXCam’s specialized focus and the quality of mobile session replays. The retention analytics receive positive feedback for helping understand user engagement patterns.
However, businesses with both web and mobile presence often find the mobile-only focus limiting. Pricing concerns emerge for smaller app developers who need comprehensive analytics on limited budgets.
Source: Mobile app developer communities and iOS/Android development forums
Pricing
Free plan for 3,000 monthly sessions, with advanced features requiring sales consultation for pricing details.
Contact UXCam for pricing information
Notable Mentions
A few other platforms deserve a quick mention for specific use cases:
Quantum Metric
Quantum Metric offers digital analytics with Felix AI assistant for session summarization. The AI provides insights for sessions you’ve already identified rather than surfacing new discoveries. Best for teams wanting classic session replay with AI assistance, though it struggles with false positives and high-volume analysis.
Contentsquare
Contentsquare provides comprehensive digital experience analytics with advanced Find & Fix tools. The steep pricing and complex setup make it better suited for large organizations with dedicated analytics teams. The interface can be slow and clunky, requiring significant maintenance and expertise.
Glassbox
Glassbox excels in ecommerce and mobile app analytics but lacks frontend performance metrics like CPU usage and browser crashes. Steep learning curve and confusing navigation make it less ideal for teams seeking intuitive insights.
Highlight
Highlight focuses on developer-oriented observability that excels at catching bugs and providing detailed user interaction context. Primarily designed for engineering teams but offers unique insights into how customers actually use products.
FAQ
What’s the most cost-effective FullStory alternative for small businesses?
FullSession wins hands down with transparent pricing starting at $39/month for 5,000 sessions. You get enterprise features without the enterprise price tag. Hotjar’s also budget-friendly with a free tier, though with more limited capabilities. Mixpanel’s generous free tier (20 million events) works great if you’re willing to invest the setup time.
Which alternative requires the least technical expertise?
Hotjar is the clear winner for simplicity – your marketing team can set it up during lunch and start getting insights immediately. FullSession is also designed for non-technical teams with intuitive dashboards that don’t require a computer science degree. Smartlook offers a good middle ground – simple setup but more advanced capabilities when you’re ready.
How do these alternatives handle data privacy and compliance?
FullSession leads the pack with comprehensive GDPR, CCPA, and PCI compliance built right into their platform. Most established players like LogRocket, Hotjar, and Amplitude offer solid privacy controls, though how well they work depends on your implementation. Always double-check specific compliance requirements with your chosen platform before going live.
Which platform offers the best session replay quality?
LogRocket takes the crown with superior replay quality plus all that technical context and AI-powered prioritization. FullSession delivers excellent real-time replays with strong privacy protection. For mobile specifically, UXCam can’t be beat, while Smartlook offers solid quality across both web and mobile.
How do I choose between event-based and session-based analytics platforms?
Event-based platforms like Mixpanel and Amplitude are great for tracking specific user actions and understanding
Event-based platforms like Mixpanel and Amplitude are great for tracking specific user actions and understanding feature adoption patterns. Session-based platforms like LogRocket and FullSession give you the full user journey visualization. Here’s my rule of thumb: if you need to understand detailed feature usage, go event-based. If you want to see the complete user experience and identify friction points, go session-based.
Can I use multiple analytics tools together?
Absolutely, and many teams do exactly this. A common setup is using a comprehensive tool like LogRocket or FullSession for overall user behavior, plus a specialized tool like Mixpanel for detailed product analytics. Just make sure the additional complexity and cost are worth the extra insights.
For teams looking at multiple analytics solutions, our detailed Hotjar review provides more insights into one of the most popular beginner-friendly platforms. When implementing user behavior analytics, understanding GA4 integration requirements ensures your tools play nicely together. Our hands-on experience with Heap Analytics implementation reveals important considerations for teams considering automatic data capture.
Final Thoughts
Look, choosing the right FullStory alternatives isn’t about finding the platform with the longest feature list – it’s about matching what the tool actually does well with what you actually need. After digging deep into these ten solutions, here’s what really matters:
If budget is tight but you need real insights, FullSession’s transparent pricing and comprehensive features make it a no-brainer at $39/month.
If you’re a technical team that needs to connect user frustration with actual bugs and performance issues, LogRocket’s AI-powered insights justify the higher price tag.
If you’re mobile-first, UXCam’s specialized focus beats trying to make a web-focused tool work for mobile analytics.
If you’re just starting out and need something that works right away, Mixpanel’s generous free tier gives you serious analytics power without the upfront investment.
If your team isn’t technical and you just want something that works without a PhD in data science, Hotjar remains the easiest entry point (just watch your site speed).
The analytics world is moving fast, with AI-powered insights becoming standard rather than premium features. Privacy compliance isn’t something you can ignore anymore – it’s a basic requirement that affects which platforms you can even consider.
Here’s the thing most people get wrong: the fanciest analytics tool becomes completely useless if your team can’t extract actionable insights from it. I’ve seen companies spend $50K annually on enterprise analytics platforms that gather dust because nobody knows how to use them effectively.
At The Marketing Agency, we’ve helped dozens of businesses navigate these analytics decisions and actually implement solutions that drive real results. Our approach focuses on connecting user behavior insights with your broader marketing strategy – from SEO optimization to conversion rate improvement.
We get that selecting analytics tools is just the starting line. The real value comes from turning user data into actionable improvements that grow your business. Whether you need help implementing session replay tools or building measurement frameworks that actually make sense, our team provides the strategic guidance to transform user data into measurable growth.
Ready to stop drowning in data and start making decisions that move the needle? Contact our team to discuss how we can help you implement and optimize your chosen analytics solution for maximum ROI.
