
I’ve noticed something interesting working with different companies – the ones who actually take time to set up their Google Analytics properly? They usually see about 15% better data accuracy across platforms, according to Vidi Corp’s Google Analytics case studies. It’s not glamorous work, but it makes a huge difference when you’re trying to make smart marketing decisions.

Table of Contents
-
Understanding Google Analytics Case Study Fundamentals
-
Google Data Analytics Capstone Project Methodology
-
Performance Measurement and ROI Optimization
-
Strategic Implementation for Marketing Agencies
-
Advanced Attribution and Multi-Touch Analysis
-
Final Thoughts
TL;DR
-
Google Analytics case studies turn website data into business strategies that actually work
-
Good case studies need clear problems, solid data collection, and methods that make sense
-
Capstone projects require serious planning, getting everyone on the same page, and thorough documentation
-
ROI optimization focuses on KPIs that matter, understanding your sales funnel, and testing what works
-
Advanced attribution shows how customers really behave across different devices and touchpoints
-
Real-time systems let you respond to insights immediately instead of waiting for monthly reports
Understanding Google Analytics Case Study Fundamentals
Look, I’ve been doing this for years, and I can tell you that most Google Analytics case studies I see are basically useless. They’re either too vague to act on or so buried in jargon that nobody wants to read them. The ones that actually move the needle? They follow a pretty straightforward approach that I wish someone had taught me when I started out.
Here’s the thing – building a case study that people actually use isn’t about showing off how smart you are. It’s about solving real problems that keep business owners up at night. I learned this the hard way after creating what I thought was a brilliant 50-page analysis that ended up collecting dust because I never bothered to ask what the client actually needed.

Building Your Case Study From Scratch (The Right Way)
I’m going to be brutally honest here – most people skip the boring foundation work and jump straight to the flashy charts. Don’t do this. I’ve watched too many promising projects fall apart because someone couldn’t be bothered to define what they were actually trying to solve.
Figuring Out What Problem You’re Actually Solving
Every case study I’ve ever done that led to real results started with one thing: a crystal-clear problem that someone desperately wanted fixed. Not “we need better analytics” – that’s not a problem, that’s just words. I’m talking about stuff like “our checkout abandonment rate is killing us” or “we’re spending a fortune on ads but can’t tell which ones work.”
I remember working with this e-commerce client who kept saying they needed “more data.” After three frustrating meetings, I finally got them to admit what was really bothering them: their mobile sales had dropped 30% in two months, and they had no idea why. Now THAT was something I could work with.
Your problem needs to be specific enough that you’ll know when you’ve solved it. Instead of “improve website performance,” try something like “reduce cart abandonment on mobile by 15% in the next 60 days.” See the difference? One gives you a target to hit, the other just gives you a headache.
Questions I always ask before starting:
-
What’s keeping you up at night about your website?
-
If you could fix one thing tomorrow, what would it be?
-
How will you know if this project was worth the time?
-
What happens if we don’t solve this?
Collecting Data That Actually Tells You Something
This is where a lot of people mess up, and I get it – data collection is about as exciting as watching paint dry. But here’s what I’ve learned: garbage data in means garbage insights out, and garbage insights make you look like an amateur.
I always start by checking if the tracking is even working properly. You’d be shocked how many times I’ve found Google Analytics wasn’t capturing half the conversions because someone forgot to add the tracking code to the thank-you page. Last year, I discovered a client had been making decisions based on data that was missing 40% of their mobile traffic. Oops.
The baseline period is crucial too. I need at least 30 days of solid data before I can say anything meaningful about trends. Less than that, and I’m basically guessing. More than 90 days, and I might be looking at outdated patterns that don’t reflect current reality. When you’re conducting comprehensive GA4 audits, this data collection becomes even more critical for identifying tracking gaps across your entire setup.
Here’s my reality check process: I compare Google Analytics numbers with whatever other data sources the client has. CRM, email platform, payment processor – whatever. If the numbers don’t line up reasonably well, something’s broken and needs fixing before I go any further.
|
What I Check |
Why It Matters |
Red Flags |
|---|---|---|
|
Goal tracking |
Are we measuring the right things? |
Goals firing on every page visit |
|
Traffic sources |
Is attribution working? |
90%+ direct traffic |
|
Mobile data |
Is mobile tracking properly? |
Suspiciously low mobile conversions |
|
Page load times |
Could speed be affecting data? |
Bounce rates over 80% |
Picking Methods That Won’t Waste Everyone’s Time
I used to overcomplicate this part – fancy statistical models, complex segmentation schemes, visualizations that looked impressive but confused everyone. Now I keep it simple: what’s the easiest way to answer the question that won’t require a PhD to understand?
Statistical significance matters, but I don’t need to write a dissertation about it. I just need to know if the patterns I’m seeing are real or if I’m looking at random noise. Usually, a basic confidence interval tells me what I need to know.
Segmentation is where the magic happens, though. Looking at all your traffic as one big blob rarely tells you anything useful. But break it down by device type, traffic source, or new vs. returning visitors? Now we’re getting somewhere. I once found that a client’s desktop users converted at 8%, but mobile users were only converting at 2%. That one insight led to a complete mobile redesign and a 40% revenue increase.
The key is picking visualization that makes your point obvious. If someone has to stare at your chart for more than 10 seconds to figure out what you’re trying to say, you’ve lost them.
Real Problems, Real Solutions
The case studies that actually get implemented are the ones that tackle genuine business headaches. I’ve found that e-commerce conversion problems and content marketing measurement are where you can make the biggest impact, probably because the results are so directly tied to money.
E-commerce: Where Every Percentage Point Counts
Online stores are brutal because every step of the buying process is a chance to lose a customer. But that also means every improvement you make has a direct impact on revenue, which makes it easier to show ROI.
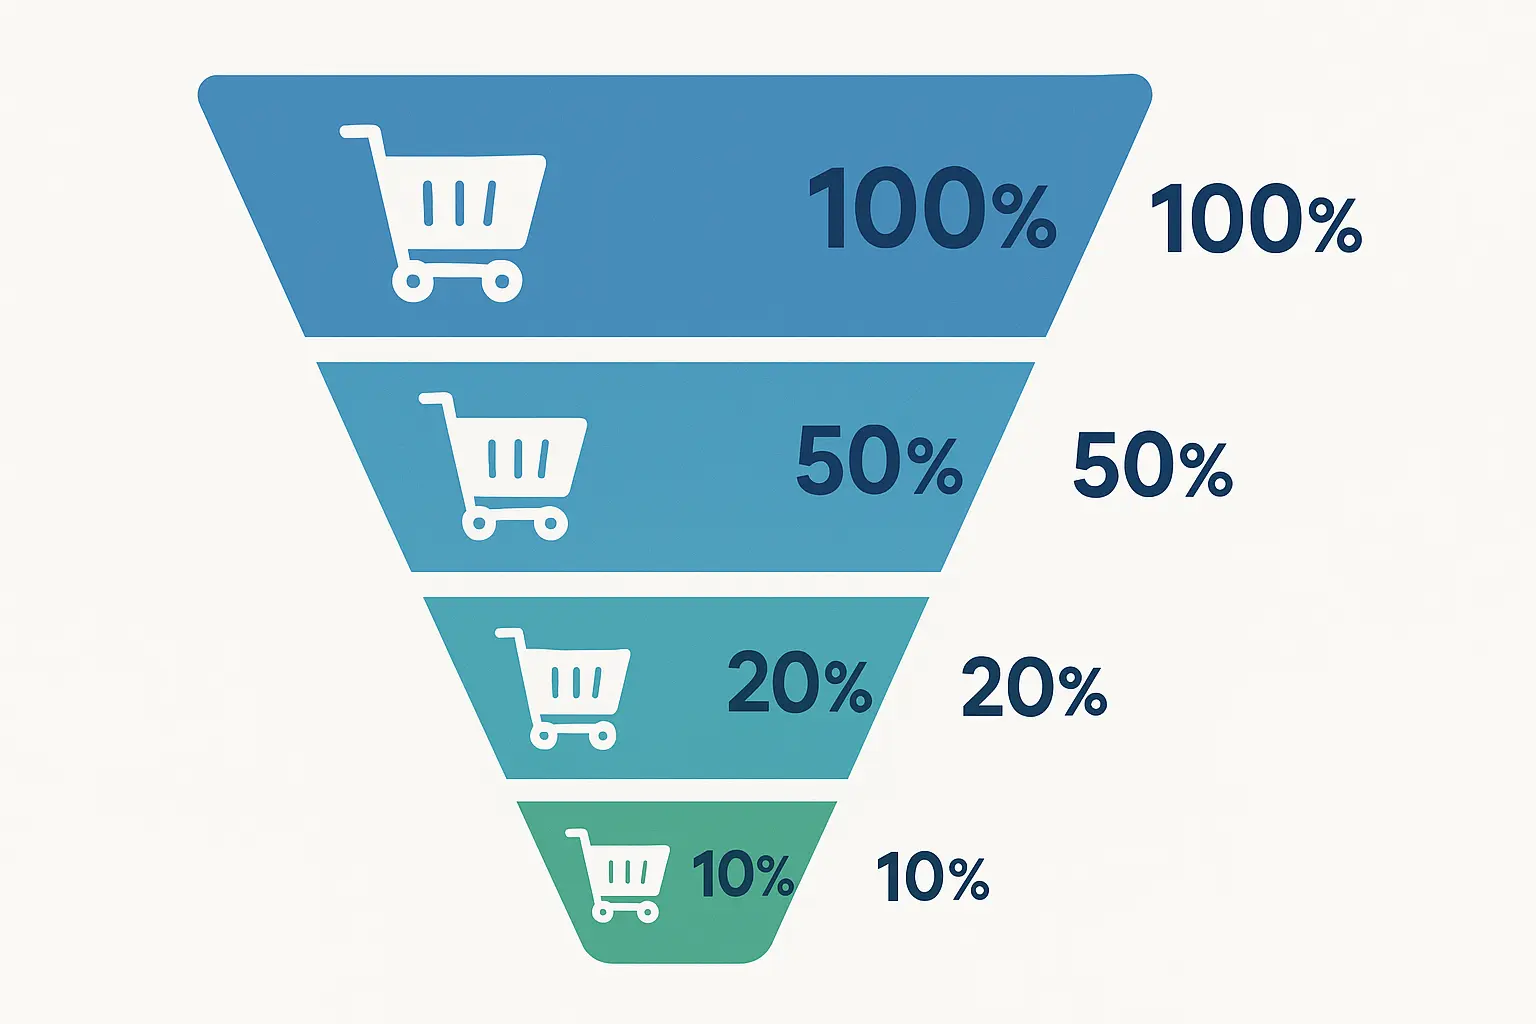
I always start with the conversion funnel because it shows you exactly where you’re bleeding money. Product page to cart, cart to checkout, checkout to purchase – each step tells a story. Usually, it’s not a happy story, but at least it’s actionable.
One client was losing 68% of mobile users right at the shipping information page. Turns out their mobile checkout form was a nightmare – tiny text boxes, required fields that weren’t marked, and a design that looked like it was built in 2010. We simplified it down to one page, and mobile conversions jumped 23% in two months. That single change generated an extra $47,000 monthly within 60 days.
The product performance data is gold too. Which products are your moneymakers? Which ones just take up space? I had a client who discovered that 80% of their profit was coming from just 12% of their products. That insight completely changed their inventory strategy and freed up $200,000 in working capital.
User behavior analysis reveals stuff you’d never guess. Heat maps show where people actually click (spoiler: not where you think they do). Scroll depth tells you if anyone’s reading your product descriptions. Click tracking reveals navigation patterns that might surprise you.
Content Marketing: Beyond Vanity Metrics
Content marketing measurement is tricky because the results aren’t always immediate or obvious. Someone might read your blog post today and buy something three months later. Good luck connecting those dots without proper tracking. This gets more strategic when you understand how to identify high-impact blog topics that actually drive conversions, not just traffic.
With mobile usage continuing to grow, “52% of users admit that bad mobile experience negatively impacts their brand perception” according to Netguru’s 2025 mobile analytics report. This really drives home why measuring content performance across all devices matters so much.
I focus on engagement metrics that actually correlate with business outcomes. Time on page is nice, but does it lead to conversions? Social shares feel good, but do they bring in customers? I track everything back to actual business results whenever possible.
The content attribution piece is where most people give up, but it’s also where the biggest insights hide. Which blog posts generate the most leads? What content types drive the highest-value customers? This data should be driving your editorial calendar, not just gut feelings about what might work.
I worked with a B2B company that was spending tons of time creating whitepapers because they assumed that’s what their audience wanted. Turns out, their simple how-to blog posts were generating 5x more qualified leads. They shifted their content strategy and saw a 60% increase in lead quality within six months.
Going Beyond Basic Reporting
The really valuable insights come from advanced features that most people never touch. Multi-channel attribution, custom dimensions, external data integration – this stuff separates the pros from the people just running standard reports.
Attribution: The Truth About Customer Journeys
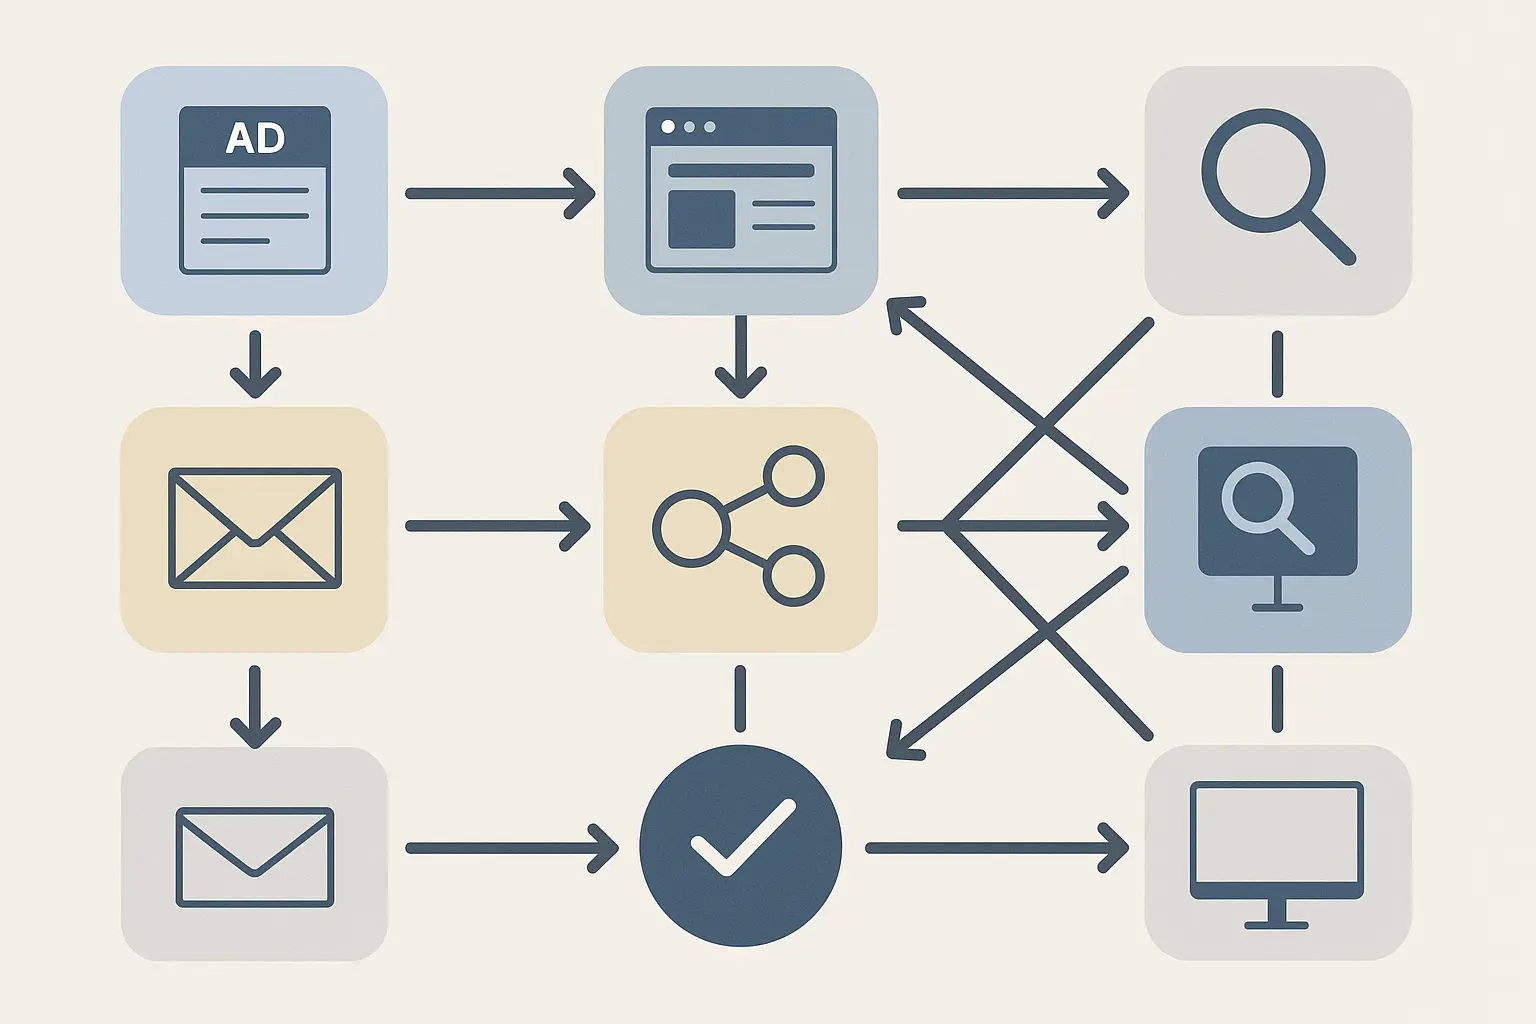
Here’s what I’ve learned about attribution: customers rarely follow the neat little paths we draw in our marketing plans. They bounce around between channels, devices, and touchpoints in ways that would make your head spin if you tried to map them all out.
First-click attribution shows what gets people in the door. This is great for understanding your awareness campaigns and top-of-funnel investments. But it completely ignores everything that happens between that first click and the final purchase.
Last-click attribution gets all the credit to whatever convinced someone to finally buy. Useful for understanding what closes deals, but it makes your awareness campaigns look worthless even when they’re doing the heavy lifting.
Time-decay and position-based models try to give credit where credit is due across the whole journey. They’re more realistic, but also more complicated to explain to clients who just want to know which ads are working.
I usually create custom attribution models based on how customers actually behave for that specific business. A B2B company with 6-month sales cycles needs different attribution than an e-commerce store where people buy impulsively.
Google Data Analytics Capstone Project Methodology
Capstone projects are where you prove you can handle the real deal – not just run reports, but actually solve business problems from start to finish. I’ve mentored dozens of people through these projects, and the ones who succeed all follow a similar pattern: they plan like crazy, execute step by step, and communicate like their career depends on it (because it does).
“Google boasts 150 hiring partners for their data analytics track” according to KDNuggets’ 2023 certification review. This growing industry recognition makes capstone projects even more valuable for your career.
Planning That Actually Works
Most capstone projects fail during planning, not execution. People get excited about the analysis part and rush through the foundation work. Big mistake. I’ve seen brilliant analysts create amazing insights that nobody used because they never bothered to understand what the business actually needed.
Understanding What People Really Want
Stakeholder interviews are where you separate the real problems from the surface complaints. When someone says “we need more traffic,” what they usually mean is “we need more customers” or “we need better leads.” Getting to the real issue takes some digging.
I always ask about their current decision-making process. How do they decide where to spend marketing dollars? What metrics do they look at? What keeps them up at night? The answers tell me what kind of analysis will actually get used.
Business context matters more than you think. Are they in a competitive market? Growing or declining industry? Seasonal business? These factors affect what insights are actionable and what recommendations make sense.
Success criteria need to be nailed down upfront, not after you’ve done all the work. I learned this lesson when a client moved the goalposts on me three times during a project. Now I get specific metrics and timelines in writing before I start.
Timelines That Don’t Fall Apart
Resource allocation is always trickier than you expect. Data collection takes longer than planned. Analysis reveals unexpected complexities. Stakeholders need more revision cycles than anticipated. I always add 25% to my initial time estimates, and I’m still sometimes cutting it close. Understanding advanced analytics for strategic growth helps you estimate these timelines more accurately.
Data collection periods need to account for business reality. Analyzing summer traffic patterns won’t help with holiday planning. Looking at weekday behavior might miss weekend trends that matter for your business.
Quality standards can’t be compromised for speed. I’d rather deliver fewer insights that drive action than comprehensive analysis that lacks credibility. Your reputation depends on getting it right, not getting it done fast.
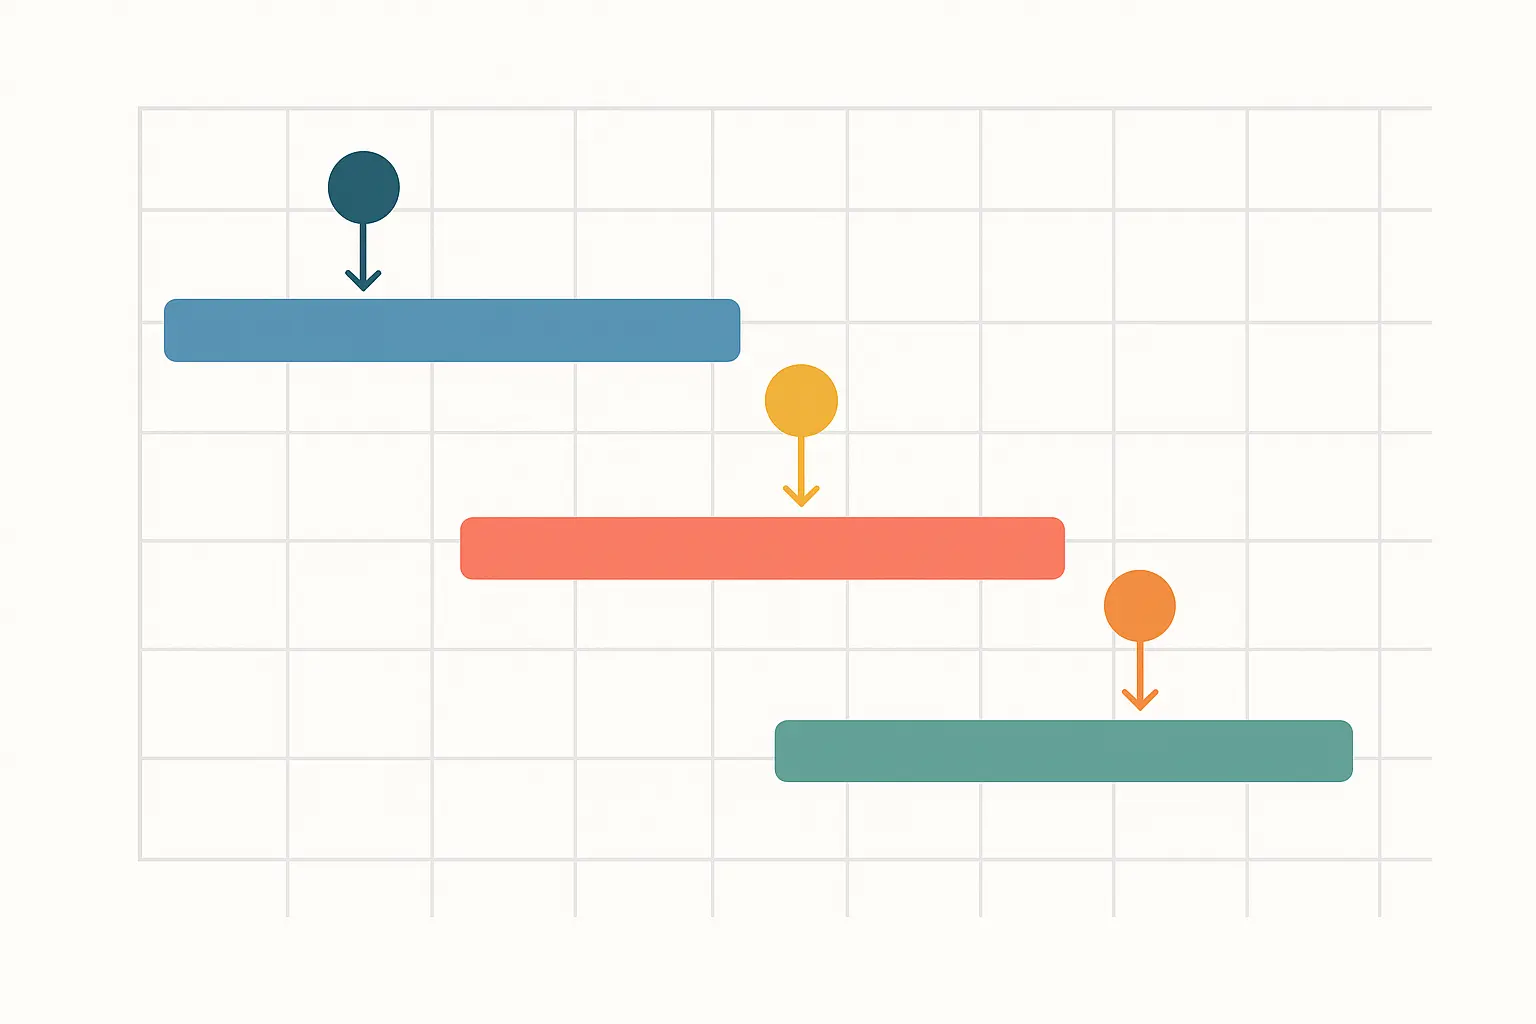
My Standard Timeline:
-
Weeks 1-2: Stakeholder interviews and requirement definition
-
Weeks 3-4: Data collection setup and validation
-
Weeks 5-8: Analysis and findings development
-
Weeks 9-10: Visualization and report creation
-
Weeks 11-12: Review cycles and final recommendations
Data Quality: The Foundation Everything Else Depends On
I can’t stress this enough – your analysis is only as good as your data. I’ve seen people create elaborate models and sophisticated visualizations based on garbage data, then wonder why their recommendations didn’t work. Don’t be that person.
Validation Before You Do Anything Else
Data validation is boring, tedious work that nobody wants to do. It’s also the difference between insights that drive business growth and analysis that damages your credibility. I check everything twice because finding problems after you’ve presented results is career-limiting.
Tracking accuracy verification is step one. Are goals firing correctly? Are filters excluding important data? Is the tracking code on every page it should be? I’ve found missing tracking codes, broken goal setups, and filter configurations that were excluding half the mobile traffic.
Cross-platform validation catches discrepancies that could invalidate your entire analysis. Google Analytics should roughly align with your CRM, email platform, and ad dashboards. Perfect alignment isn’t expected, but major discrepancies need investigation.
I once discovered a 40% gap between Google Analytics conversion data and a client’s CRM. Turned out their trial signup confirmation page was missing the tracking code. Fixing that revealed their actual conversion rate was 2.3% higher than they thought, which completely changed their marketing budget allocation.
Communication That Gets Results
The most sophisticated analysis becomes worthless if you can’t explain it in terms that drive action. I’ve learned that technical brilliance means nothing if stakeholders can’t understand what you’re recommending or why they should care.
Executive Summaries That Actually Get Read
Executives don’t have time for 50-page reports. They need the key insights and recommended actions in language that makes immediate sense. I lead with business impact, not methodology details.
Key findings should jump off the page. The most important insights go first, with supporting details available for people who want to dig deeper. Business impact gets quantified whenever possible – revenue estimates, cost savings, efficiency improvements.
Recommended actions need to be specific and actionable. “Improve website performance” tells them nothing. “Implement exit-intent popups on product pages to reduce cart abandonment by an estimated 12%” gives them something they can actually do.
Implementation timelines set realistic expectations. Some recommendations can be implemented immediately, others might require months of development work. Being upfront about this prevents disappointment and helps with prioritization.
Documentation That Protects You Later
Technical documentation isn’t just good practice – it’s career insurance. Six months after project completion, someone will ask how you calculated something or want to update your analysis with fresh data. If you can’t reproduce your work, you look unprofessional.
Methodology documentation should be detailed enough for replication. Data sources, analysis techniques, assumptions, and limitations all need to be clearly stated. I maintain detailed logs of data extraction dates, filters applied, and any data cleaning procedures.
Assumption documentation acknowledges analysis limitations. Every analysis involves assumptions about data quality, user behavior, or business context. Being explicit about these shows professional maturity and prevents unrealistic expectations.
Dashboards That People Actually Use
Interactive dashboards encourage ongoing engagement with your insights. But dashboard design is trickier than most people realize – too much information overwhelms users, too little leaves them wanting more.
The most important metrics should be immediately visible, with drill-down capabilities for users who want more detail. Interactive elements like filters and date ranges help users answer their own questions without requesting custom reports.
Mobile optimization ensures accessibility. Decision-makers often need to check performance metrics while traveling or in meetings where laptops aren’t practical. If your dashboard doesn’t work on mobile, it probably won’t get used.

Performance Measurement and ROI Optimization
This is where the rubber meets the road – proving that your analytics insights actually drive business results. I’ve learned that developing the right KPIs and optimizing conversion funnels step by step makes the difference between analysis that impresses people and analysis that makes money.
KPIs That Actually Drive Decisions
The biggest mistake I see people make is measuring everything instead of measuring what matters. Vanity metrics feel good but don’t drive business decisions. Revenue-focused metrics might be less exciting, but they’re what executives care about.
Connecting Metrics to Real Business Goals
KPI development has to start with business strategy, not available data. What are the company’s actual goals? Revenue growth? Market share expansion? Customer retention? Your metrics need to directly connect to these objectives. This becomes more strategic when you understand how to properly measure marketing ROI across different channels and customer segments.
Revenue-focused metrics provide the clearest business value. Revenue per visitor, average order value, and customer lifetime value directly tie your analysis to bottom-line results. When you can show that your recommendations increased revenue by $50,000 per month, you get attention.
Efficiency metrics help optimize marketing spend. Cost per acquisition, return on ad spend, and conversion rate improvements demonstrate how analytics insights improve marketing ROI. Leading indicators predict future performance before it shows up in revenue numbers.
I worked with a SaaS company that was obsessing over website traffic growth. Traffic was up 40%, but revenue was flat. Digging deeper, we found that traffic quality had declined – they were attracting more visitors, but fewer qualified prospects. Shifting focus to lead quality metrics led to a 60% increase in trial-to-paid conversions within three months.
|
What I Measure |
Why It Matters |
What It Tells You |
|---|---|---|
|
Revenue per visitor |
Direct business impact |
Are improvements actually making money? |
|
Customer lifetime value |
Long-term profitability |
Which acquisition channels bring valuable customers? |
|
Cost per acquisition |
Marketing efficiency |
Where should we spend more/less? |
|
Conversion rate by segment |
Optimization opportunities |
Which user groups need attention? |
Conversion Funnel Optimization That Works
Funnel analysis reveals where you’re losing potential customers and why. But most people just look at the aggregate numbers and miss the real insights that come from segmentation and testing things properly.
Understanding Where Customers Really Drop Off
Funnel visualization should highlight your biggest opportunities, not just show you pretty charts. I focus on steps with the highest drop-off rates or the greatest potential impact on overall conversion rates.
Multi-device journey mapping reveals how customers move between touchpoints. Understanding cross-device behavior helps optimize the entire customer experience, not just individual pages. Some customers research on mobile but convert on desktop. Others browse on desktop but complete purchases on mobile.
Time-based analysis shows how conversion patterns change. Some customers convert immediately, others require weeks of consideration. This data informs nurturing strategies and attribution models. B2B buyers often need multiple touchpoints over months before converting, while impulse buyers might decide in minutes.
Segment-specific funnels reveal different user behavior patterns that require tailored approaches. New vs. returning visitors behave completely differently. Mobile users have different pain points than desktop users. Organic traffic converts differently than paid traffic.
I discovered this working with an e-commerce client who was frustrated with their overall 2.1% conversion rate. When we broke it down by segment, returning customers were converting at 8.7%, but new visitors were only hitting 0.9%. That insight led to a complete onboarding strategy overhaul that doubled new visitor conversions within two months.
Testing That Actually Proves Something
A/B testing sounds simple until you try to do it right. Proper sample sizes, statistical significance, randomization – there’s a lot that can go wrong. I’ve seen people make major business decisions based on tests that weren’t statistically valid.
Test design determines whether your results mean anything. Sample size calculations prevent you from drawing conclusions from insufficient data. Randomization procedures ensure you’re comparing apples to apples. Statistical significance thresholds help you distinguish real improvements from random noise.
Hypothesis formation guides test development and prevents fishing expeditions. I always start with a clear prediction about expected outcomes. “The new checkout flow will increase conversions by at least 15%” gives you something specific to validate or refute.
Implementation planning ensures successful tests translate into business improvements. Having rollout procedures, monitoring systems, and rollback plans ready prevents good insights from being wasted due to poor execution.
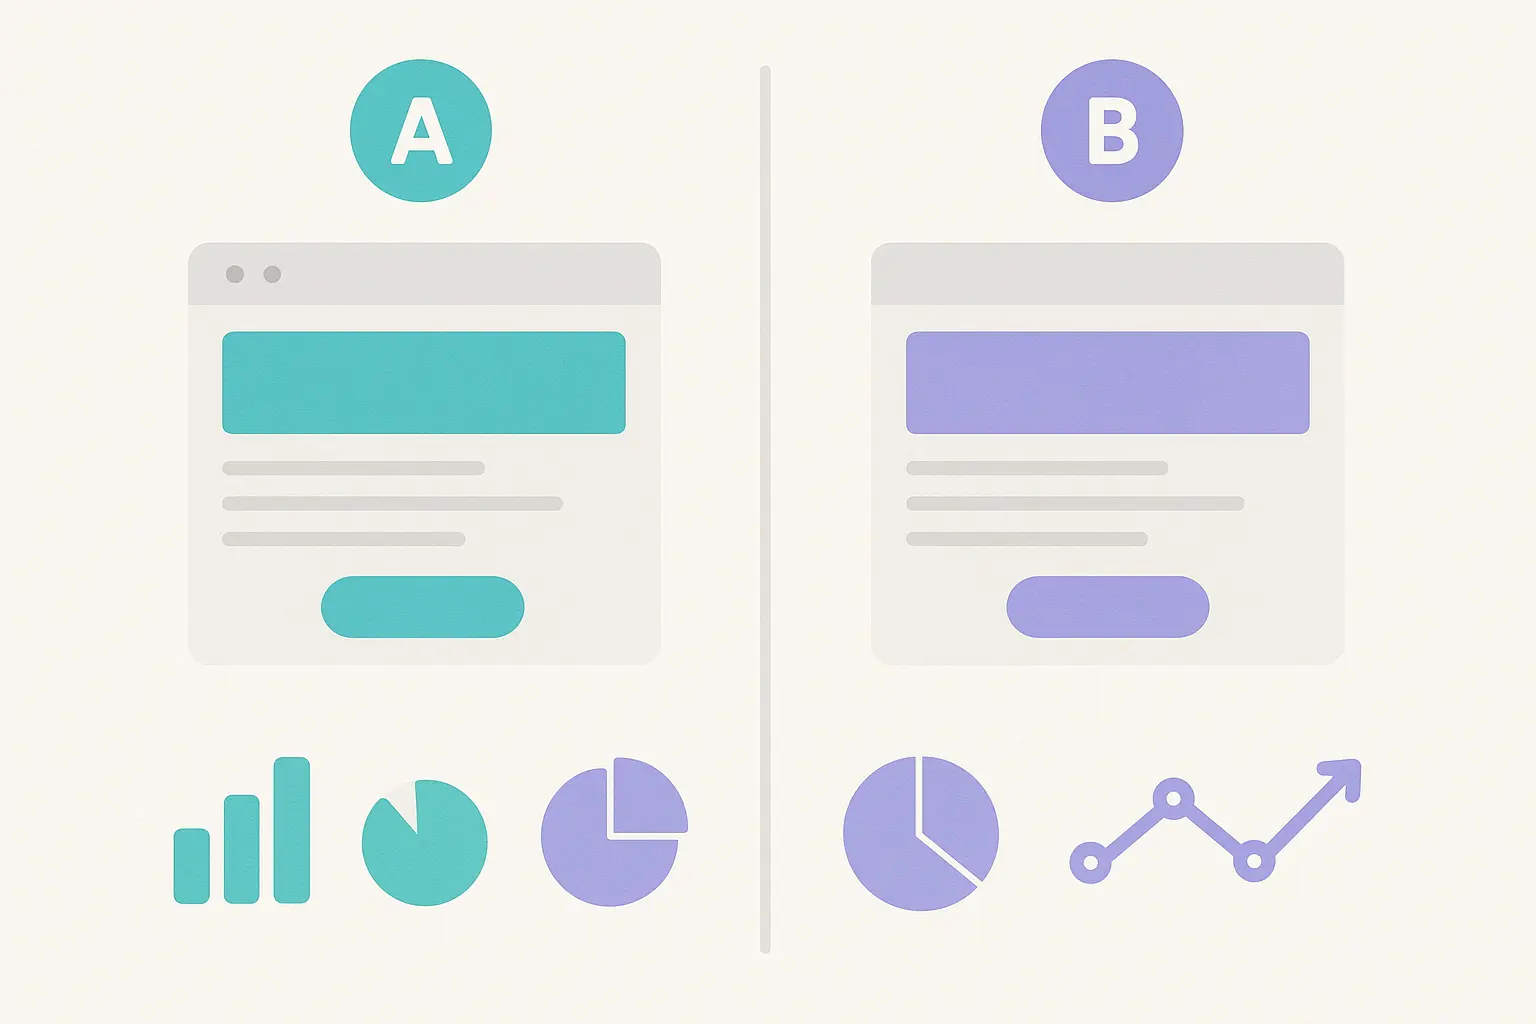
A B2B software company I worked with wanted to test their pricing page. Instead of just randomly trying different layouts, we hypothesized that highlighting the middle-tier plan would increase conversions by making the decision easier. After testing with 15,000 visitors over 6 weeks, we saw a 28% increase in conversions. That single change generated an additional $89,000 in monthly recurring revenue.
Strategic Implementation for Marketing Agencies
Agencies have a unique challenge – they need to demonstrate value to clients while managing multiple accounts with different goals, budgets, and success metrics. Case studies become powerful tools for client retention, new business development, and service differentiation.
Proving Value That Clients Can’t Argue With
The agencies that thrive are the ones that can clearly demonstrate ROI and connect their work to business outcomes. Clients don’t care how sophisticated your analysis is – they care whether you’re helping them make more money or save money.
ROI Calculations That Tell the Whole Story
ROI calculation gets tricky when you’re dealing with multiple marketing channels, different attribution models, and varying customer lifecycles. But clients need to understand which investments are paying off and which ones aren’t. Understanding how to properly measure return on ad spend across different platforms becomes crucial for providing complete performance visibility.
Attribution models can show dramatically different results for the same campaigns. First-touch attribution makes awareness campaigns look great but undervalues conversion-focused efforts. Last-touch attribution does the opposite. Multi-touch attribution is more realistic but harder to explain to clients who want simple answers.
Time-based ROI calculations reveal how returns develop over different time horizons. Some marketing investments show immediate returns, while others build value over months or years. Content marketing often falls into this second category – the blog post you publish today might not generate leads until next quarter.
Channel-specific ROI analysis helps optimize budget allocation across different marketing activities. Understanding which channels deliver the highest returns enables more strategic marketing investments. But you also need to consider how channels work together, not just in isolation.
I worked with an agency managing a client’s complete digital marketing stack. When we looked at last-click attribution, Google Ads was getting all the credit. But multi-touch analysis revealed that LinkedIn ads were generating the initial awareness that made those Google Ads conversions possible. Without that insight, they would have cut LinkedIn spend and killed their top-of-funnel pipeline.
For agencies managing diverse client portfolios, having consistent ROI calculation approaches becomes essential. Whether you’re running $500/month PPC campaigns or $10,000/month comprehensive programs, you need reliable ways to measure and communicate value.
Advanced Attribution and Multi-Touch Analysis
Modern customers don’t follow simple paths from awareness to purchase. They research on mobile, compare options on desktop, ask friends on social media, and might convert weeks later on a completely different device. Understanding these complex journeys requires sophisticated tracking and analysis.
Cross-Device Tracking That Actually Works
User ID implementation connects user sessions across devices, but it requires careful planning and privacy compliance. You need a system that assigns unique identifiers while respecting data protection regulations and user preferences.
Getting Complete Journey Visibility
According to Vidi Corp’s analytics consulting services, proper server-side tracking implementation increases tracking accuracy by an average of 15% per platform when implemented across multiple marketing channels including GA4, Google Ads, Meta, TikTok, Pinterest, and Snapchat.
Cross-device reporting reveals behavior patterns that completely change how you think about marketing. I discovered that many B2B customers research on mobile during commutes but convert on desktop during work hours. This insight changed how we scheduled campaigns and allocated budgets between device types.
Session stitching connects previously fragmented user journeys. What looked like three separate users might actually be one customer using different devices at different times. This dramatically affects your understanding of conversion rates, customer value, and campaign performance.
Data accuracy improves dramatically with proper User ID setup. Instead of inflated user counts and deflated conversion rates, you get realistic metrics that reflect actual customer behavior.
Enhanced E-commerce Tracking for Revenue Attribution
Advanced e-commerce tracking captures detailed product performance data that goes way beyond basic revenue numbers. Which products have the highest conversion rates? Which ones attract the most valuable customers? Which generate the most repeat purchases?
Shopping behavior tracking reveals optimization opportunities throughout the purchase process. Cart abandonment patterns show where you’re losing customers. Product comparison behavior indicates what information customers need to make decisions. Checkout process analysis identifies friction points that kill conversions.
Revenue attribution across channels shows the complete picture of what drives sales. Content marketing might not get credit in last-click attribution, but enhanced tracking can reveal its true impact on customer acquisition and lifetime value.
Customer segment analysis becomes possible with detailed transaction data. High-value customers often behave completely differently than bargain hunters, requiring different marketing approaches and optimization strategies.
Custom Dimensions for Business-Specific Insights
Custom dimensions capture data points that matter to your specific business but aren’t available in standard Google Analytics. Customer type, product category, subscription tier, lead source – whatever makes your business unique.
Implementation requires coordination with your development team, but the analysis possibilities expand dramatically. You can segment users by subscription tier, analyze behavior by customer lifecycle stage, or compare performance across different product lines.
Reporting becomes more relevant to your actual business instead of generic website analytics. Instead of knowing that conversion rates are 3.2%, you know that premium customers convert at 8.1% while basic customers convert at 1.7%. That insight drives completely different optimization strategies.
Predictive Analytics for Future Performance
Machine learning techniques identify customer segments based on actual behavior patterns, not demographic assumptions. Behavioral clustering reveals natural customer groups that respond to different messaging, offers, and user experiences.
Audience Segmentation Through Machine Learning
Behavioral clustering reveals natural customer segments that you’d never discover through traditional demographic analysis. Instead of assuming that all 25-34 year olds behave the same way, you discover how customers actually interact with your website and what drives their decisions.
Predictive scoring identifies high-value prospects before they convert. Which website visitors are most likely to become customers? What early behaviors indicate someone will make repeat purchases? Machine learning algorithms
Predictive scoring identifies high-value prospects before they convert. Which website visitors are most likely to become customers? What early behaviors indicate someone will make repeat purchases? Machine learning algorithms can answer these questions with surprising accuracy.
Personalization opportunities emerge from segment analysis. Different customer types respond to different messaging, offers, and user experiences. Segmentation data enables more effective personalization strategies that actually work.
Marketing automation becomes more sophisticated with behavioral segments. Instead of one-size-fits-all email campaigns, you can create targeted sequences based on actual user behavior patterns.
Lifetime Value Prediction Models
Customer lifetime value prediction based on early engagement indicators allows for more strategic acquisition spending. You can afford to spend more acquiring customers with higher predicted lifetime values while reducing spend on segments likely to churn quickly.
Research from GA4 Experts case studies shows that businesses implementing comprehensive tracking setups can reduce implementation time from 8-10 hours to 2-5 hours per website through standardized GTM templates, significantly improving efficiency for agencies managing multiple client properties.
Early indicator identification helps optimize onboarding processes and initial customer experiences. Which actions in the first week predict long-term customer value? This data helps you design better new customer experiences.
Retention program targeting improves with LTV predictions. Focus retention efforts on customers with high predicted value who show early churn signals, rather than trying to save everyone equally.
Budget allocation becomes more scientific when you can invest proportionally to predicted returns rather than spreading marketing spend equally across all customer segments.
Real-Time Decision Making That Works
Real-time alerting systems notify stakeholders when key metrics deviate from expected ranges, enabling rapid response to both opportunities and problems before they significantly impact business performance.
Alert Systems That Don’t Drive You Crazy
Alert threshold setting requires balancing sensitivity with practicality. Too many alerts create noise that people ignore. Too few alerts miss important changes. I typically start conservative and adjust based on actual business impact.
Escalation procedures ensure the right people get notified at the right time. A 10% traffic drop might warrant an email to the marketing team, while a 50% conversion rate drop needs immediate executive attention.
Response protocols should be documented in advance. When alerts fire, team members need clear procedures for investigation and response rather than scrambling to figure out what to do.
False positive management keeps alert systems useful over time. Regular review and adjustment of alert thresholds prevents alert fatigue and ensures notifications remain actionable.
The Marketing Agency leverages these advanced analytics capabilities to provide clients with sophisticated measurement and optimization services that go far beyond basic reporting. Whether you’re investing $500 per month in targeted PPC campaigns or $10,000 monthly in comprehensive inbound marketing programs, these advanced attribution models and real-time decision-making approaches ensure every dollar delivers measurable results. Our data-driven approach transforms marketing from guesswork into predictable growth engines that thrive on continuous optimization and scientific validation.
Ready to transform your marketing data into actionable growth strategies? Contact The Marketing Agency today to discover how our advanced analytics expertise can optimize your marketing investments and drive measurable business results.
Final Thoughts
After years of building Google Analytics case studies, I’ve learned that the technical stuff is actually the easy part. The hard part is asking the right questions, understanding what businesses really need, and translating complex data into recommendations that people actually implement.
The methodology matters more than the tools. Without proper problem definition, step-by-step data collection, and rigorous validation, even the most sophisticated analysis becomes worthless. I’ve seen brilliant analysts produce meaningless results because they skipped fundamental steps like understanding what stakeholders actually wanted or validating data quality.
Advanced attribution modeling and predictive analytics aren’t just impressive technical capabilities – they’re essential for understanding how modern customers actually behave. Cross-device journeys, multi-touch attribution, and real-time decision-making separate professional-grade analysis from amateur reporting.
But here’s what I wish someone had told me when I started: your case study’s ultimate value lies in its ability to drive business action. The most elegant analysis that sits unused provides zero business value. Focus on creating insights that stakeholders can understand, trust, and implement immediately.
Your reputation as an analyst depends not on the complexity of your methods, but on the measurable business improvements that result from your recommendations. Keep that in mind, and you’ll build case studies that actually matter.
