
Look, I’ve been in the YouTube game long enough to know that most creators get starry-eyed about revenue calculators without understanding what they’re actually looking at. You punch in your view count, see some promising numbers, and suddenly you’re planning your exit from the 9-to-5. But here’s the thing – these tools are only as good as your understanding of what makes YouTube money actually work.
I remember when I first discovered revenue calculators. Plugged in my 10K monthly views, saw a projection of $200-400, and thought I was basically set. Reality check came fast when my first payment was $23. Turns out, most of my audience was teenagers from countries where advertisers pay almost nothing. That’s when I learned that not all views are created equal.
Table of Contents
-
What These Calculators Actually Tell You (And What They Don’t)
-
Advanced Calculator Features That Actually Matter (Skip the Marketing Fluff)
-
Strategic Implementation: Using Calculators Without Losing Your Mind
-
The Multi-Revenue Stream Reality
-
Final Reality Check
TL;DR
-
YouTube revenue calculators are useful for ballpark estimates, but don’t bet your life savings on their projections
-
Your audience’s location matters more than view count – Tier 1 countries can generate 5x higher earnings than developing markets
-
The decent calculators use real data and machine learning instead of basic multiplication, but they still can’t predict platform changes
-
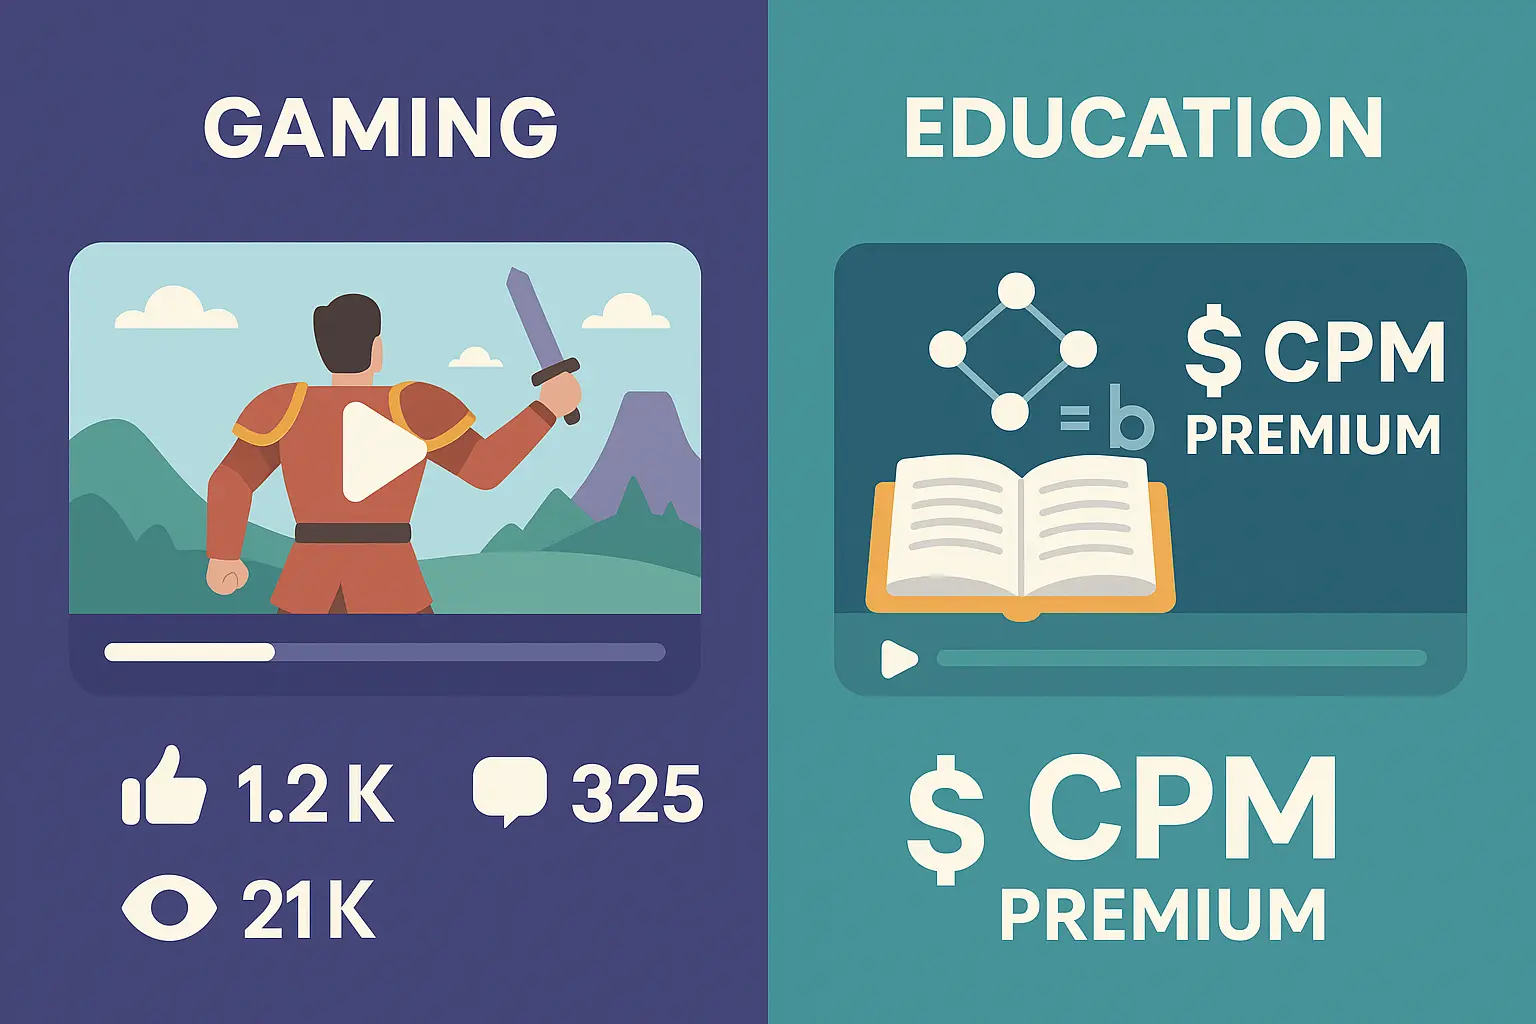
Different content types have wildly different earning potential – finance content can earn 10x more per view than gaming
-
Smart creators diversify beyond ad revenue through sponsorships, memberships, and merchandise – ad revenue should be your smallest slice
-
Whatever the calculator tells you, cut it in half, then cut it in half again – that’s your realistic expectation
-
Don’t quit your day job until you’re consistently earning 3x what calculators promise for at least six months
What These Calculators Actually Tell You (And What They Don’t)
YouTube revenue calculators have gotten way smarter than the basic “multiply views by CPM” tools from five years ago. The decent ones actually dig into your specific situation instead of throwing generic industry averages at you. But even the best calculator can’t predict when YouTube decides to mess with the algorithm or when the next economic downturn kills ad spending.
These aren’t crystal balls – they’re strategic planning tools that work best when you understand their limitations. I’ve watched too many creators make major life decisions based on optimistic projections that ignored the messy realities of YouTube monetization.
According to LiveReacting’s YouTube Money Calculator, typical CPM ranges fall between $2.00 – $4.00, but here’s what they don’t tell you – that’s assuming you have a decent audience from countries where advertisers actually spend money.
The Core Metrics That Actually Matter (Beyond View Count)
Most creators obsess over view counts, but that’s like judging a restaurant by how many people walk past it. What matters is who’s actually watching, where they’re from, and whether they stick around long enough to see ads.
View counts are just the starting point. I’ve seen channels with identical monthly views where one makes $500 and the other makes $2,000. The difference comes down to audience quality, geographic distribution, and engagement patterns that basic calculators completely miss.
Monthly consistency beats viral spikes every time when it comes to revenue planning. A channel pulling 50K views monthly will generate more predictable income than one with sporadic viral hits. Calculators work best when you feed them realistic monthly averages, not your best month ever.

View Count Reality Check: Quality Over Quantity
Here’s the brutal truth – not all views are created equal. A thousand views from suburban Americans aged 25-54 can generate more revenue than 10,000 views from teenagers in developing countries. This geographic reality completely changes how you should interpret calculator results.
I learned this lesson the hard way when my gaming content went viral in Southeast Asia. My view count tripled, but my revenue actually dropped because the new audience wasn’t valuable to advertisers. The calculator projections looked amazing until the payments started rolling in.
Total view counts help calculators understand your growth trajectory, but they’re meaningless without context about who’s actually watching. Smart creators focus on building audiences in high-value demographics rather than chasing vanity metrics.
RPM and CPM: The Numbers That Actually Pay Your Bills
RPM (what you actually receive) and CPM (what advertisers pay) represent the real money in your revenue calculations. YouTube takes their 45% cut from CPM to give you RPM, but even understanding this split doesn’t prepare you for how wildly these numbers fluctuate.
Your RPM depends on factors most creators never think about – ad blocker usage in your audience, seasonal advertising cycles, and even the specific topics you cover. I’ve seen my RPM swing from $1.50 to $6.00 on similar content just because of timing and audience behavior.
Social Blade uses an accepted RPM range formula of $0.25 USD – $4.00 USD, but here’s the reality – if you’re consistently hitting the high end of that range, you’re doing something very right with your audience targeting.
Geographic audience mix can make or break your RPM. US viewers might generate $4-8 CPM while viewers from developing countries produce $0.20-1.00 CPM. A channel that’s 80% Tier 1 countries will dramatically outperform one with global reach, even with fewer total views.
Engagement: The Hidden Revenue Multiplier
Engagement metrics like watch time and click-through rates don’t just make you feel good – they directly impact your earning potential through YouTube’s algorithm. Higher engagement means better ad placement, more impressions, and access to premium advertisers who pay top dollar.
Click-through rates on your thumbnails determine how many people actually watch when your content appears in recommendations. A 2% CTR versus 8% CTR can literally make the difference between $100 and $500 monthly earnings on identical content.
Watch time percentage affects ad placement opportunities. Videos with 60%+ retention can support multiple ad breaks without losing viewers, while low-retention content struggles to monetize effectively. This is why longer isn’t always better – a 6-minute video with great retention beats a 12-minute video people abandon.
Revenue Stream Integration: Why Ad Revenue Isn’t Enough
Modern YouTube monetization goes way beyond ad revenue, and the best calculators reflect this reality. Creators who diversify their income streams often earn 3-5x more than those relying solely on YouTube’s ad sharing program.
I’ve watched creators stress about algorithm changes affecting their ad revenue while completely ignoring sponsorship opportunities that could double their income. Smart revenue planning requires looking beyond YouTube’s built-in monetization features.
|
Revenue Stream |
What You Can Realistically Expect |
Requirements |
Income Stability |
|---|---|---|---|
|
Ad Revenue |
$0.25-$4.00 per 1,000 views |
1,000+ subscribers, 4,000 watch hours |
Unpredictable, algorithm-dependent |
|
Channel Memberships |
$2.99-$24.99 per member/month |
1,000+ subscribers, loyal audience |
High, recurring income |
|
Super Chat/Thanks |
$1-$500 per donation |
Live streaming capability |
Low, event-dependent |
|
Sponsorships |
$1-$5 per 1,000 views |
10,000+ subscribers typically |
Medium, relationship-based |
|
Merchandise |
40-60% profit margins |
Engaged audience, design skills |
Medium, seasonal ups and downs |
|
Affiliate Marketing |
3-50% commission rates |
Audience trust, relevant products |
Medium, product-dependent |
Ad Revenue: Your Baseline (Not Your Ceiling)
YouTube’s ad revenue split gives you 55% of what advertisers pay, but don’t get too excited about that percentage. After factoring in ad blocker usage, viewer behavior, and geographic distribution, your actual take-home is often much lower than calculator projections suggest.
Different ad formats contribute differently to your bottom line. Pre-roll ads are standard, but mid-roll ads in longer videos often generate the highest revenue per impression. The trick is placing them at natural breaks where viewers won’t immediately click away.
Here’s a reality check from my own channel: 75,000 monthly views from primarily US audiences with a $2.80 CPM should generate about $115 monthly ($2.80 × 75 × 0.55 YouTube share). But after accounting for ad blockers and viewer behavior, actual earnings typically land around $85-95 monthly.
Channel Memberships: The Recurring Revenue Dream
Channel memberships convert 1-5% of your subscriber base if you’re doing everything right. Educational and niche content often sees higher conversion rates than general entertainment because viewers perceive more value in supporting specialized knowledge.
The beauty of membership revenue is predictability. While ad revenue fluctuates with algorithm changes and seasonal patterns, membership income stays relatively stable month to month. This stability becomes incredibly valuable for business planning and stress management.
Membership pricing strategy matters more than most creators realize. Offering multiple tiers can increase overall revenue while accommodating different supporter budgets. A $2.99 basic tier with a $9.99 premium option often outperforms a single $4.99 tier.

Geographic Reality: Where Your Audience Lives Determines Your Income
Your audience’s location impacts your earning potential more than any other single factor. I’ve analyzed channels with identical subscriber counts where geographic differences created 300% revenue variations. This isn’t just about rich versus poor countries – it’s about advertiser competition and local purchasing power.
Recent data from DemandSage’s YouTube earnings analysis reveals that small YouTubers typically earn $50-$100 monthly initially, but these averages hide massive geographic variations that can make or break your revenue expectations.
The Tier 1 Country Advantage
US, UK, Canada, and Australia represent the holy grail for YouTube monetization. These markets generate $2-8 CPM rates while developing countries might only produce $0.20-1.00 CPM for identical content. The difference isn’t subtle – it’s life-changing for creators trying to make a living.
Advertiser competition in developed markets drives up CPM rates significantly. Companies targeting English-speaking, high-income audiences pay premium rates because they know these viewers have money to spend on their products and services.
My friend Sarah runs a cooking channel with 45,000 subscribers. When her audience was 85% from Tier 1 countries, she was making $600-800 monthly. Then she went viral in several developing countries, her subscriber count doubled, but her revenue dropped to $400 because the new viewers weren’t valuable to advertisers.
Seasonal Patterns You Need to Know
Q4 (October-December) is Christmas for YouTube creators. Ad spending increases 20-40% because retailers and e-commerce companies throw money at the platform to capture holiday shoppers. Your December earnings might be your highest of the year, even with similar view counts.
Summer advertising slowdowns hit most creators hard. Many businesses reduce marketing spend during vacation periods, leading to 20-30% revenue drops even when view counts stay consistent. Planning for these predictable dips prevents panic and poor decision-making.
Back-to-school periods create mini-spikes in certain niches, particularly educational content and tech reviews. Understanding your niche’s seasonal patterns helps set realistic monthly expectations instead of assuming linear growth.
According to Views4You’s analysis, CPM represents what advertisers pay for each 1,000 ad views, but seasonal fluctuations can swing these rates by 50% or more depending on timing and market conditions.
Advanced Calculator Features That Actually Matter (Skip the Marketing Fluff)
The latest generation of YouTube revenue calculators uses machine learning and real-time data integration to provide more accurate projections than basic multiplication formulas. But don’t get too excited – even the smartest calculator can’t predict platform changes, economic downturns, or viral content that completely changes your audience demographics.
Most “advanced” features are just fancy ways to present the same basic math. But there are a few innovations worth paying attention to if you’re serious about using these tools for business planning.

Machine Learning Integration: Smarter Predictions (With Limitations)
AI-powered calculators analyze thousands of channel datasets to identify revenue patterns that manual analysis might miss. These systems can recognize correlations between engagement metrics and earnings that simple formulas completely overlook.
The machine learning approach works well for identifying optimization opportunities within your current performance range. If similar channels in your niche see higher revenue per view, these tools can suggest specific areas for improvement.
But here’s the limitation nobody talks about – these systems are trained on historical data that may not reflect current market conditions. A calculator trained on 2019-2021 data might not account for post-pandemic changes in viewer behavior and advertiser spending.
Real-Time Data Sync: Using Your Actual Numbers
Calculators that connect directly to your YouTube Analytics eliminate the biggest source of projection errors – creators lying to themselves about their metrics. Instead of guessing at engagement rates or audience demographics, these tools use your real performance data.
This integration provides continuously updated projections that adjust as your channel evolves. Instead of static estimates based on outdated inputs, you get dynamic forecasts that reflect your current trajectory.
The downside? These tools require API access to your channel data, which some creators aren’t comfortable sharing. You’re trading privacy for accuracy, and that’s a decision each creator needs to make based on their comfort level.
Niche-Specific Calculations: Why Gaming ≠ Finance Content
Different content categories face completely different monetization realities, and generic calculators often miss these crucial variations. Gaming channels deal with younger audiences and lower CPM rates, while business content commands premium rates from high-value demographics.
Content category dramatically impacts revenue potential in ways that standard calculators ignore. A finance channel with 25,000 monthly views might earn $400, while a gaming channel with identical metrics struggles to hit $100.
Content Niche Realistic CPM Range Audience Reality Revenue Challenges Gaming $0.50-$2.50 Young, global audience Lower CPM, high competition Finance/Business $3.00-$8.00 Professional, high-income Premium rates, strict compliance Education $2.00-$5.00 Engaged, diverse ages Consistent demand, evergreen potential Entertainment $1.00-$3.50 Broad demographics Viral potential, unpredictable performance Tech Reviews $2.50-$6.00 Tech-savvy, higher income Product cycles, seasonal fluctuations Lifestyle/Beauty $1.50-$4.00 Female-heavy, brand-conscious Partnership opportunities, market saturation
Gaming Content: High Engagement, Low Pay
Gaming creators often see impressive engagement metrics but struggle with lower CPM rates due to audience demographics. Advertisers know gaming audiences skew young and international, leading to reduced competition for these impressions.
However, gaming channels excel at alternative monetization through sponsorships, merchandise, and live streaming donations. The audience loyalty in gaming often compensates for lower ad revenue through these direct support mechanisms.
Extended gaming content can accommodate more ad placements, potentially offsetting lower CPM rates through volume. Strategic ad placement becomes crucial for maximizing revenue without disrupting gameplay experience.
Finance Content: Premium Rates, Premium Responsibility
Finance and business content attracts audiences with disposable income and professional interests, driving up advertiser competition and CPM rates. These viewers represent high-value targets for B2B and high-ticket consumer products.
Educational finance content often sees CPM rates 2-3x higher than entertainment content. Advertisers targeting professionals and entrepreneurs are willing to pay premium rates for access to these demographics.
The downside? Finance content faces strict compliance requirements and higher viewer expectations for accuracy. Mistakes can damage credibility faster than in entertainment niches, requiring more careful content creation.
Strategic Implementation: Using Calculators Without Losing Your Mind
Smart creators use revenue calculators as strategic planning tools, not crystal balls that guarantee specific earnings. The key is understanding their limitations while leveraging insights for content strategy and business development without making life-changing decisions based on optimistic projections.
I’ve watched too many creators quit their day jobs based on calculator projections that assumed everything would go perfectly. The reality of YouTube monetization is messier, more volatile, and more dependent on factors outside your control than any calculator can predict.
Choosing the Right Calculator: Free vs. Premium Reality Check
Free calculators work fine for basic estimates when you’re starting out, but they typically use generic industry averages that don’t reflect your specific situation. These tools give you ballpark figures without accounting for your unique audience characteristics or content niche.
Premium calculators offer advanced features like competitor analysis, growth modeling, and niche-specific calculations that can justify their cost for established creators. The additional insights often pay for themselves through improved strategic decisions, but only if you’re already generating enough revenue to make optimization worthwhile.
Here’s my reality check for calculator selection: If you’re making less than $200 monthly from YouTube, stick with free tools. If you’re consistently earning $500+, premium calculators can help identify optimization opportunities worth their subscription cost.
Calculator Selection Checklist:
-
Start with free tools to understand basic projections
-
Upgrade to premium only when monthly revenue exceeds $500
-
Look for niche-specific models relevant to your content
-
Verify real-time data integration capabilities
-
Test accuracy against your actual earnings for 2-3 months
-
Check for competitor benchmarking features if you’re growth-focused
-
Ensure customer support quality matches subscription cost
-
Compare feature sets against your actual analytical needs
Free Tools: Good Enough for Getting Started
Free calculators provide basic view-to-revenue calculations using industry averages. They work fine for initial estimates but lack the nuance needed for serious business planning or strategic decision-making.
Most free tools use generic CPM ranges ($1-4) without accounting for your specific audience demographics or geographic distribution. This approach gives you a rough idea of potential earnings but can be wildly inaccurate for channels with unique characteristics.
The biggest limitation? Free calculators can’t account for your specific growth trajectory or seasonal patterns. They provide snapshots, not strategic forecasts that help with long-term planning.
Premium Tools: Worth It When You’re Ready
Premium calculators justify their cost through competitor analysis, allowing you to benchmark your performance against similar channels in your niche. This competitive intelligence reveals optimization opportunities you might otherwise miss.
Advanced demographic analysis in premium tools helps identify your highest-value audience segments. Understanding that 30% of your audience generates 70% of your revenue enables content strategy adjustments that can significantly boost earnings per view.
Real-time performance tracking eliminates guesswork from revenue calculations. Instead of estimating your metrics, premium tools use your actual YouTube Analytics data for continuously updated projections.
Strategic Planning: Beyond Simple Revenue Estimates
Revenue calculators serve multiple strategic purposes beyond satisfying curiosity about potential earnings. Smart creators use these insights for content strategy optimization, business model validation, and resource allocation decisions that can dramatically impact channel success.
The most successful creators I know treat calculator results as starting points for strategic conversations, not final answers about their earning potential. They use projections to guide decisions about content direction, team hiring, and business model development.
According to Influencer Marketing Hub’s recent analysis, creators with 20,000 daily views can expect monthly earnings between $164-$274, but these averages hide the strategic decisions that separate high-earning channels from struggling ones.
Content Strategy Optimization: Data-Driven Creative Decisions
Calculator insights help identify which content types generate the highest revenue per view in your niche. This data helps prioritize production efforts on videos that balance audience interest with monetization potential.
I’ve used revenue projections to justify investing more time in tutorial content versus entertainment videos. When the data showed tutorials generating 2x higher RPM, the strategic decision became obvious even though entertainment content got more views.
Optimal posting frequency calculations help balance audience engagement with production capacity. More videos don’t always mean more revenue if quality suffers or audience fatigue sets in. Finding your sweet spot prevents burnout while maximizing earnings.
Business Model Validation: Reality Check Time
Projected earnings help determine whether YouTube monetization alone can sustain your desired lifestyle and business expenses. This validation prevents creators from building unsustainable business models based on optimistic assumptions.
Revenue sustainability analysis becomes crucial when planning major life changes. Understanding that your channel needs 500K monthly views to generate $2,000 consistently helps set realistic expectations about timeline and effort required.
Diversification necessity becomes clear when calculator projections show YouTube ad revenue limitations. Most creators need multiple income streams to achieve significant earnings, and recognizing this early allows for strategic planning.
Accuracy Limitations: What Calculators Can’t Predict
Even the best calculators face fundamental limitations that creators must understand. Market volatility, platform policy changes, and algorithm updates can significantly impact actual earnings versus projections, requiring creators to use calculator results as guidance rather than guarantees.
Economic downturns affect advertising spending across all platforms, potentially reducing CPM rates regardless of content quality or audience engagement. The 2020 pandemic created massive advertising fluctuations that no calculator predicted.
Platform policy changes can dramatically alter monetization rules overnight. YouTube’s evolving policies create ongoing uncertainty in long-term projections that calculators assume will remain stable.
Algorithm updates influence content discovery and audience reach in unpredictable ways. Major algorithm changes can significantly impact view counts and subsequent revenue generation, making historical data less reliable for future projections.
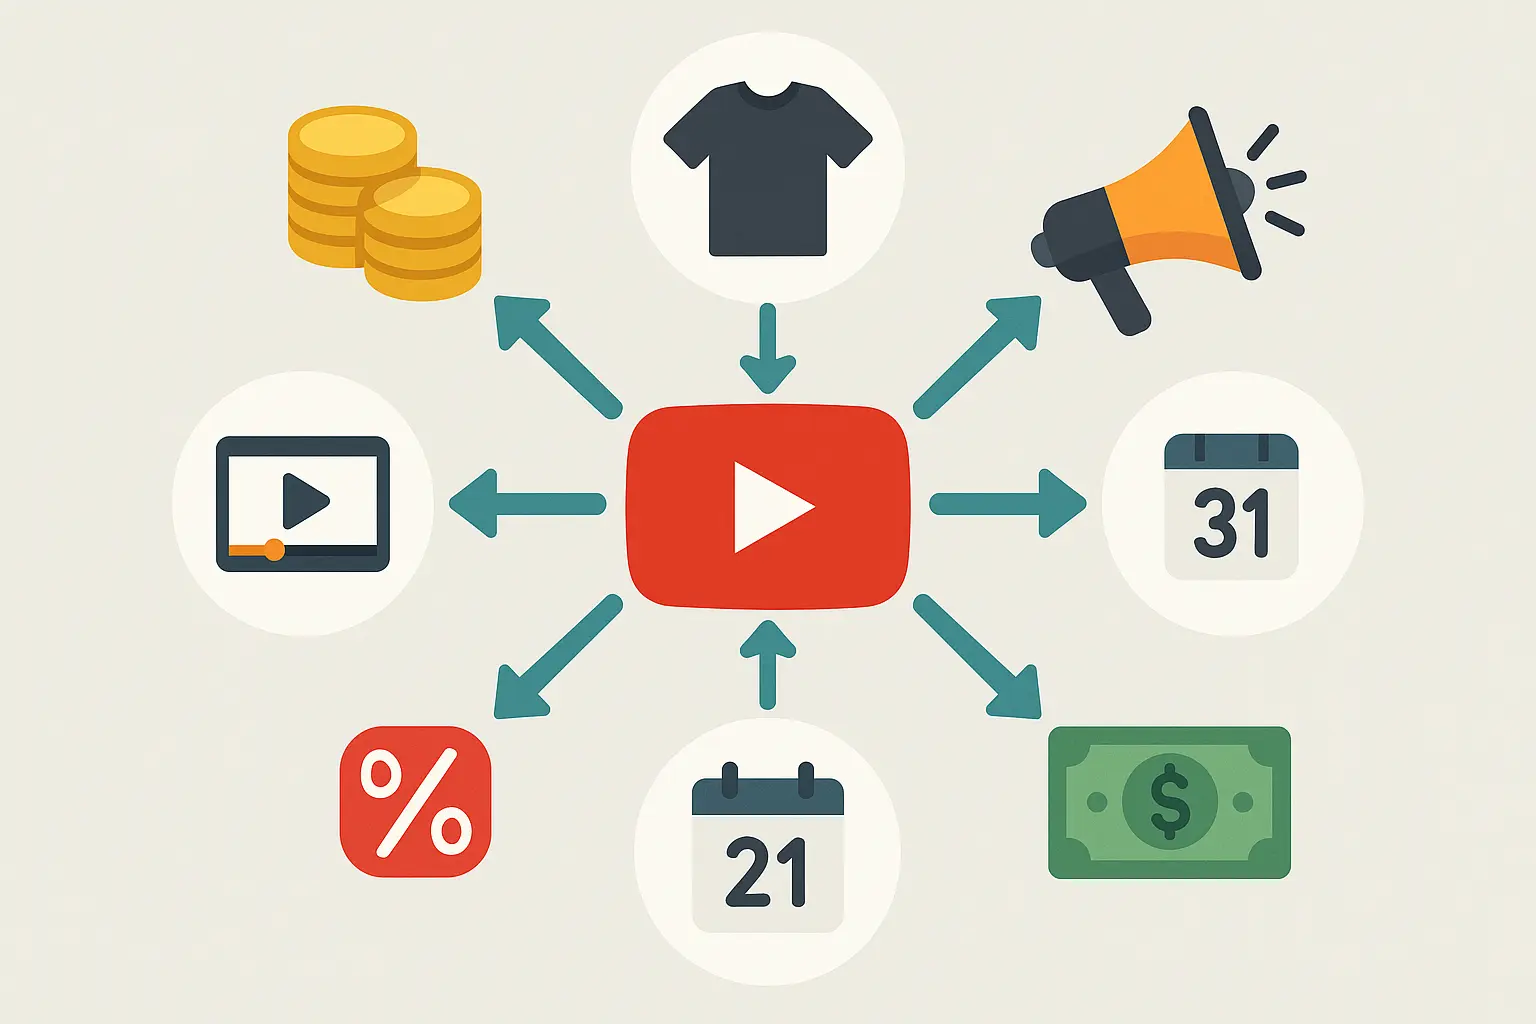
The Multi-Revenue Stream Reality
Smart YouTube creators build diversified income streams that reduce dependence on algorithm changes and advertising market fluctuations. The most successful channels I’ve analyzed earn 60-80% of their revenue from sources other than YouTube’s ad program, using multiple monetization methods to create stable, predictable income.
Revenue diversification isn’t just smart business – it’s survival strategy in the creator economy. Relying solely on YouTube ad revenue is like building your house on rented land. The platform could change the rules tomorrow and cut your income in half.
Sponsorships: Where the Real Money Lives
Brand partnerships typically generate $1-5 per 1,000 views for established channels, making sponsorship revenue significantly more lucrative than ad revenue for most creators. Once you hit 10,000+ subscribers, brands start paying attention, and the earning potential jumps dramatically.
Sponsorship rates make ad revenue look like pocket change. I’ve seen creators earn more from a single sponsored video than they make in ad revenue for an entire month. The key is building an engaged audience that brands actually want to reach.
Integrated sponsorships often generate better results than traditional ads while providing superior viewer experience. Authentic product recommendations see higher engagement and conversion rates, making creators more valuable to sponsors over time.
Reality Check: Don’t get greedy with sponsorships. I’ve watched creators destroy their credibility by promoting garbage products for quick paydays. Your audience’s trust is worth more than any single sponsorship deal.
Channel Memberships: Recurring Revenue That Actually Recurs
Channel memberships can provide income stability that fluctuating ad revenue cannot match. If you can convert even 2% of your subscribers to $5/month members, you’ve created predictable income that doesn’t depend on the algorithm.
Membership conversion rates typically range 1-5% of your subscriber base, depending on content quality and audience engagement. Educational and niche content often sees higher conversion rates than general entertainment because viewers perceive direct value.
The beauty of membership revenue is predictability. While ad revenue swings wildly with seasonal patterns and algorithm changes, membership income stays relatively stable month to month. This stability becomes invaluable for business planning.
Multiple pricing tiers can increase overall membership revenue while accommodating different supporter budgets. A $2.99 basic tier with $9.99 and $19.99 premium options often outperforms single-tier pricing strategies.
Merchandise: High Margins, High Effort
Merchandise can generate 40-60% profit margins when done correctly, but “when done correctly” involves significant effort in design, sourcing, fulfillment, and customer service. It’s essentially running a second business alongside your content creation.
Merchandise conversion rates typically fall between 1-3% of engaged viewers, with higher rates possible for channels with strong community connections. Product quality and audience loyalty significantly impact these conversion rates.
Seasonal merchandise opportunities can create significant revenue spikes during holidays or special events. Limited edition products often generate higher conversion rates and premium pricing opportunities that boost overall profitability.
Real Example: A productivity channel with 50,000 subscribers launched a $25 planner targeting their audience. With a 2% conversion rate (1,000 sales) and $15 profit margin, this single product generated $15,000 revenue – potentially exceeding their entire annual ad revenue.
Affiliate Marketing: Trust-Based Revenue Generation
Affiliate marketing commissions vary dramatically by product category and program structure. Tech products typically offer 3-8% commissions, while digital products and courses may provide 20-50% commission rates on successful referrals.
Trust-based recommendations generate significantly higher conversion rates than obvious promotional content. Authentic product reviews and tutorials typically see better affiliate performance than direct sales pitches or banner advertisements.
High-ticket affiliate products can generate substantial revenue from relatively small audiences. A single software subscription or course sale might equal hundreds of ad impressions in terms of revenue generation.
Strategic Approach: Focus on products you actually use and can authentically recommend. Your audience can detect fake enthusiasm, and damaged credibility costs more than any commission payment is worth.
Content Optimization for Revenue: What Actually Moves the Needle
Content optimization for revenue requires balancing audience satisfaction with monetization opportunities. The best strategies enhance viewer experience while maximizing earning potential through strategic production decisions that don’t compromise content quality.
I’ve tested countless optimization strategies over the years, and here’s what actually works versus what sounds good in theory. Most advice about revenue optimization ignores the fundamental truth that audience engagement drives everything else.
Video Length: The Sweet Spot Most People Get Wrong
Everyone talks about the 8-12 minute sweet spot for ad revenue, but here’s what they don’t mention – if your content sucks, longer videos just mean more time for people to click away. I’d rather have a 5-minute video with 80% retention than a 12-minute video with 40% retention.
Video length optimization should serve your content first, monetization second. The best approach is making your videos as long as they need to be, no longer. If you can cover the topic comprehensively in 6 minutes, don’t stretch it to 10 just for additional ad placements.
Mid-roll ad opportunities increase with longer content, but viewer retention must remain high to realize this revenue potential. Strategic content structuring becomes crucial – place natural breaks where ads won’t disrupt the viewing experience.
My Strategy: I script content with natural transition points every 3-4 minutes. This creates logical ad placement opportunities without forcing artificial breaks that interrupt the flow.
Thumbnails and Titles: Your Make-or-Break Moment
Thumbnail optimization often provides the highest return on investment for revenue improvement. A good thumbnail can double your click-through rate, which can literally double your revenue through increased view generation.
I’ve seen creators increase monthly earnings by $500+ just by improving their thumbnail game. The visual impact happens in milliseconds – viewers decide whether to click before consciously processing your title or topic.
What Actually Works: Clear, high-contrast images with minimal text work best. Faces perform incredibly well, especially with exaggerated expressions. Yes, it’s cheesy, but the data doesn’t lie about what generates clicks.
Title optimization requires balancing SEO considerations with compelling copy that encourages clicks. A/B testing helps identify the most effective approaches for your specific audience and content type.
SEO Strategy: Playing the Long Game for Sustained Revenue
SEO optimization creates long-term revenue opportunities through sustained organic discovery. Well-optimized content continues generating revenue months or years after publication through consistent search traffic and recommendation algorithm promotion.
Evergreen content strategy focuses on topics with consistent search demand rather than trending subjects with short-term appeal. This approach builds sustainable revenue streams that don’t depend on viral content or algorithm favor.
Keyword research integration helps identify content opportunities with high search volume and manageable competition levels. Strategic keyword targeting can dramatically improve content discoverability and long-term revenue potential.
Long-term Perspective: I have videos from 2019 that still generate $50-100 monthly because they rank well for specific keywords. This evergreen revenue often exceeds what those videos earned in their first month through the recommendation algorithm.
Upload Consistency: The Revenue Multiplier Nobody Talks About
Consistent upload schedules can increase overall channel revenue by 15-30% through improved algorithm performance and audience retention. Regular posting creates viewer expectations that drive consistent traffic patterns.
Optimal posting frequency varies by niche and production capacity, but consistency matters more than volume. Three quality videos per week often outperform daily uploads with inconsistent quality or irregular timing.
Audience expectation management through consistent scheduling helps maintain engagement levels and reduces subscriber churn during content gaps. Viewers who know when to expect new content are more likely to return regularly.
Reality Check: Don’t sacrifice quality for consistency. A reliable schedule of good content beats an erratic schedule of great content when it comes to sustained revenue generation.
Final Reality Check
YouTube revenue calculators are useful tools for strategic planning, but they’re not crystal balls that guarantee specific earnings. The most successful creators use these calculators as starting points for strategic conversations rather than definitive income predictions.
Here’s what I’ve learned after years of analyzing creator earnings: the people making serious money on YouTube aren’t obsessing over calculators – they’re creating content their audiences genuinely love while building sustainable business models around that relationship.
Revenue diversification remains crucial for sustainable YouTube income, regardless of what any calculator projects for ad revenue alone. The creators building lasting businesses combine multiple income streams while using calculator insights to optimize each revenue source.
My Final Advice: Start with conservative projections, diversify your income streams early, focus on building genuine audience connections, and treat YouTube as a business that requires multiple revenue sources to be sustainable.
And please, for everything that’s holy, don’t quit your day job based on a calculator projection. Wait until you’re consistently earning 3x what the calculator promised for at least six months. Your future self will thank you for this patience.
The hidden truth about YouTube revenue calculators? They’re most valuable when you understand their limitations. Use them as guides for your journey, not destinations in themselves. The real money comes from understanding your audience, creating valuable content consistently, and building diversified income streams that don’t depend on any single platform or algorithm.
Bottom Line: Whether you’re using basic free calculators or advanced machine learning tools, remember that consistent content quality and audience engagement ultimately determine your success more than any projection formula. Use calculators as strategic guidance, but build your business on the foundation of genuine value creation for your viewers.
