
When I first launched my game on Steam, I thought the math was simple: sell 1,000 copies at $20 each, keep 70%, boom – $14,000 in my pocket. Boy, was I wrong.
Understanding Steam’s revenue ecosystem isn’t just complex – it’s downright sneaky. While Steam takes a standard cut of 30% of each game sale, the reality involves a bunch of variables that’ll knock you flat if you’re not ready for them. Regional pricing differences, refunds that sting more than you’d expect, promotional impacts that seem great until you see the aftermath – getting accurate revenue calculations means understanding these nasty surprises so you don’t end up like my buddy Jake.
I’ll never forget the sinking feeling when Jake called me, practically in tears. He’d just hit 10,000 sales and was planning to quit his day job, only to realize his actual take-home was barely half what he’d calculated on the back of a napkin. The culprit? He used a basic steam revenue calculator without accounting for refunds, regional pricing, and Steam’s actual fee structure.
Table of Contents
-
The Brutal Truth About Steam’s Revenue System
-
Tools That’ll Help (And Tools That’ll Lie to You)
-
How to Actually Calculate What You’ll Make
-
What to Do With These Numbers Once You Have Them
TL;DR
-
Steam takes a 30% cut by default, but drops to 25% after $10M and 20% after $50M (good luck getting there)
-
Your actual revenue will probably be 30-50% lower than your optimistic napkin math
-
Third-party calculators are about as accurate as a weather forecast – they’ll give you a number, but don’t bet your rent money on it
-
Steam sales will give you a temporary high followed by a brutal crash
-
These numbers aren’t just for tracking money – they’ll help you make smarter decisions about everything from marketing spend to whether your next game is worth making
The Brutal Truth About Steam’s Revenue System
Steam’s revenue system operates on what looks like a simple 70/30 split, but that’s like saying cooking is just “add heat to food.” The devil’s in the details, and those details will eat your lunch if you’re not careful.
Here’s what nobody tells you: that 70% you think you’re getting? It’s 70% of what Steam actually collects after refunds, chargebacks, and the headache-inducing maze of regional pricing. I’ve seen too many developers get excited about their gross sales numbers without understanding what they’ll actually see in their bank account.
How Steam’s Commission Structure Actually Works (Spoiler: It’s Complicated)
Steam’s revenue sharing isn’t actually a flat 30% commission – it’s a tiered system that’s supposed to reward success but mostly just reminds most of us how far we are from the big leagues.
The standard deal gives you 70% of net sales, but that “net” part is doing a lot of heavy lifting. You’re dealing with refunds (and trust me, there will be refunds), chargebacks that come out of nowhere, and regional pricing that’ll make your head spin.
Here’s where it gets interesting – once you hit $10 million in sales, Steam’s cut drops to 25%. Push past $50 million? You’re only giving up 20%. This sounds great until you realize that according to OpenCritic, “an estimated 40% of all games released on Steam this year haven’t even recouped their $100 release cost.” So yeah, those tier bonuses are nice to dream about.
According to Impress Games, “For games that earn over $10 million (£8m), the Steam cut is reduced to 25%. For games that earn over $50 million (£40m), the Steam cut is reduced to 20%.”
|
Revenue Threshold |
Steam Commission |
Developer Share |
Example: $1M Revenue |
|---|---|---|---|
|
$0 – $10M |
30% |
70% |
$700,000 |
|
$10M – $50M |
25% |
75% |
$750,000 |
|
$50M+ |
20% |
80% |
$800,000 |

Regional Pricing Will Humble You Real Quick
Regional pricing throws a wrench into any simple revenue calculation, and it’ll humble you faster than a bad review from a streamer with 100k followers.
Steam prices games differently across markets based on local purchasing power. Your $20 masterpiece might sell for $8 in certain regions, which sounds fine until you realize that 40% of your sales are coming from those regions. Geography is not your friend when you’re trying to pay rent in San Francisco with revenue from markets where your game costs less than a coffee.
Currency fluctuations add another layer of pain. I’ve watched developers celebrate strong sales in emerging markets, only to see their actual revenue drop when those currencies weakened against the dollar. Steam handles the currency conversion, but you feel the impact when the monthly payment hits your account.
Let me break this down with a real example. Consider a $19.99 indie puzzle game that sells 10,000 copies. Sounds great, right? But if 60% of sales come from the US/EU at full price ($11,994 after Steam’s 30% cut), 30% from mid-tier markets at $12 equivalent ($2,520 after commission), and 10% from low-price regions at $6 equivalent ($420 after commission), your total revenue is $14,934. That’s significantly less than the $139,930 you’d calculate using only the US price – and we haven’t even talked about refunds yet.
The Early Access Trap and Other Special Programs
Early Access games face their own special kind of revenue calculation nightmare. You’re earning money before your game is complete, which sounds great until you realize you’re also creating expectations that your finished product might not meet.
The revenue you generate during Early Access can fund continued development, but it also creates this weird pressure where you need to balance keeping players happy with actually finishing your game. Plus, Early Access sales often cannibalize your full release sales – people who bought in early aren’t buying again at 1.0.
Steam Direct’s $100 fee per game might seem like pocket change, but it’s a fixed cost that affects your break-even calculations. For smaller indie games, this fee represents a higher percentage of total costs. I know devs whose games made $347 in their first month – that $100 fee suddenly looks a lot bigger.
Why Most Revenue Calculators Are Basically Useless
The challenging reality for indie developers is pretty grim. OpenCritic reports that “an estimated 40% of all games released on Steam this year haven’t even recouped their $100 release cost.” This highlights why you need accurate revenue projections before you even think about committing to Steam’s platform.
The $10 Million Dream (And Why It Probably Won’t Happen)
Those $10 million and $50 million thresholds aren’t just numbers – they represent Steam’s recognition that successful games deserve better terms. The problem? Getting there requires the kind of sustained performance that most indie games just don’t achieve.
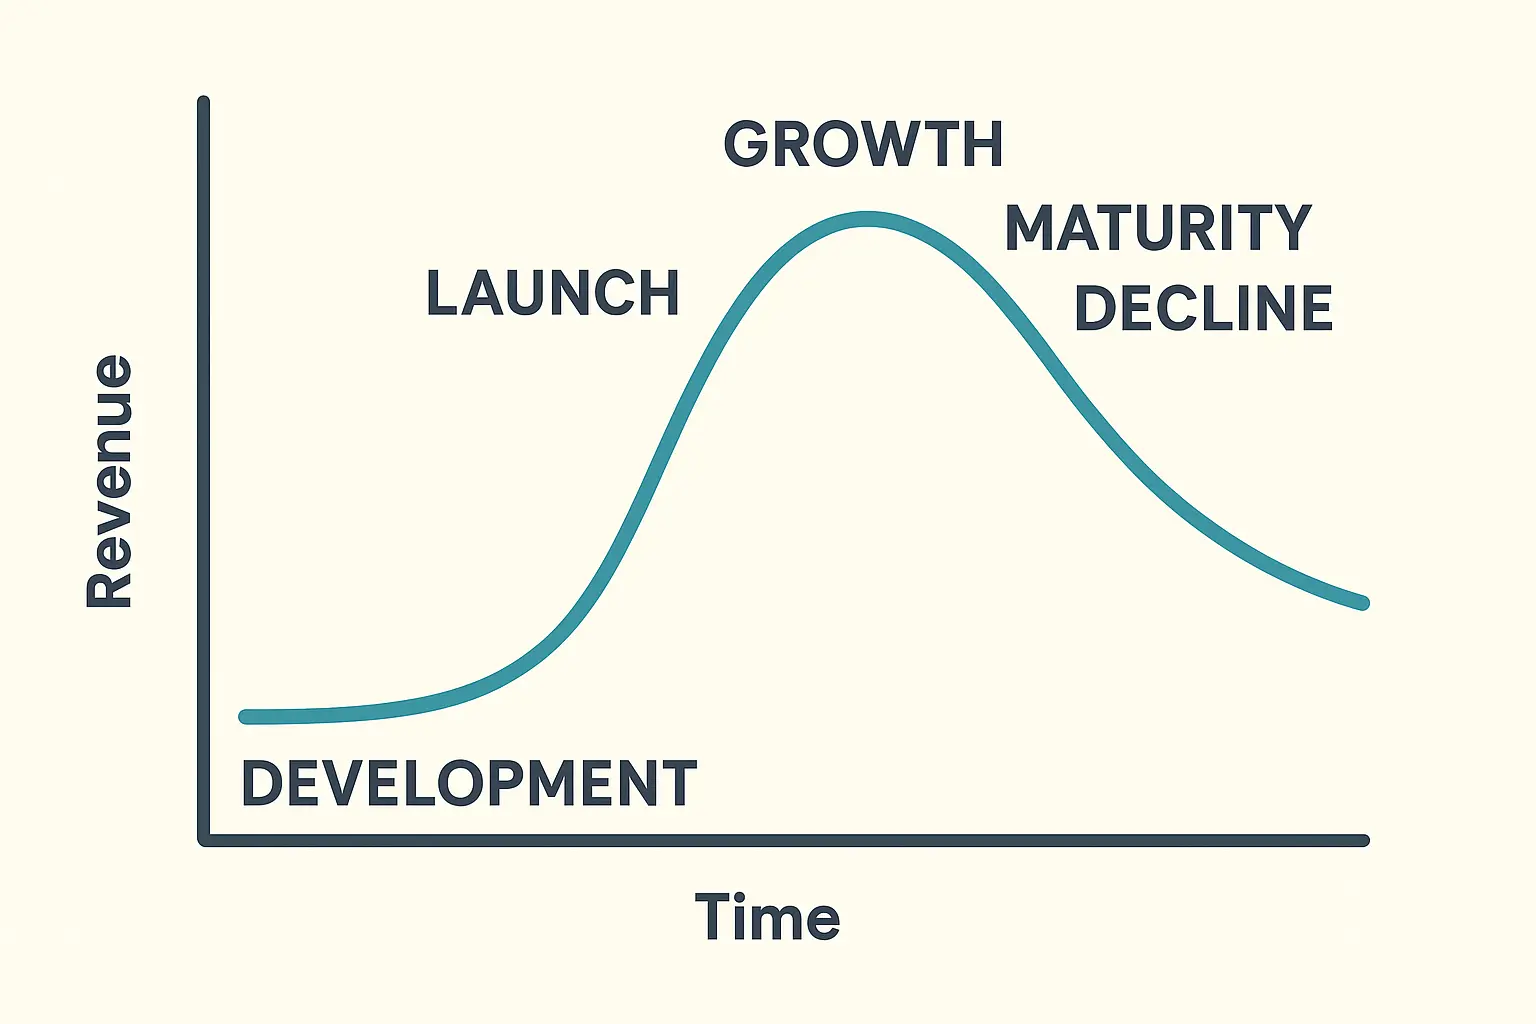
Most developers focus on launch revenue and then watch their daily sales drop from hundreds to dozens to single digits within a few months. The tiered system rewards games that maintain steady sales over years, not the ones with explosive launches followed by the inevitable crash back to earth.
What Different Regions Actually Mean for Your Bank Account
Different regions contribute wildly different amounts to your bottom line, and understanding this is crucial for realistic revenue planning. Western markets typically generate higher per-unit revenue, while emerging markets provide volume at prices that might not even cover your marketing costs.
Payment method availability also throws curveballs. Some markets have limited credit card adoption, relying on alternative payment systems that might have different fee structures or processing delays. I’ve had months where a significant chunk of my revenue was delayed because of payment processing issues in specific regions.
The Long Game: Why Launch Revenue Doesn’t Tell the Whole Story
Modern revenue analysis requires looking beyond the first month’s excitement and understanding what sustainable performance actually looks like.
Sales Velocity: The Number That Actually Matters
Sales velocity tells you way more than total units sold. A game selling 1,000 copies per day has completely different revenue implications than one that sold 30,000 copies in its first month then dropped to 100 per day. That second scenario? That’s most indie games.
I track peak concurrent players because they often correlate with sales spikes. It gives me real-time indicators of when marketing campaigns are actually working versus when I’m just throwing money into the void.
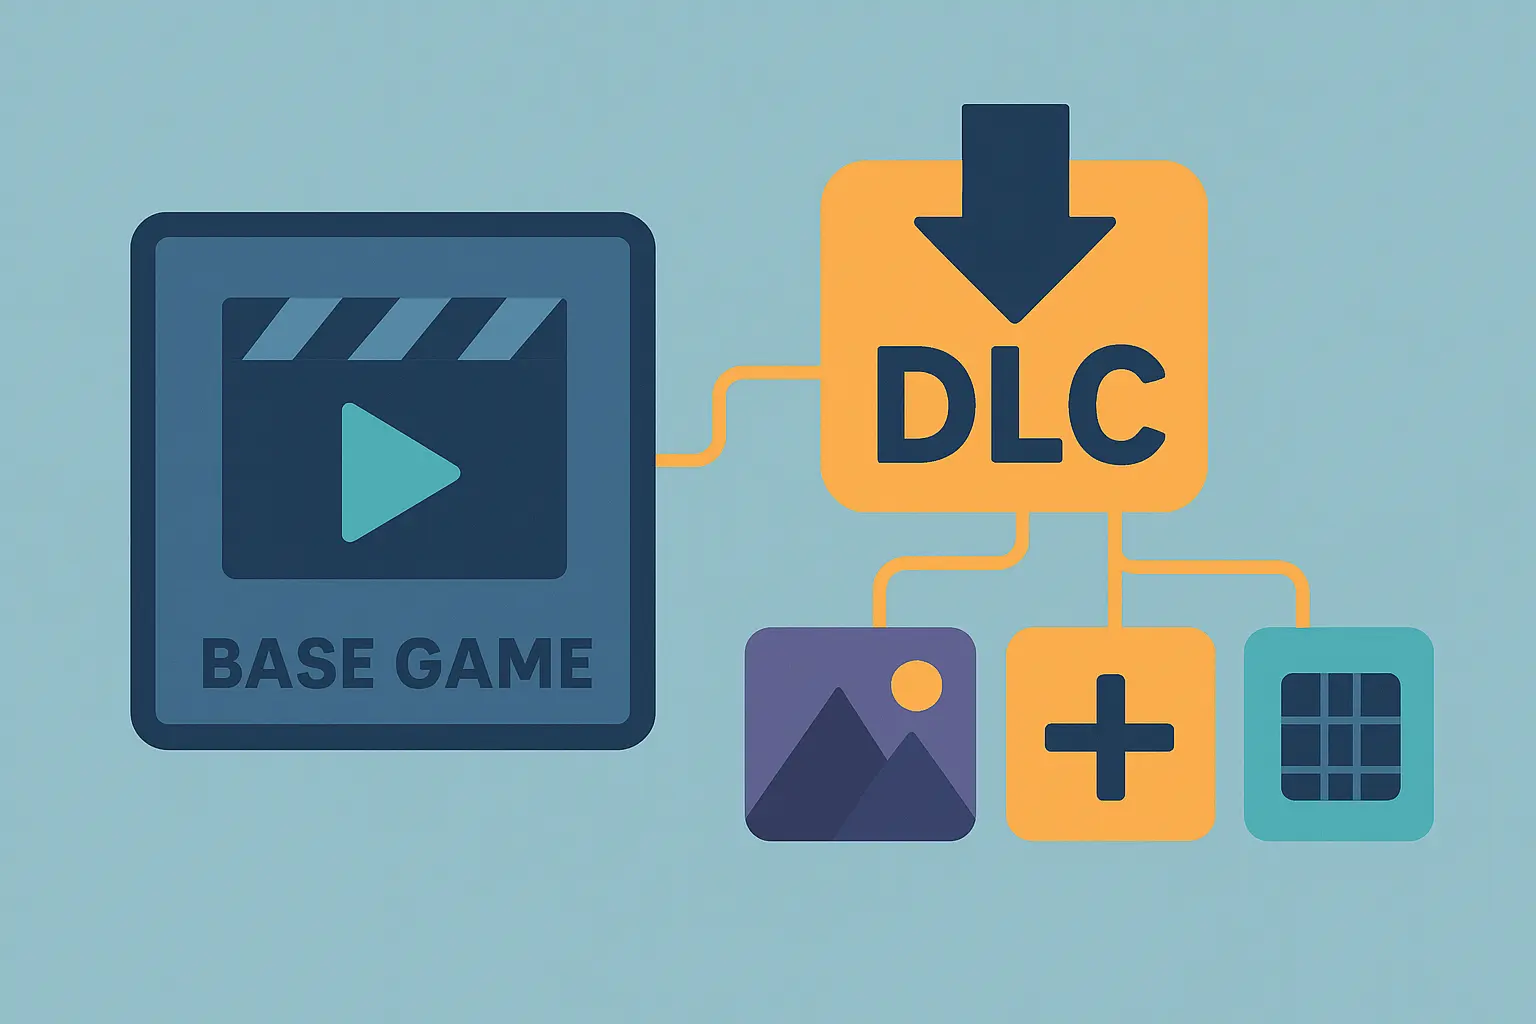
The DLC Dream vs. Reality
DLC and expansion revenue can completely change your game’s financial profile – if you can actually get people to buy it. A $20 base game that generates $40 in additional content revenue per player sounds amazing, but most players never buy DLC. The conversion rates are brutal.
Community-driven games sometimes see revenue spikes months or years after launch due to viral moments, streamer coverage, or community events. These are impossible to predict but can be significant. Your revenue calculator should account for the possibility of lightning striking, but don’t count on it paying your bills.
Tools That’ll Help (And Tools That’ll Lie to You)
Look, I’ve tried every revenue calculator out there. Steam Calculator, VG Insights, even built my own Python scraper (don’t ask). Here’s the truth: they’re all educated guesses at best. The only number that matters is what Steam deposits in your account every month.
But since we need to make decisions before we have real data, let me break down what actually works and what’s basically digital snake oil.
Third-Party Tools: Useful Lies vs. Useless Truth
External tools provide convenient revenue estimates, but their accuracy varies from “surprisingly close” to “completely divorced from reality.” Understanding how these tools work helps you figure out when to trust them and when to throw their numbers in the trash.
SteamSpy: The Good, The Bad, and The Wildly Inaccurate
SteamSpy changed the game for revenue estimation when it launched, but its data has some serious blind spots that’ll trip you up if you’re not careful.
Most SteamSpy-based calculators multiply estimated owners by current price, which is like estimating your restaurant’s revenue by multiplying the number of customers by menu prices without accounting for happy hour, coupons, or the fact that half your customers order water and split an appetizer.
The accuracy improves for games with higher player counts since SteamSpy’s sampling becomes more reliable. For smaller indie games with under 10,000 owners, the margin of error can be so wide you might as well flip a coin. I’ve seen these tools overestimate revenue by 200-300% for games that participated in major sales events.
Ask anyone in the r/gamedev Discord and they’ll tell you the same thing – those early SteamSpy estimates are usually garbage for small games. The algorithm works okay for big titles, but if you’re under 1,000 owners, you might as well use a magic 8-ball.
Revenue Estimation Reality Check:
-
SteamSpy works better for big games, terribly for small ones
-
Private profiles create massive blind spots in data
-
Historical pricing matters way more than current price
-
Regional pricing will completely mess up simple calculations
-
Bundle participation can make estimates laughably wrong
-
Refund rates vary wildly by genre and game quality
-
Always cross-reference with multiple sources (and then cut the result in half)
Professional Analytics: Expensive Guesses
VG Insights and similar platforms use multiple data sources beyond SteamSpy, which generally makes them more accurate than simple owner-count calculations. They’re particularly valuable for competitive analysis since they track multiple games simultaneously.
The downside? Most professional platforms require paid subscriptions that cost more than many indie games make in their first month. Plus, their algorithms are proprietary black boxes – you’re trusting their methodology without knowing how they actually generate their numbers.
These platforms often include confidence intervals and accuracy ratings, which is helpful for understanding how much salt to take with their estimates. But even their “high confidence” estimates can be off by 50% or more.
DIY Revenue Calculations: More Work, Better Results
Forget the fancy spreadsheets for a minute. Here’s the quick and dirty way I estimate revenue: Take your wishlist count, divide by 10 (that’s roughly how many will actually buy), multiply by your real average price (not your list price – your REAL average after sales and regional pricing), then cut that in half. That’s probably closer to reality than whatever SteamSpy is telling you.
Building a Revenue Formula That Won’t Lie to You
The basic formula looks simple: units sold × average selling price × (1 – Steam’s commission rate). But each of those variables is hiding a world of complexity that’ll bite you if you’re not careful.
“Units sold” isn’t your current owner count. You need to account for refunds, which can range from 2-15% depending on your game type and whether you shipped a broken mess. Puzzle games typically see lower refund rates than action games, while buggy launches can spike refunds to levels that’ll make you question your life choices.
“Average selling price” is where most people screw up. If you’ve run sales, participated in bundles, or have significant regional pricing variations, your actual average selling price might be 30-50% lower than your list price. This is the number that’ll make or break your revenue projections.
Here ‘s a real example that’ll hurt: A strategy game priced at $29.99 that participated in three major Steam sales (50% off), two smaller promotions (25% off), and has 40% of sales from lower-priced regions might have an actual average selling price of $18.50. Combined with a 5% refund rate and Steam’s 30% commission, the effective revenue per “sale” drops to $12.35. That’s a far cry from the $20.99 you’d calculate using just the base price.
Accounting for the Variables That’ll Kill Your Projections
Seasonal patterns will mess with your head if you’re not ready for them. Steam’s major sales events (Summer, Winter, Halloween) can represent 30-40% of annual revenue for some games, but at heavily discounted prices that make your per-unit economics look terrible.
I track my games’ performance during different promotional periods to build more accurate models. A game that sells 1,000 units at full price might sell 5,000 units at 50% off during a major sale. That results in 2.5x the revenue despite the discount, but good luck maintaining even 20% of that momentum once the sale ends.
Regional weighting requires understanding your audience distribution and accepting some uncomfortable truths about global economics. If 60% of your sales come from high-value Western markets and 40% from lower-priced regions, your revenue calculations need to reflect this split accurately – and it’s probably going to be depressing.
|
Market Segment |
Price Multiplier |
Typical % of Sales |
Revenue Impact |
|---|---|---|---|
|
Tier 1 (US/EU) |
1.0x |
50-70% |
High per-unit value |
|
Tier 2 (Eastern EU/Latin America) |
0.6-0.8x |
20-30% |
Medium volume |
|
Tier 3 (Asia/Emerging) |
0.3-0.5x |
10-20% |
High volume, low value |
How to Actually Calculate What You’ll Make
I’m writing this in 2024, and let me tell you – the Steam of today is not the Steam of 2017. Back then, getting featured could make your year. Now? You’re competing with 30+ games launching EVERY DAY. Your revenue calculations need to account for this brutal new reality.
Understanding Market Trends (Or: Why Your Genre Might Be Doomed)
Recent market analysis reveals some uncomfortable truths about where the money actually goes. Action games are the highest-grossing genre on Steam, accounting for 58.37% of the platform’s total game revenue according to Game World Observer, with RPGs following at 17.11%. If you’re making a puzzle game or visual novel, this data should give you pause about your revenue expectations.
Seasonal Sales: The High You’ll Chase Forever
Here’s what nobody tells you about those revenue spikes during Steam sales – yeah, you might sell 10x more copies, but good luck maintaining even 20% of that momentum once the sale ends. I’ve seen developers get addicted to the sale high and then panic when reality hits the following week.
During major sales, I’ve watched games increase their daily revenue by 10-20x despite 50-75% discounts. The volume increase more than compensates for the price reduction, but only if you understand the psychological trap you’re walking into.
Post-sale periods often see revenue drops of 60-80% as the market adjusts. Your revenue projections need to account for these dramatic swings rather than assuming you’ll maintain that sale-week performance. It’s like planning your budget around your best day at work and ignoring the other 364 days of the year.
Steam Sales Reality Check:
-
Figure out your genre’s typical discount during major sales
-
Calculate how much your volume actually increases (spoiler: probably not enough)
-
Factor in increased refund rates during promotional periods (people buy more impulsively, regret more quickly)
-
Account for the post-sale crash that’ll make you question everything
-
Plan your marketing spend around the sale calendar, not your launch dreams
-
Track what your competitors do and when they do it
Genre-Specific Performance: Why Your Indie Darling Might Not Make It
Strategy games often have longer revenue tails than action games, which sounds great until you realize that “longer tail” might mean “slightly less terrible decline.” A good strategy game might maintain 20-30% of its launch month revenue for years, while action games typically drop to 5-10% within six months.
Multiplayer games face completely different dynamics. Network effects can create explosive growth, but they can also lead to rapid death spirals if the player base fragments. I’ve seen multiplayer indie games go from hero to zero in weeks because they couldn’t maintain the critical mass needed for matchmaking.
Early Access games in different genres perform wildly differently too. Survival games often see strong Early Access sales that actually decline at full release (because everyone who wanted it already bought it), while strategy games might build momentum throughout their Early Access period.
The revenue concentration is brutal in some subgenres. Market data shows that “arena shooters gathered the most revenue among action games, making up 18.99% of the genre’s revenue or $9.52 billion”, but “throughout Steam’s history, there have been only 29 games in these categories that have earned more than a million dollars.” That’s winner-take-all economics that would make a casino blush.
Promotional Strategy: How to Lose Money While Feeling Successful
You’ll hear people say “just participate in every Steam sale and you’ll be fine.” That’s like saying “just eat pizza every day and you’ll be happy.” Sure, it works short-term, but you’re training your audience to never buy at full price. I know devs whose games are basically worthless outside of sales now.
Discount Strategy: The Math That’ll Make You Cry
The relationship between discount percentage and sales volume isn’t linear, and understanding this can save you from making expensive mistakes. A 25% discount might double your sales, while a 50% discount could increase sales by 5-6x. But here’s the kicker – that doesn’t always mean more revenue.
I track the revenue impact of different discount levels to build models for future promotions. Some games perform better with frequent small discounts (10-25%), while others benefit from rare deep discounts (50-75%). The trick is figuring out which camp you’re in before you destroy your game’s perceived value.
The timing of discounts matters as much as the percentage. A 30% discount during a major Steam sale might generate less total revenue than a 20% discount during a quiet period when you’re not competing with every other game on the platform for attention.
Here’s a real example that’ll hurt: An indie RPG normally selling 100 copies/day at $24.99 might see 650 copies at $14.99 during a week-long 40% discount, generating $9,744 versus the normal $1,749. Sounds great, right? But the following week typically drops to 60 copies/day as the market adjusts. You need to factor in this post-sale hangover to understand your real monthly revenue impact.
Bundle Revenue: Where Math Goes to Die
Bundle revenue allocation gets complicated faster than you can say “Humble Bundle.” Different bundles use different payment models – some pay based on your game’s relative value in the bundle, others use flat fees, and pay-what-you-want bundles are basically gambling with extra steps.
Customer choice in pay-what-you-want bundles adds another layer of chaos. Your revenue per bundle sale might range from $0.10 to $5.00 depending on customer generosity and whether your game is in the $1 tier or the “beat the average” tier.
Bundle participation can boost your game’s visibility and lead to increased full-price sales later. I factor this “halo effect” into bundle revenue calculations, though it’s about as predictable as the weather and twice as frustrating to measure.
What to Do With These Numbers Once You Have Them
Steam revenue calculations aren’t just about tracking your earnings – they’re about making smarter decisions with incomplete information. Whether you’re trying to figure out if your game is competitive, planning your next project, or deciding how much to spend on marketing, revenue data helps you make choices based on reality instead of wishful thinking.
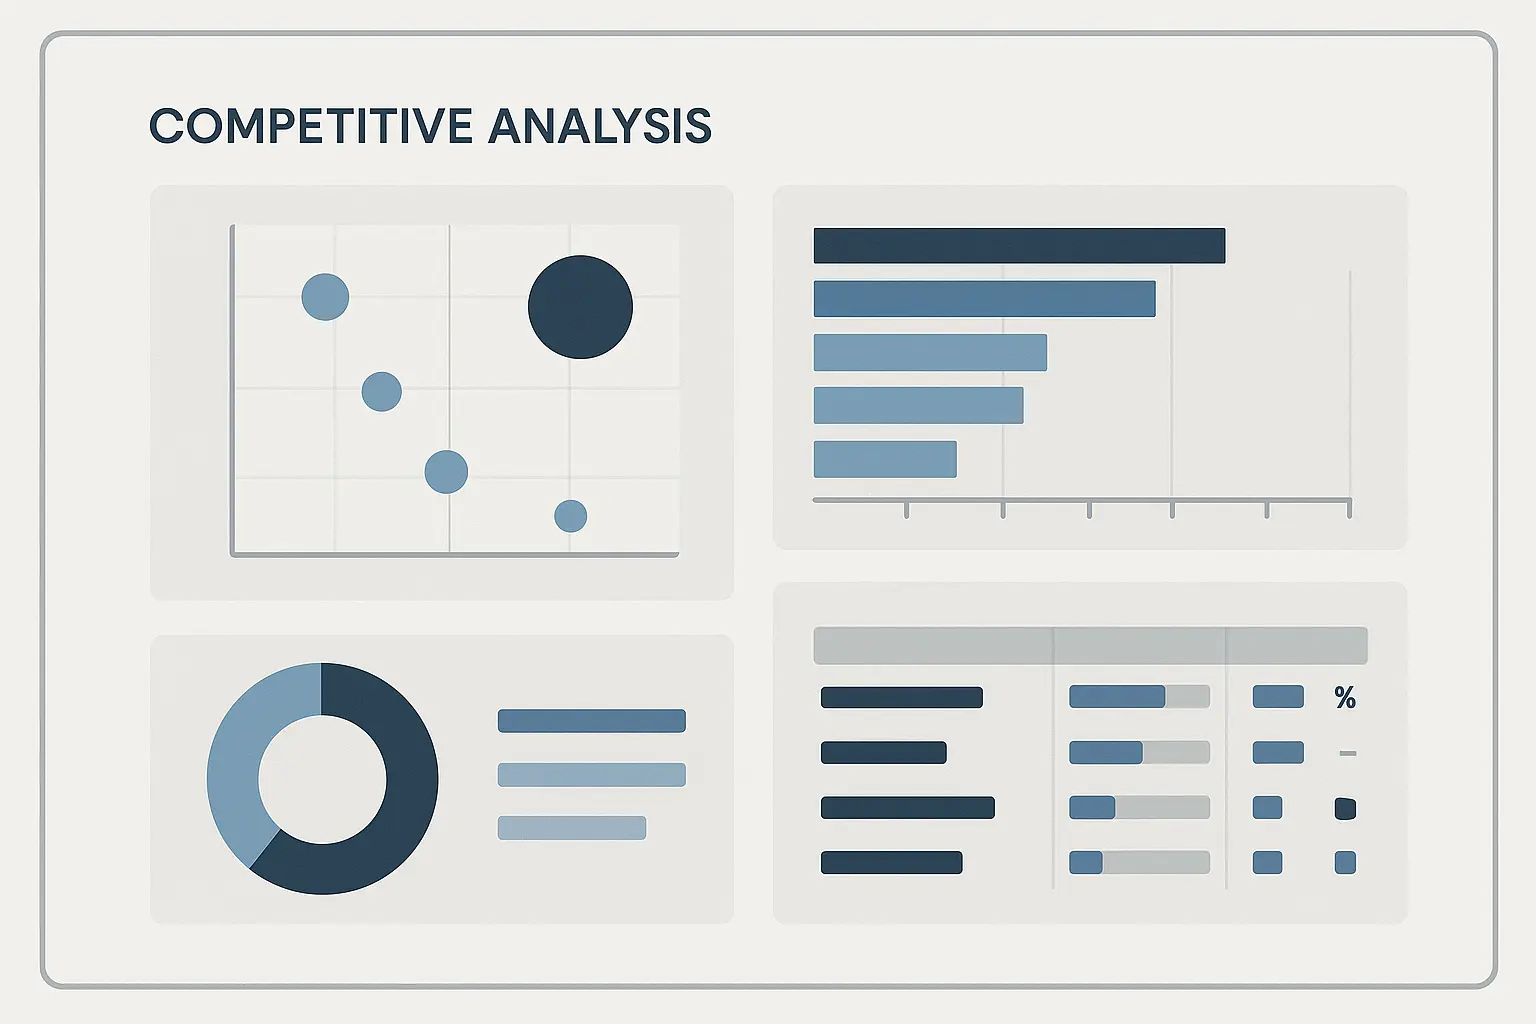
Competitive Analysis: Stalking Your Competition (Legally)
Stalking your competitors’ revenue is a dangerous game that’ll either motivate you or send you into a spiral of self-doubt. I spent months analyzing why “Generic Platformer #47” was outselling my lovingly crafted indie darling. Turns out they just had better marketing and launched during a slow week. Sometimes it’s not about the numbers – it’s about timing and luck.
Market Share: Where You Actually Stand
Understanding your market share requires calculating not just your revenue, but your competitors’ performance too. I regularly analyze the top 20-30 games in my genre to understand market dynamics and identify opportunities that might actually be achievable.
Market share analysis reveals whether your genre is growing, stable, or slowly dying. A game earning $100K monthly in a shrinking market faces different strategic challenges than one earning the same amount in a rapidly expanding category. Both situations suck, but they suck in different ways.
Revenue concentration matters more than most people realize. If the top 3 games in your genre capture 70% of total market revenue, you’re competing in a winner-take-all environment that requires completely different strategies than a more distributed market where there’s room for multiple successful games.
The revenue concentration is extreme in some subgenres, with “arena shooters ($634.8 million), battle royales ($354.2 million), and hero shooters ($206.7 million)” having the highest average revenue per game, “However, throughout Steam’s history, there have been only 29 games in these categories that have earned more than a million dollars”. Those are lottery ticket odds in markets that look lucrative from the outside.
Competitive Benchmarking: Setting Realistic Expectations
Benchmarking against similar games helps set expectations that won’t completely destroy your mental health. If comparable games in your genre average $50K in first-month revenue and you’re projecting $200K, you might need to reassess your assumptions (or your therapist’s phone number).
I track competitors’ promotional strategies and their revenue impact to inform my own marketing decisions. If a competitor sees 3x revenue spikes during 40% off sales, that data point influences my promotional planning – assuming I can handle the emotional rollercoaster of sale-driven revenue.
Launch timing analysis reveals patterns that might save you from launching into a bloodbath. If most successful games in your genre launch in specific months or avoid certain periods, that intelligence should influence your release strategy more than your personal preference for spring launches.
When conducting competitive analysis, it’s essential to develop high-impact research topics that reveal meaningful insights about your competitors’ steam revenue calculator strategies and market positioning.
Investment Planning: How Not to Go Broke Making Games
Before you quit your day job based on your revenue projections, do me a favor – multiply your conservative estimate by 0.5, then ask yourself if you can live on that for two years. Because that’s probably closer to reality, and game development takes longer than you think.
ROI Forecasting: The Math That’ll Keep You Sane
ROI forecasting requires brutal honesty about both revenue potential and total costs. Development costs are just the beginning – marketing, platform fees, and ongoing support all impact your bottom line in ways that’ll surprise you.
I build multiple ROI scenarios (conservative, realistic, optimistic) to account for the uncertainty that defines indie game development. The conservative scenario assumes lower sales, higher refund rates, and minimal viral growth, while the optimistic scenario factors in potential breakout success that probably won’t happen but keeps me motivated.
Marketing spend allocation becomes clearer when you understand revenue potential. A game with $500K revenue potential might justify $50K in marketing spend, while a $50K revenue game probably can’t support more than $5K in paid promotion without destroying your ROI.
Time-to-break-even calculations help prioritize projects in ways that might save your sanity. A game that breaks even in 3 months provides faster capital recycling than one requiring 18 months, even if the latter has higher total profit potential. Cash flow matters when you’re trying to keep the lights on.
Project Evaluation Reality Check:
-
Calculate total development costs including the opportunity cost of not having a real job
-
Estimate realistic revenue range based on genre benchmarks (then cut it in half)
-
Factor in marketing costs that’ll probably exceed your optimistic estimates
-
Determine break-even timeline for each scenario
-
Assess market timing and competitive landscape honestly
-
Evaluate team capacity and whether you can actually finish the project
-
Plan post-launch content costs and ongoing support (because players expect patches)
Portfolio Management: Knowing When to Cut Your Losses
Portfolio management requires brutal honesty about individual game performance that most developers struggle with. I regularly review each title’s revenue trajectory to identify which games deserve continued investment versus those that should be quietly retired.
Cross-promotion opportunities become apparent when you understand your portfolio’s revenue distribution. Your highest-earning game can drive traffic to newer releases, but only if the audience overlap makes sense and you’re not just annoying your existing players.
Resource allocation decisions get easier with clear revenue data. If Game A generates 60% of your portfolio revenue while requiring only 20% of your support time, that imbalance suggests where to focus your efforts – even if Game B is your “artistic vision.”
Sequel and expansion decisions depend heavily on base game revenue performance. A game earning $10K monthly might not justify a sequel, but one maintaining $50K monthly revenue probably does (assuming you can avoid the sophomore slump that kills most sequels).
The Bottom Line: What This All Actually Means
Here’s the thing about Steam revenue calculators – they’re like BMI charts. Technically useful, mostly wrong for individuals, and they’ll drive you crazy if you obsess over them. Focus on making a good game first, then worry about counting the money.
Steam revenue calculation isn’t just about tracking your earnings – it’s about understanding the complex, often brutal ecosystem that determines whether you’ll be eating ramen or steak next month. From Steam’s tiered commission structure to the soul-crushing impact of regional pricing and seasonal sales patterns, accurate revenue analysis requires attention to multiple variables that most developers either ignore or dramatically underestimate.
The difference between gross sales figures and actual net revenue can be substantial enough to determine whether you continue making games or go back to your day job. Making precise calculations essential for realistic business planning and maintaining your sanity in an industry that specializes in crushing dreams.
Mastering these calculations gives you a competitive advantage over developers who celebrate vanity metrics or make decisions based on wishful thinking. While they’re planning their victory parade based on SteamSpy estimates, you’ll have the insights needed to optimize your pricing strategy, time your promotions effectively, and allocate your marketing budget where it might actually generate results.
The gaming industry moves fast, and revenue patterns that worked last year might be completely irrelevant today. Steam’s algorithm changes, new competitors flood your market every day, and player preferences shift faster than social media trends. Regular revenue analysis helps you adapt to these changes rather than getting blindsided by market shifts that destroy unprepared developers.
Whether you’re using third-party tools or building your own calculation models, the key is understanding the assumptions behind your numbers and accepting that they’re probably too optimistic. Question your data sources, validate your assumptions against actual performance when possible, and continuously refine your approach as you gather more real-world results (and more real-world disappointments).
Revenue calculation mastery becomes even more valuable as your business grows – assuming it survives the first few games. The insights that help you optimize a single game’s performance scale up to inform portfolio management decisions, investment priorities, and long-term strategic planning. The time you invest in understanding these fundamentals pays dividends across every aspect of your game development business, even when those dividends are smaller than you hoped.
If you’re struggling to translate your Steam revenue insights into effective marketing strategies that actually drive sales instead of just burning money, The Marketing Agency specializes in data-driven campaigns that maximize ROI for digital businesses. Our performance-focused approach could help you turn your revenue analysis into targeted marketing campaigns that reach the right players at the optimal times – assuming those players exist and actually want to buy your game. Ready to stop guessing about your marketing impact and start measuring real results? We can discuss how our proven strategies might help amplify whatever Steam success you manage to achieve.
