
Table of Contents
-
Understanding Google AdSense Revenue Fundamentals
-
Calculator Tools and Implementation Strategies
-
Revenue Optimization Through Strategic Planning
-
Advanced Analytics and Performance Tracking
-
Final Thoughts
TL;DR
Look, I get it. You’ve been grinding away at your blog for months, watching those visitor numbers climb, and you’re starting to dream about that sweet AdSense money. But here’s the harsh reality most publishers face: their calculator projections are wildly off because they don’t understand what actually drives AdSense revenue.
-
Geographic location of your traffic can make or break your earnings – North American visitors are worth 3-10x more than traffic from developing countries (and most calculators completely ignore this)
-
Basic revenue formulas (Page Views × CTR × CPC) are basically useless because they miss crucial factors like bot traffic, ad blockers, and seasonal variations
-
Third-party calculators are just fancy multiplication that has no clue about your actual situation
-
Your content strategy directly impacts advertiser interest and CPC rates – high-value niches can command $5-50 per click, but you need real expertise to compete
-
Real-time performance tracking against calculator projections reveals optimization opportunities most publishers completely miss
According to Business.com, U.S. publishers in high-demand niches such as finance, technology and legal services typically see RPMs between $20 and $50, demonstrating the significant earning potential when calculator projections are properly optimized for high-value audiences.
But here’s what they don’t tell you: getting there requires way more than just plugging numbers into a calculator.
Understanding Google AdSense Revenue Fundamentals
I’ve watched countless publishers get excited about their traffic numbers, plug them into a Google AdSense calculator, and then feel absolutely crushed when their actual earnings are maybe 30% of what they expected. Nothing’s more deflating than thinking you’re going to make $2,000 this month based on some calculator, only to see $200 in your actual earnings.
The problem isn’t that calculators are broken – it’s that most people don’t understand what actually drives those numbers. Page views, click-through rates, and cost-per-click values aren’t just random numbers you can multiply together and call it a day. They’re interconnected in ways that basic calculations completely miss.
Core Revenue Metrics and Calculations
Understanding revenue fundamentals requires a comprehensive approach to analytics tracking and data interpretation to ensure your calculations reflect actual performance patterns instead of wishful thinking.
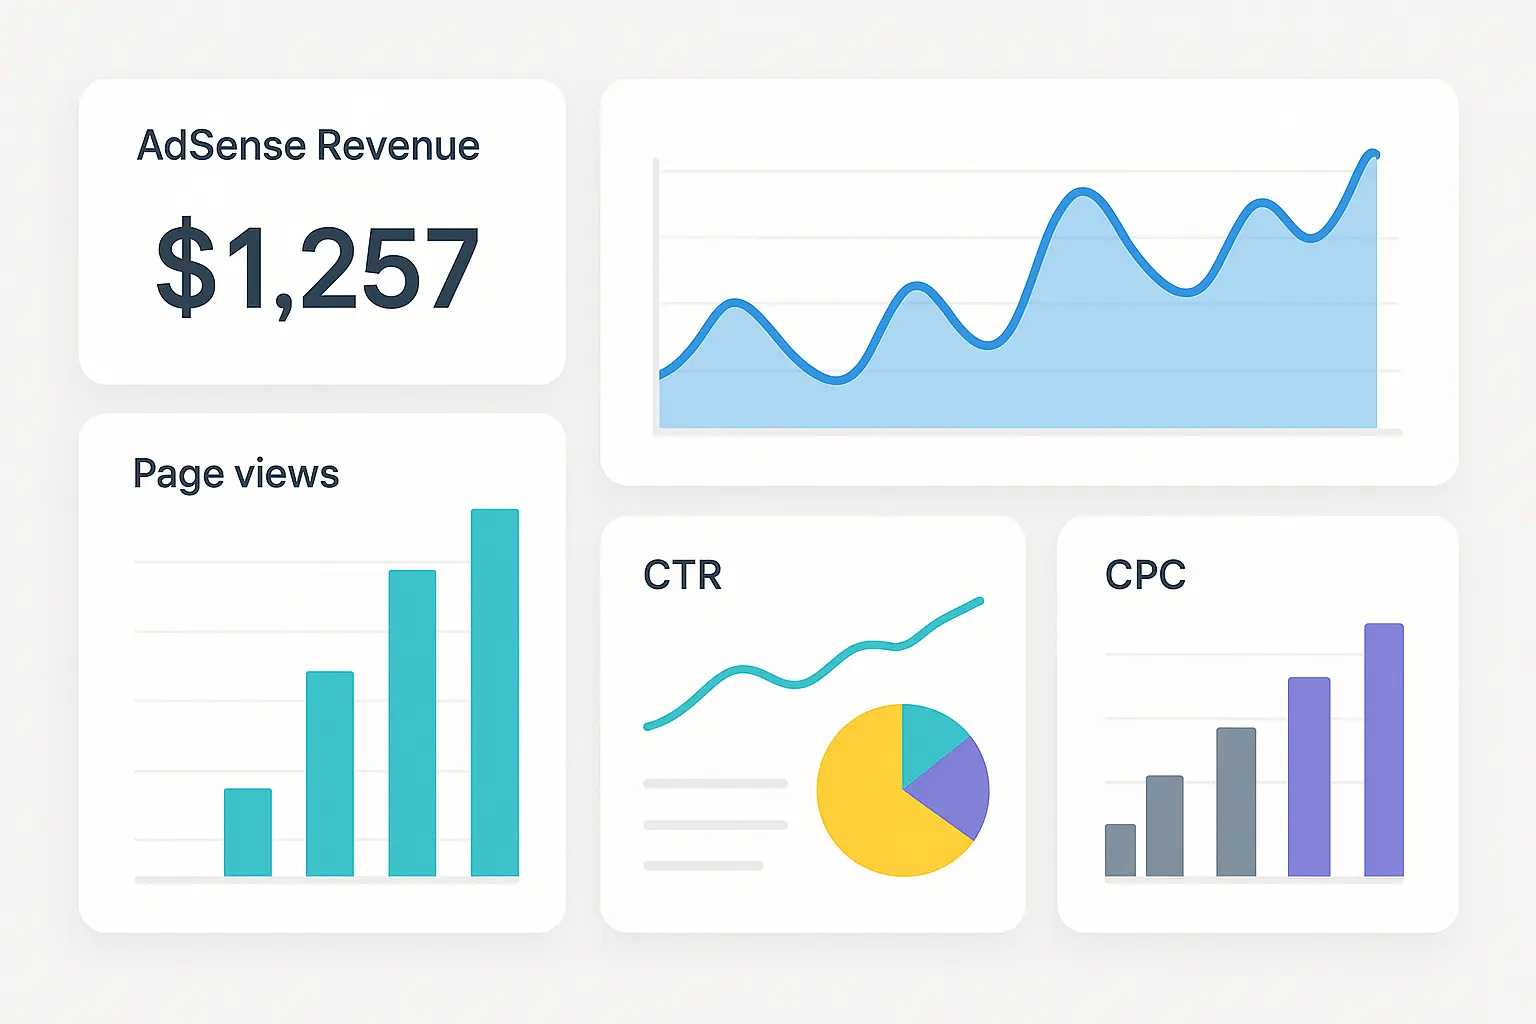
Three primary metrics determine your AdSense revenue potential, but here’s what nobody tells you: each one comes with variables that can completely destroy your projections. Page views establish your baseline traffic volume, but not all page views actually generate money. Click-through rates measure ad engagement, but they bounce around like crazy based on factors you probably haven’t considered. Cost-per-click values reflect advertiser demand, but they vary wildly based on your audience and whether advertisers actually care about your content.
Page Views and Traffic Analysis
Your page view count is the foundation of every AdSense calculation, but here’s what most people screw up: they use completely wrong traffic numbers. I’ve worked with publishers who were using total page views instead of unique page views, inflating their projections by 20-30%. Others were including bot traffic that doesn’t generate a penny of AdSense revenue.
Bot traffic is like that friend who shows up to your party but doesn’t buy anything – they inflate your numbers but don’t contribute to your wallet. Search engine crawlers, spam bots, and other automated traffic show up in many analytics tools but generate zero AdSense revenue. You need to filter this garbage out before plugging numbers into any calculator.
The integration between Google Analytics and AdSense provides the most accurate page view data for calculations because it eliminates the discrepancies between what your analytics show and what AdSense actually counts as monetizable page views. Want accurate numbers? Connect your Google Analytics to AdSense. It’s like having a direct line to what’s actually happening instead of guessing.
Here’s a real example that’ll make you double-check your numbers: A travel blog receiving 100,000 monthly page views assumed this translated directly to AdSense impressions. However, after filtering bot traffic (15,000 views) and accounting for ad blocker usage (20,000 views), only 65,000 views actually generated monetizable impressions – a 35% reduction that completely destroyed their revenue calculations.
Click-Through Rate Optimization
CTR is where I see the biggest disconnect between calculator projections and reality. Most publishers are either ridiculously optimistic about their CTR potential or have no clue how dramatically it can vary based on factors they never considered.
A 1% CTR might sound disappointing, but it’s actually solid performance for many niches. Entertainment and lifestyle sites often see CTRs around 0.5-1%, while finance and business content can achieve 2-3% with proper optimization. But here’s the kicker: new sites typically start with much lower CTRs that improve over time as you figure out what actually works.
Your ad placement strategy directly impacts CTR calculations, but most people just slap ads wherever and hope for the best. Above-the-fold ads typically perform better, but user experience matters for long-term success. I’ve seen sites increase CTR by 40% just by moving ads to more natural positions within their content flow instead of aggressive placements that make users want to immediately bounce.
Content relevance plays a huge role in CTR that most calculators can’t account for. Google’s algorithm matches ads to your content, so highly focused, problem-solving content typically generates more relevant ads and higher click-through rates than generic fluff content that could be about anything.

Cost-Per-Click Variables
CPC is the wild card in AdSense calculations because it fluctuates based on factors you can’t directly control, and most calculators use some generic average that has nothing to do with your actual situation.
Advertiser competition in your niche determines how much they’re willing to pay for clicks. Finance, insurance, and legal content command premium CPCs because these industries have high customer lifetime values. A single click from someone searching for “personal injury lawyer” might be worth $50+ to an advertiser because one client could be worth hundreds of thousands in revenue.
Seasonal trends dramatically impact CPC rates in ways that basic calculators completely ignore. Q4 (October-December) typically sees 20-50% higher CPCs due to holiday advertising spend and companies blowing their year-end budgets, while summer months often show decreased performance in many niches as advertisers pull back.
Geographic factors also influence CPC calculations, and this is where most people’s dreams go to die. The same content that generates $2 per click from US traffic might only earn $0.20 from traffic in developing countries. I’ve got a friend who runs a fitness blog with great content, but 60% of her traffic comes from India and Southeast Asia. Her RPM hovers around $0.80. Meanwhile, another blogger in the same niche with mostly US traffic? $3.20 RPM. Same exact content quality.
|
Niche Category |
Average CPC Range |
Seasonal Peak |
Geographic Variance |
|---|---|---|---|
|
Finance/Insurance |
$5.00 – $50.00 |
Q4 (+40%) |
US: 10x higher than developing |
|
Technology/Software |
$2.00 – $15.00 |
Q1, Q4 (+25%) |
Western Europe: 5x higher |
|
Health/Medical |
$3.00 – $25.00 |
Year-round |
Regulated markets only |
|
Entertainment/Lifestyle |
$0.10 – $1.00 |
Q4 (+20%) |
Minimal variance |
|
Education/Training |
$1.50 – $8.00 |
Back-to-school (+30%) |
English markets: 3x higher |
Revenue Calculation Methodologies
AdSense calculators use different approaches to estimate earnings, from simple multiplication formulas to more complex algorithms. The problem is that most people use the basic approach and wonder why their projections are completely wrong.
Basic Revenue Formula Application
The basic formula (Page Views × CTR × CPC) gives you a starting point, but it’s dangerously oversimplified for any serious revenue planning. This calculation assumes every page view generates an ad impression, every impression has the same value, and your CTR remains constant. In the real world, none of these assumptions hold up.
Here’s what actually happens: maybe 70% of your page views even count as ad impressions thanks to ad blockers, bot traffic, and users who bounce before ads load. Your CTR isn’t some steady number – it bounces around depending on whether people are actually interested in your content that day, what device they’re using, and whether your ads are even relevant.
User engagement time affects revenue in ways the basic formula can’t capture. Someone who lands on your page and bounces in 3 seconds isn’t the same as someone who reads your entire 2,000-word guide and actually engages with your content. But the basic formula treats them exactly the same.
I learned this the hard way when I was running a tech blog. Calculator said I should be making $800/month with my traffic. Reality? $340. The formula didn’t account for the fact that half my visitors were using ad blockers, or that my international traffic was worth basically nothing.
Advanced RPM-Based Calculations
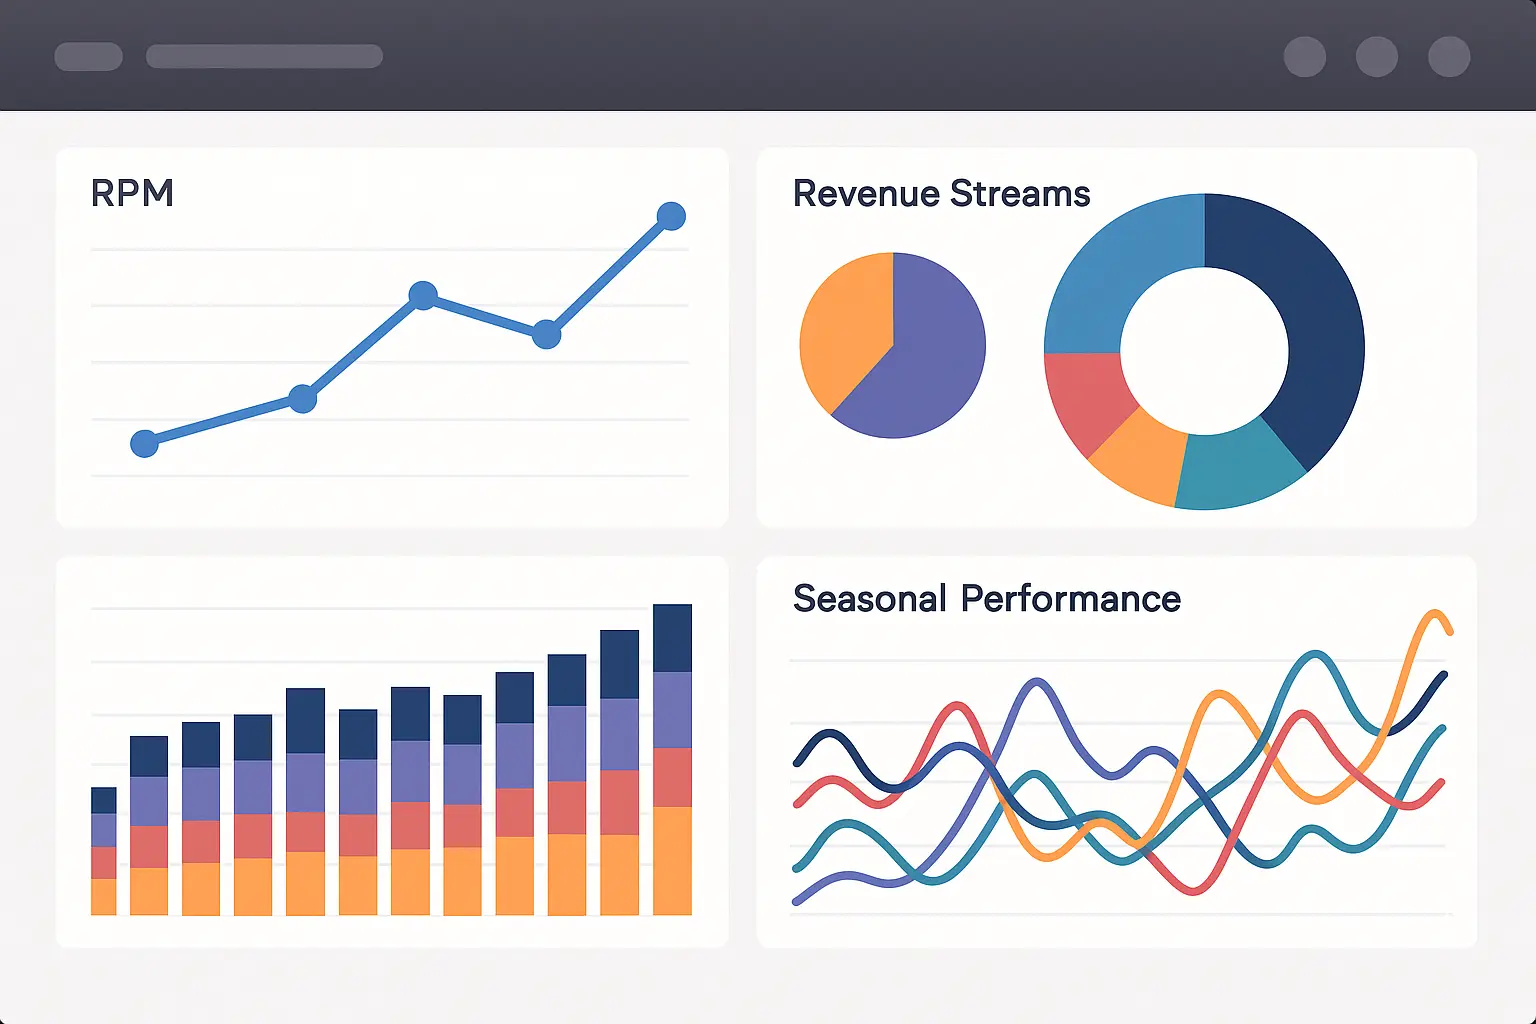
RPM calculations give you a more realistic picture of your earning potential because they account for all revenue streams, not just clicks. AdSense doesn’t just pay for clicks anymore – you get paid for impressions, video views, and all sorts of engagement that old click-focused formulas completely ignore.
I switched to RPM thinking after getting frustrated with CTR calculations that never matched reality. Now I just track: “I made $X from Y thousand page views, so my RPM is Z.” Way simpler, way more accurate for planning, and it actually reflects how AdSense pays you.
The RPM approach is particularly valuable for content sites with high traffic but lower CTRs. You might have a 0.5% CTR that looks disappointing in basic calculations, but if your RPM is $2.50, you’re actually performing well and making decent money.
Video content and interactive ad formats complicate simple revenue formulas, but RPM calculations handle these automatically. Your Google AdSense calculator projections become more accurate when they account for these diverse revenue streams instead of pretending everything is just banner ads and text links.
According to Business.com, Ranktracker’s 2025 data estimates that the average global AdSense RPM is around $10 to $20, with top-performing sites in competitive niches earning $50 or more, providing a realistic benchmark for calculator projections.
Geographic and Demographic Impact Factors
This is where most people’s calculator dreams go to die, and it’s the factor that calculators either completely ignore or handle with useless global averages.
Regional CPC Variations
I cannot stress this enough: where your traffic comes from determines whether you’re buying ramen or ribeye with your AdSense earnings. Geographic traffic distribution is probably the most underestimated factor in AdSense calculations, and most publishers are completely clueless about its impact.
US and Canadian traffic typically generates the highest CPCs across most niches. European traffic (UK, Germany, France) usually performs well too, but Eastern European countries show significantly lower rates. If you’re getting visitors from Western Europe, you’re doing okay. But traffic from developing countries? You might as well be getting paid in Monopoly money.
Asian markets vary dramatically and most calculators treat them all the same, which is completely wrong. Traffic from Japan and South Korea often performs similarly to Western markets, while traffic from India or Southeast Asia might generate CPCs that are 80-90% lower than US traffic.
This geographic impact compounds over time in ways that destroy long-term projections. If your traffic growth comes primarily from low-CPC regions, your overall RPM will decline even as your page views increase – something most basic calculators don’t account for. You could double your traffic and make less money.
Device-Specific Performance Metrics
Mobile vs. desktop performance creates another layer of complexity that most calculators completely ignore. Mobile traffic now dominates most websites, but mobile CPCs are typically 20-40% lower than desktop rates, and mobile users behave completely differently.
Mobile user behavior differs significantly from desktop users. Mobile visitors tend to have shorter attention spans, different clicking patterns, and they’re often multitasking or distracted. This affects both CTR and overall revenue per visit in ways that desktop-focused calculations miss.
Mobile ad formats are different beasts entirely. Banner ads that look great on desktop might be tiny and completely useless on mobile devices. Native ads and in-feed formats often perform better on mobile, but most calculators assume all ads perform the same regardless of format or device.
The mobile-first indexing shift means your mobile ad performance increasingly determines your overall AdSense success. Calculators that don’t account for device-specific metrics are becoming less accurate over time as mobile dominance continues growing.
Seasonal Adjustment Factors
Seasonal variations can make or break your annual revenue projections, and most calculators either ignore seasonality completely or use generic adjustments that don’t match your specific niche.
Q4 performance often accounts for 35-40% of annual AdSense earnings for many publishers, despite being only 25% of the year. Holiday shopping seasons drive increased advertiser competition, pushing CPCs higher across most niches. Even non-commercial content benefits from this increased advertising spend as companies blow their year-end budgets.
Summer months (June-August) often show decreased performance as advertising budgets shift and user behavior changes. Vacation seasons can reduce both traffic quality and advertiser spending in many verticals. I’ve seen RPMs drop 30% during summer months in some niches.
Back-to-school periods (August-September) create opportunities in education, technology, and family-related niches, but the timing and impact vary significantly by niche. Understanding these patterns helps you plan content and traffic acquisition strategies around peak earning periods instead of being surprised by revenue swings.
A personal finance blog earning $3,000 monthly in AdSense revenue during regular months might see earnings jump to $4,500 in November and December due to increased advertiser spending on holiday promotions and year-end financial planning content, representing a 50% seasonal boost that should be factored into annual projections.
Calculator Tools and Implementation Strategies
Let me be brutally honest about calculator tools: most of them are pretty useless for serious planning, but some suck less than others. The accuracy of your revenue projections depends heavily on choosing the right calculator platform and understanding what data to actually input instead of just guessing.
Available Calculator Platforms and Tools
I’ve tried every AdSense calculator out there, so you don’t have to waste your time. Here’s what I learned: third-party calculators provide quick estimates but often lack the precision of Google’s native analytics integration, which uses your actual traffic and performance metrics instead of industry averages that might have nothing to do with your situation.
Third-Party Calculator Comparison
SmallSEOTools’ AdSense Calculator is fine for getting a rough ballpark estimate. You input your daily page views, CTR, and CPC to get basic revenue projections. The tool is free and easy to use, which is about what it’s worth. It’s basically just fancy multiplication that doesn’t account for seasonal variations, geographic factors, or the fact that your traffic might be mostly bots.
Calculator.net provides a more detailed approach with options for different time periods and traffic growth scenarios. Their tool includes helpful explanations of each metric, making it educational for new publishers who don’t understand what CTR actually means. However, the projections still rely entirely on your input assumptions rather than real data, so garbage in, garbage out.
Wordstream’s revenue estimator focuses more on the relationship between content strategy and AdSense performance. It’s particularly useful for understanding how different niches might perform, but the projections are quite general and don’t account for your specific audience quality or content depth.
The main limitation of all third-party calculators is their reliance on industry averages and your assumptions. They can’t access your actual performance data, so the accuracy depends entirely on how well you understand your current metrics – which most publishers don’t.
According to Publisher Collective, header bidding can provide 35% – 65% more revenue than AdSense, with 79% of the top 1,000 US websites now using header bidding, suggesting that basic AdSense calculators may significantly underestimate earning potential for larger publishers.
Google’s Native Analytics Integration
This is the only calculator approach that actually matters. If you’re not using Google Analytics connected to your AdSense account, you’re flying blind and your projections are probably worthless.
Google Analytics 4’s AdSense integration provides the most accurate foundation for revenue calculations because it uses your actual performance data instead of making assumptions. The connection eliminates discrepancies between different tracking systems and shows you exactly what’s happening with your monetization.
The native integration shows you exactly which content generates the highest RPM, which traffic sources perform best for AdSense, and how user behavior correlates with ad performance. This data is invaluable for accurate projections because it’s based on your actual audience instead of generic industry averages.
GA4’s audience insights help you understand the demographic and geographic factors affecting your AdSense performance. You can see which audience segments generate the highest CPCs and adjust your content strategy accordingly. This beats guessing about your audience composition.
The real-time reporting capabilities mean you can track actual performance against your projections and adjust your strategies quickly. This feedback loop improves your calculation accuracy over time instead of just hoping your initial assumptions were correct.
Google Analytics 4’s comprehensive tracking capabilities provide the foundation for accurate revenue calculations, and understanding proper GA4 setup and configuration ensures your data inputs reflect real user behavior patterns.
Recent developments in digital advertising show the importance of accurate revenue tracking. According to Global Witness, Google’s parent company Alphabet reported that its revenue from network advertising was worth $31 billion in 2023, approximately $90 for every US resident, highlighting the massive scale of the AdSense ecosystem that publishers are calculating their potential share of.
Data Input Optimization and Accuracy
Garbage in, garbage out. Your projections are only as good as the data you’re feeding these calculators, and most people are feeding them complete nonsense.
Historical Performance Analysis
You need at least three months of data to make any meaningful projections, but six months is way better for understanding actual patterns instead of random fluctuations. One month tells you nothing except what happened that specific month, which could be an outlier for any number of reasons.
I track my CTR trends religiously because they tell me if my optimization efforts are actually working or if I’m just wasting time. If CTR has been steadily improving month over month, I can factor that growth into future projections with some confidence. If it’s declining, I know I’ve got serious problems to fix before making any optimistic revenue plans.
CPC trends over time help you understand whether your niche is becoming more or less valuable to advertisers. Some niches show steady growth in advertiser competition (higher CPCs), while others face declining CPCs due to market saturation or reduced advertiser interest. You need to know which direction you’re heading.
Traffic quality changes over time as your SEO efforts mature and your audience develops. New sites often see improving metrics as they attract more targeted visitors who actually care about the content, while established sites might see quality decline if they’re not maintaining their content standards or if algorithm changes affect their rankings.
Traffic Projection Methodologies
Most people are either wildly optimistic (“I’ll triple my traffic in six months because I read this blog post about SEO!”) or unnecessarily pessimistic about their growth potential. The key is building projections based on what you’ve actually accomplished, not what you hope to accomplish.
Organic growth trends from your historical data provide the most reliable baseline for projections. If you’ve been growing 15% month-over-month consistently for several months, that’s a reasonable foundation for future projections, though growth rates typically slow as you scale up.
Content strategy impacts should be quantified based on your historical performance patterns. When I increased my publishing from 8 to 12 posts per month, my traffic grew 25% over the following quarter. That’s actual data I can use for planning, not wishful thinking.
SEO improvements take forever to show results, so don’t expect immediate traffic boosts from content improvements. New posts might take 3-6 months to rank well, and technical SEO improvements are usually gradual rather than dramatic. Factor realistic timelines into your projections.
Conversion Rate Assumptions
CTR assumptions kill more revenue projections than anything else because most publishers are ridiculously optimistic about their click-through rates.
Industry benchmarks are useful for reality checks, but your specific situation matters way more than general averages. A 1% CTR might be amazing for entertainment content but terrible for finance content. Don’t just plug in industry averages and call it a day.
New sites typically start with lower CTRs that improve over time as you figure out what actually works with your audience. Don’t assume you’ll immediately hit industry averages – factor in a learning curve where your performance gradually improves as you optimize.
Ad optimization improvements can definitely boost CTR, but we’re talking 20-30% improvements with solid work, not doubling your performance overnight. Anyone promising dramatic CTR increases is probably selling something that doesn’t work.
AdSense Calculator Input Checklist:
-
Use filtered traffic data (exclude bot traffic and ad blocker users)
-
Apply device-specific CTR assumptions (mobile vs desktop)
-
Factor in geographic traffic distribution (US vs international)
-
Include seasonal adjustment multipliers for your niche
-
Account for realistic ad blocker usage rates (15-25% typically)
-
Consider content quality improvements over time
-
Plan for mobile optimization impacts on performance
-
Set realistic growth rate expectations based on historical data
Revenue Optimization Through Strategic Planning
Strategic content planning requires understanding which topics generate the highest engagement and revenue potential, making high-impact blog topic selection a crucial component of AdSense optimization.
Here’s where the rubber meets the road. Calculators are nice for daydreaming, but actually making decent money requires strategy that goes way beyond plugging numbers into formulas.
Content Strategy Alignment
High-Value Niche Identification
Not all topics are created equal in AdSense land, and this is where most people completely screw up their strategy. Some niches are swimming in advertiser money, others are fighting over scraps, and most publishers choose topics based on passion rather than revenue opportunity.
Finance and insurance are the undisputed kings of CPC. Personal loans, credit cards, insurance quotes – advertisers will pay $20-50 per click because one customer could be worth thousands to them. But here’s the catch: these niches are brutally competitive and require serious expertise and authority that takes years to build.
Technology and business content performs well too, especially B2B stuff. Software reviews, business tools, professional development content – there’s good money there and it’s not quite as cutthroat as finance. Plus, if you actually know tech, you can create genuinely helpful content that stands out.
Health and wellness content can be lucrative, but Google’s E-A-T requirements make it incredibly tough for new publishers. You basically need medical credentials to rank for anything health-related now. Fitness, nutrition, and mental health topics often perform better than medical advice content for regular publishers.
The sweet spot is finding the intersection between your actual expertise, genuine audience interest, and advertiser demand. Don’t chase high-CPC niches if you don’t have the knowledge to compete – you’ll just waste months creating content that never ranks or monetizes well.
The digital advertising landscape continues evolving, as demonstrated by recent platform changes. According to Influencer Marketing Hub, YouTube creators with 20,000 views per day and 15% engagement can earn between $164-$274 monthly, while those with 85,000 daily views can earn $8,575-$14,291 annually, showing how content creators across platforms are leveraging calculator tools to optimize their monetization strategies.
Content Volume and Quality Balance
Effective content planning involves understanding systematic approaches to topic generation that balance publishing frequency with content depth for optimal AdSense performance.
This is the eternal struggle that kills most publishers: more content generally means more traffic and ad inventory, but quality determines whether that traffic actually makes you money.
I’ve tried both approaches and learned some expensive lessons. Publishing daily mediocre content got me traffic but terrible engagement and pathetic RPMs. People would land on my pages, realize the content was thin, and bounce immediately. Publishing weekly comprehensive guides got me less traffic initially but much better monetization because people actually stayed and engaged.
Publishing frequency affects your SEO performance, which drives the traffic that feeds into AdSense calculations. Consistent publishing (even if less frequent) often outperforms sporadic bursts of content creation followed by weeks of silence.
Content depth and comprehensiveness impact user engagement metrics that directly correlate with AdSense performance. Longer session durations and lower bounce rates typically lead to better ad performance and higher RPM because users actually see and potentially click ads.
The sweet spot varies by niche and your available resources. Some publishers succeed with daily short-form content that answers specific questions, while others perform better with weekly long-form pieces that comprehensively cover topics. Calculator projections can help you model different scenarios to find your optimal approach.

Technical Implementation and Testing
Calculator insights are worthless if your technical implementation is garbage. This is where theoretical projections meet the harsh reality of user behavior.
Ad Placement Optimization Strategies
Ad placement testing is where your calculator projections get validated or completely destroyed by actual user behavior with different ad configurations.
Above-the-fold placement typically generates higher CTRs, but don’t be obnoxious about it. I’ve seen sites plaster ads everywhere above the fold and wonder why their bounce rate skyrocketed. Users will immediately leave if they feel like they’re being attacked by ads the moment they land on your page.
In-content ads often perform way better than sidebar placements, especially on mobile devices where sidebars are basically invisible. People are more likely to engage with ads that feel naturally integrated into what they’re reading rather than obvious promotional blocks.
The key is testing systematically rather than making dramatic changes all at once like most people do. A/B test one placement change at a time so you can measure the specific impact on your revenue metrics. Change everything at once and you’ll have no idea what actually worked.
Heat mapping tools like Hotjar show you where people actually look on your pages, which is way more valuable than guessing about optimal ad placement based on generic best practices that might not apply to your audience.
A technology blog testing ad placement moved one banner from the sidebar to within article content and saw CTR increase from 0.8% to 1.3% – a 62% improvement that translated to an additional $450 monthly revenue on 50,000 page views, validating their calculator projections about placement optimization potential.
Page Speed and User Experience Considerations
Page speed directly impacts your AdSense performance in multiple ways that calculators can’t predict, and most publishers completely ignore this connection.
Slow-loading pages hurt your SEO rankings, which reduces the traffic that drives your ad revenue. Every additional second of load time costs you visitors, and mobile users are especially impatient – if your page doesn’t load in 3 seconds, they’re gone along with any potential ad revenue.
Ad density affects both user experience and revenue potential in ways that require careful balancing. More ads mean more opportunities for clicks and impressions, but they also slow down your site and can frustrate users enough to make them bounce immediately.
Core Web Vitals have become crucial SEO ranking factors, and ad implementation directly affects these metrics. Heavy ad scripts can destroy your Largest Contentful Paint and Cumulative Layout Shift scores, hurting your organic traffic growth.
The balance varies significantly by niche and audience expectations. News sites can typically support higher ad density because users expect advertising, while educational content sites need cleaner experiences where users can focus on learning.
Mobile Optimization Priority Setting
Mobile optimization isn’t optional anymore for AdSense success – it’s where most of your traffic and revenue come from, and mobile performance increasingly determines your overall earnings.
Mobile ad formats are completely different beasts than desktop ads. Banner ads that look great on desktop might be tiny and completely useless on mobile devices. Native ads and in-feed formats usually perform much better on mobile because they don’t disrupt the user experience as much.
Mobile page speed is even more critical than desktop speed because mobile connections are often slower and mobile users are less patient with slow-loading pages. If your mobile pages take more than 3 seconds to load, you’re losing both traffic and ad revenue.
Your responsive design affects ad viewability and performance in ways that desktop-focused optimization misses. Ads that display perfectly on desktop might be cut off or poorly positioned on mobile devices, completely killing your CTR and revenue potential.
|
Optimization Factor |
Desktop Impact |
Mobile Impact |
Testing Priority |
|---|---|---|---|
|
Above-fold placement |
+25% CTR |
+40% CTR |
High |
|
Page load speed |
-10% bounce rate per second |
-20% bounce rate per second |
Critical |
|
Ad density |
3-4 ads optimal |
2-3 ads optimal |
Medium |
|
Responsive design |
Baseline requirement |
Revenue determining |
Critical |
|
Native ad formats |
+15% performance |
+35% performance |
High |

Advanced Analytics and Performance Tracking
Moving beyond basic calculations requires ongoing performance monitoring, competitive analysis, and strategic adjustments based on real-world data versus projections. This is where serious publishers separate themselves from people just hoping their calculator estimates come true.
Performance Monitoring and Adjustment
Real-Time Performance Tracking
Real-time tracking reveals the gaps between your Google AdSense calculator projections and actual performance, and these gaps contain valuable insights about what you’re missing in your calculations.
Daily performance monitoring helps you catch issues before they become disasters. If your RPM suddenly drops 30%, you want to know immediately so you can investigate, not at the end of the month when you’re wondering where your revenue went.
I set up automated alerts for significant performance changes because manually checking stats constantly is a waste of time. Set up notifications for RPM drops, CTR changes, or traffic anomalies that might affect your revenue, then focus on creating content instead of obsessing over daily fluctuations.
The key is tracking metrics that actually matter for revenue rather than getting overwhelmed by vanity metrics. Focus on RPM, CTR, and traffic quality metrics that directly impact your AdSense performance, not stuff like social media shares that don’t correlate with earnings.
Performance Tracking Template:
-
Daily RPM vs. projection variance: Track whether you’re above or below calculator estimates
-
Weekly CTR trend analysis: Look for patterns in click-through performance
-
Monthly traffic quality score: Evaluate geographic and device distribution
-
Seasonal adjustment factor: Compare current performance to same period last year
-
Geographic performance breakdown: Identify your top revenue-generating countries
-
Device performance ratio: Monitor mobile vs desktop earning differences
-
Content category RPM ranking: Find your highest-earning topic areas
Seasonal Pattern Recognition
Seasonal patterns in your specific niche might be completely different from general AdSense trends, and your actual data is way more valuable than industry averages for planning purposes.
Year-over-year comparisons help you separate seasonal effects from actual growth trends. A revenue increase in Q4 might just be seasonal rather than indicating improved performance, so don’t get too excited about temporary bumps.
Content planning around your specific seasonal patterns can amplify your earnings during peak periods. If you know Q4 performs well in your niche, you can prepare high-quality content to maximize that opportunity instead of scrambling at the last minute.
Weather, holidays, and cultural events all impact AdSense performance differently across niches in ways that generic seasonal advice misses. E-commerce content might peak during shopping seasons, while educational content might perform better during back-to-school periods, and travel content during vacation planning seasons.

Competitive Intelligence and Market Analysis
Understanding competitive performance requires comprehensive analysis tools, and selecting the right SEO and content analysis platforms helps benchmark your AdSense performance against industry standards.
Understanding your competitive landscape and market trends helps contextualize calculator results and identify growth opportunities that most publishers completely miss.
Industry Benchmark Comparison
Industry benchmarks provide context for your AdSense performance, but they’re not gospel truth. Your specific audience quality and content depth matter way more than general industry averages that might include terrible sites dragging down the numbers.
RPM benchmarks vary dramatically by niche and most comparison data is useless without context. A $2 RPM might be excellent for entertainment content but pretty disappointing for finance content. Understanding your niche’s typical performance ranges helps set realistic goals instead of chasing irrelevant benchmarks.
CTR benchmarks help you evaluate your ad optimization efforts objectively. If your CTR is significantly below industry averages, you have clear optimization opportunities to work on. If it’s above average, you might focus on scaling traffic growth instead of trying to fix what isn’t broken.
The key is using benchmarks as guidance rather than absolute targets that make you feel bad about your performance. Your unique situation – audience quality, content depth, technical implementation – affects your potential more than industry averages ever will.
Market Trend Integration
Market trends affect AdSense performance in ways that historical data can’t predict, and staying ahead of these changes is crucial for long-term success.
Privacy regulations and cookie deprecation are reducing ad targeting effectiveness across the board, which generally means lower CPCs in most niches. Factor this declining trend into your long-term projections instead of assuming current performance will continue indefinitely.
Ad blocking adoption varies significantly by audience and niche. Technical audiences typically use ad blockers way more frequently than general audiences, which affects your effective traffic for AdSense calculations. If you’re targeting developers or tech-savvy users, your effective monetizable traffic might be 30-40% lower than your total traffic.
Voice search and AI-generated content are changing how people find and consume content, which might affect your organic traffic growth and user behavior patterns. These trends could impact session duration and engagement metrics that correlate with AdSense performance.
The key is staying informed about industry changes and adjusting your calculator assumptions accordingly instead of just hoping things stay the same. What worked last year might not work next year due to evolving market conditions, algorithm changes, and user behavior shifts.

Market Trend Monitoring Checklist:
-
Track privacy regulation updates and their impact on targeting (GDPR, CCPA effects)
-
Monitor ad blocking adoption rates in your specific niche and audience
-
Analyze competitor RPM performance quarterly through available tools
-
Review Google algorithm changes that might affect ad serving and revenue
-
Assess emerging ad format performance (video, native, interactive)
-
Evaluate voice search impact on your content discovery and traffic patterns
-
Study mobile-first indexing effects on your search rankings and traffic
-
Track seasonal CPC trend changes year-over-year in your niche
How The Marketing Agency Can Transform Your AdSense Calculator Dreams Into Reality
When comparing optimization tools and strategies, understanding the differences between platforms like Ahrefs vs SEMrush helps inform your competitive research and keyword targeting for higher-CPC content opportunities.
Look, understanding AdSense calculator projections is just the starting line – actually hitting those revenue targets requires a comprehensive digital marketing strategy that drives quality traffic and optimizes user engagement. Most people get stuck in calculator fantasy land instead of doing the actual work needed to achieve those numbers.
The Marketing Agency gets it. They know that AdSense success isn’t just about traffic volume – it’s about attracting the right visitors with content that advertisers actually value and are willing to pay premium rates to reach.
Their data-driven SEO approach (starting from $500-$3,000 monthly) can significantly increase your organic traffic for high-CPC keywords, which forms the foundation of AdSense revenue calculations. By improving your search rankings for terms that advertisers are actively bidding on, they help transform conservative calculator projections into aggressive growth targets that you can actually achieve.
Their PPC expertise ($750-$5,000 monthly) provides valuable insider insights into keyword values and user intent that directly inform your content strategy and ad optimization efforts. When you understand what advertisers are willing to pay premium rates for through paid search, you can create content that generates higher AdSense CPCs for related topics.
Rather than throwing marketing spaghetti at the wall and hoping something sticks to improve your AdSense performance, The Marketing Agency’s ROI-focused methodology ensures every marketing dollar invested contributes to measurable improvements in the metrics that actually matter for AdSense success – quality traffic, user engagement, and content relevance.
Ready to stop dreaming about calculator projections and start achieving real AdSense revenue? Contact The Marketing Agency today to discuss how their proven strategies can accelerate your path to monetization success.
Final Thoughts
Look, AdSense calculators are useful planning tools, but they’re not crystal balls that guarantee future earnings. The difference between disappointing results and actually making decent money usually comes down to understanding what these calculators can’t account for – geographic variations, seasonal trends, and the complex relationship between content quality and advertiser interest.
Your success with AdSense isn’t just about traffic volume – it’s about attracting the right audience with content that advertisers actually want to pay for. High-CPC niches like finance and technology offer tremendous revenue potential, but they also require real expertise and authority that takes time to build. Don’t chase these niches unless you actually know what you’re talking about.
The publishers who consistently exceed their Google AdSense calculator projections are those who treat these tools as starting points for planning, not guarantees of future performance. They focus on creating genuinely helpful content while optimizing the technical aspects of their ad implementation, and they understand that real success takes consistent effort over months and years.
Remember that calculator projections are educated guesses based on assumptions that might not match your reality. Your actual performance data will always be more valuable than industry averages for making strategic decisions about your content and monetization approach. Use calculators to identify optimization opportunities and set realistic goals, but let your real-world results guide your long-term strategy.
The key is being honest about your current situation, realistic about your growth potential, and focused on the fundamentals that actually drive AdSense success: quality content, targeted traffic, and optimized user experience. Everything else is just noise that distracts from doing the work that actually moves the needle on your revenue.
